USE OF PHENOME-WIDE AND GENOME-WIDE APPROACHES TO IDENTIFY PATTERNS OF DISEASE
By
Jamie Rene Robinson
Dissertation
Submitted to the Faculty of the Graduate School of Vanderbilt University
in partial fulfillment of the requirements for the degree of
DOCTOR OF PHILOSOPHY in
Biomedical Informatics June 30, 2020 Nashville, Tennessee
Approved:
Joshua Denny, M.D., M.S.
Robert Carroll, Ph.D.
Gretchen Purcell Jackson, M.D., Ph.D.
Dan Roden, M.D.
Naji Abumrad, M.D.
ii
ACKNOWLEDGMENTS
This work would not be possible without the financial support of the National Library of Medicine Fellowship in Biomedical Informatics through the training grant 5T15LM007450-12.
I am grateful for the mentorship and support of my Thesis Committee, including Drs. Joshua Denny, Robert Carroll, Gretchen Jackson, Dan Roden, and Naji Abumrad who have guided and contributed invaluable insights into this work. I would especially like to thank the chair of my committee Dr. Joshua Denny for his guidance in research direction and producing the quality manuscripts within this thesis.
I am also indebted to the participants of Vanderbilt’s BioVU, the eMERGE network, and the UK Biobank, without which the data to perform this research would have not been available. I am also grateful to everyone in the Departments of Biomedical Informatics and General Surgery who have helped me through my fellowship and completion of this research throughout residency.
Finally, none of this would have been possible without the support of my husband, Sina Iranmanesh, as I pursued this goal as we started and have continued to grow our family.
iii
TABLE OF CONTENTS
Page
ACKNOWLEDGMENTS ... ii
LIST OF TABLES ... vi
LIST OF FIGURES ... viii
Chapter I. Introduction ... 1
Research Motivation ... 1
Specific Aims ... 2
Research Synthesis ... 4
References ... 6
II. Defining Phenotypes from Clinical Data to Drive Genomic Research ... 8
Abstract ... 9
Introduction ... 10
Use of Clinical Data in Research ... 11
Cohorts Available for Genetic Study ... 11
Current Biobanking Efforts ... 12
Repurposing of EHR Data ... 13
Rationale for use of Clinical Data for Genomics Research ... 13
Classes of Data Available in EHRs for Phenotype Curation ... 16
Processing of EHR Text Data ... 21
Challenges of Repurposing EHR Data for Research ... 22
Approaches to Identifying Phenotypes in the EHR ... 23
Logical Constraint-Based Approaches ... 26
Machine Learning (ML) Approaches to Defining Phenotypes ... 27
Supervised Machine Learning ... 28
Unsupervised Machine Learning ... 30
Phenotyping for Genomic Research ... 31
Phenotype Creation, Validation, and Implementation for Genomic Research ... 31
Scalability and Portability of EHR-derived Phenotyping Algorithms ... 32
Challenges and Opportunities of EHR Phenotypes for Genomics Research ... 36
Challenges Learned from Current Phenotyping Efforts ... 36
Future Directions ... 37
Conclusions ... 39
Acknowledgments ... 40
References ... 41
III. Genome-wide and Phenome-wide Approaches to Understand Variable Drug Actions in Electronic Health Records ... 54
Introduction ... 55
Importance of understanding drug targets and effects ... 55
iv
Overview of GWAS and PheWAS approaches ... 56
Leveraging EHRs for drug-based genomic and phenomic research ... 59
Genomic investigation aids in understanding drug mechanisms ... 60
Early evidence for drug discovery using genomic approaches ... 61
GWAS for understanding impact of genetic variation on drug efficacy ... 62
GWAS for understanding impact of genetic variation on drug toxicity ... 64
PheWAS for understanding drug response variability ... 66
Use of GWAS and PheWAS to identify opportunities for drug repurposing ... 68
Challenges of GWAS and PheWAS in drug discovery, drug repurposing, and pharmacogenomics .. 71
Emerging GWAS and PheWAS-related techniques for pharmacogenomics ... 74
Conclusions ... 77
Acknowledgments ... 78
IV. Defining the Complex Phenotype of Severe Systemic Loxoscelism Using a Large Electronic Health Record Cohort ... 90
Abstract ... 91
Introduction ... 92
Materials and Methods ... 93
Results ... 95
Demographic Characteristics ... 95
Clinical Parameters ... 99
PheWAS for Loxoscelism Phenotype ... 101
Discussion ... 104
References ... 110
V. Association of Genetic Risk for Obesity with Postoperative Complications Using Mendelian Randomization ... 115
Abstract ... 118
Introduction ... 119
Methods ... 120
Vanderbilt Cohort ... 120
Evaluating the Vanderbilt Cohort for Postoperative Complications ... 120
eMERGE Mendelian Randomization Cohort ... 121
Genotyping and Imputation in the eMERGE Mendelian Randomization Cohort ... 122
Construction of the Obesity Genetic Risk Score (GRS) ... 122
Mendelian Randomization Analyses ... 123
Surgical Cohort Analyses ... 123
Results ... 124
Demographics of the Vanderbilt and eMERGE Cohorts ... 124
BMI Associations with Postoperative Complications ... 127
Mendelian Randomization for Obesity Associations with Postoperative Complications ... 132
Discussion ... 133
Conclusions ... 135
Acknowledgements ... 135
References ... 137
v
VI. Quantifying the Phenome-wide Disease Burden of Obesity using Electronic Health Records and
Genomics ... 144
Abstract ... 146
Introduction ... 147
Results ... 150
Phenotypes Across BMI Categories in Clinical Cohort ... 150
Genetic Risk Score for Obesity ... 157
Population Attributable Risk Due to Elevated BMI ... 160
Discussion ... 160
Methods ... 163
Clinical cohort ... 163
Body Mass Index (BMI) Extraction and Categorization... 163
Clinical Cohort BMI Phenome-wide Association Study ... 164
Sensitivity Analysis for Unmeasured Confounders ... 164
Genomic Cohort Analyses ... 165
Genotyping and Imputation in the eMERGE Mendelian Randomization Cohort ... 165
UK Biobank sample selection ... 166
Construction of Obesity Polygenic Risk Scores (PRS) ... 166
eMERGE PheWAS ... 167
UK Biobank PheWAS ... 168
Prediction of Burden of Disease Attributable to Extremes of BMI ... 168
Acknowledgements ... 168
References ... 170
VII. Summary ... 224
Contributions to EHR Phenotyping ... 224
Contributions to EHR-linked Genomic Analyses ... 230
Contributions to Translational Medicine ... 234
Conclusion ... 236
References ... 238
vi
LIST OF TABLES Chapter II
Table Page
2.1. Common data classes within electronic health records (EHRs) ... 18 2.2. Data modalities used in phenotyping algorithms available on PheKB ... 20 2.3. Strengths and Weaknesses of Current Phenotyping Approaches using Electronic Health Records
(EHRs) ... 24
Chapter IV
Table Page
4.1. Clinical characteristics and outcomes of systemic loxoscelism. ... 98 4.2. Significant findings for PheWAS of loxoscelism (adjusted significance level, p < 1.2 x 10⁻⁴) ... 103
Chapter V
Table Page
5.1. eMERGE Sites and Numbers of Individuals Contributing Adult Data ... 125 5.2. Demographics for Vanderbilt and eMERGE cohorts ... 127 5.3. Association of BMI with postoperative complications ... 131 5.4. Mendelian randomization genetic risk for obesity association with postoperative complications
... 133
Chapter VI
Table Page
6.1. Associations Between BMI Categories and Common Phenotypes ... 156
vii Supplemental Table
6.1. Demographics for Clinical and Genotyped (eMERGE and UK Biobank) Cohorts ... 176 6.2. Sites and Number of Unique Individuals Contributing Adult Data for Genotyped eMERGE Cohort ... 177 6.3. Single Nucleotide Polymorphisms for Obesity 97-SNP Polygenic Risk Score Calculation ... 178 6.4. Phenotype Associations of 97-SNP PRS for Obesity in eMERGE that Replicate Associations with Class 3 Obesity ... 181 6.5. Phenotype Associations with Obesity 97-SNP Polygenic Risk Score not Clinically Associated with Class 3 Obesity ... 186 6.6. Phenotype Associations with Obesity 97-SNP Polygenic Risk Score in UK Biobank that
Replicate Associations in eMERGE cohort and Class 3 Obesity ... 187 6.7. Phenotype Associations of Genome-wide PRS for Obesity in eMERGE that Replicate
Associations with Class 3 Obesity ... 190 6.8. Phenotype Associations of Genome-wide PRS for Obesity in UK Biobank that Replicate
Associations in eMERGE cohort and Class 3 Obesity ... 199 6.9. Effect Sizes of Phenotypes Associated with Obesity Clinically and with PRS for Obesity in eMERGE and UK Biobanks ... 206 6.10. Disease Attributable to Obesity with Normalization of BMI in Obese Individuals ... 212
viii
LIST OF FIGURES Chapter II
Figure Page
2.1. Density of data in the Vanderbilt EHR-linked biobank, BioVU ... 15 2.2. Methods of electronic health record (EHR)-based phenotyping... 17 2.3. Phenotyping methodological approaches differ in their clinical and informatics resources needed
... 24 2.4. Phenotype development and validation ... 32
Chapter III
Figure Page
3.1. Genome-wide association studies (GWAS) and phenome-wide association studies (PheWAS) .. 58 3.2. Drug-specific outcomes identified through genome-wide association studies (GWAS) and
phenome-wide association studies (PheWAS) ... 67 3.3. Opportunities for drug repurposing using results of genome-wide association studies (GWAS)
and phenome-wide association studies (PheWAS) ... 69
Chapter IV
Figure Page
4.1. Cumulative Distribution of Cases by Age ... 96 4.2. Hemoglobin Fluctuation During Loxoscelism ... 100 4.3. Phenotypes and PheWAS of Individuals with Moderate-Severe Loxoscelism ... 102
ix Chapter V
Figure Page
5.1. Frequency of Surgical Procedures in Vanderbilt (A) and eMERGE (B) Surgical Cohorts. ... 126 5.2. Association of BMI with Postoperative Complications in Vanderbilt General (A) and Surgical (B) Cohorts ... 129
Chapter VI
Figure Page
6.1. Clinical and Genomic Analysis Flow ... 149 6.2. A. Association of Class 3 Obesity with Diseases in PheWAS. B. Association of Obesity 97-SNP PRS with Diseases in PheWAS in eMERGE Cohort. C. Association of Genome-wide PRS with Diseases in PheWAS in eMERGE Cohort. D. Proportion of Preventable Disease Events with Normalization of Obesity Classes 1-3 to Normal BMI. ... 152 6.3. Trends of Odds Ratios in Phenotypes Significantly Associated with Class 3 Obesity in PheWAS ... 157 6.4. Clinically observed versus Genome-wide Obesity PRS PheWAS Causal Effect Sizes ... 160
Supplemental Figure
6.1. Tipping Point Analysis for Possible Unmeasured Confounders ... 218 6.2. Association of Obesity 97-SNP PRS with Diseases in PheWAS in UK Biobank Cohort ... 219 6.3. Association of Genome-wide PRS with Diseases in PheWAS in UK Biobank Cohort ... 220 6.4. A. 97-SNP Obesity PRS Compared to Measured Body Mass Index B. Genome-wide Obesity PRS Compared to Measured Body Mass Index ... 221 6.5. Clinically observed versus Genome-wide Obesity PRS PheWAS Causal Effect Sizes for All Phenotypes ... 222
x
6.6. Number of Disease Events Attributable to Obesity with Normalization of Obesity Classes 1-3 to Normal BMI ... 223
1 CHAPTER I
Introduction
Research Motivation
The rise in available longitudinal patient information in electronic health records (EHRs) and their coupling to DNA biobanks has resulted in a dramatic increase in genomic research using EHR data for phenotypic information. Simultaneously, high-throughput methods for genotyping have considerably decreased the cost of genetic discovery while also improving in accuracy and availability. The benefit of leveraging EHRs for genomic research as opposed to prospective cohort-based studies is the ability to obtain large sample sizes with relatively less time or expense. This approach has allowed for the accumulation of unprecedented cohorts of genotyped individuals with well-defined phenotypes to drive genomic discovery.
Genome-wide association studies (GWAS) and phenome-wide association studies (PheWAS) have provided powerful methods for investigating the impact of genetic variation on phenotypes. GWAS and PheWAS are modern genetic tools for the exploration of datasets to efficiently identify genomic risk factors for disease. PheWAS is a reverse genetics approach that provides a systematic methodology for the analysis of many phenotypes, often derived from EHR data, against a specific independent variable, such as a genotype.(1) PheWAS has shown the feasibility of analyzing genomic associations with thousands of phenotypes across a cohort of individuals and finding novel associations (2–5). This approach can also be applied using various predictive attributes in the PheWAS analysis, including genetic risk scores, a set of SNPs aggregated into a single continuous score.
2 Specific Aims
This thesis describes four research projects, presented in five manuscripts, that address important gaps in the scientific evidence on the use of genotyping and phenotyping to characterize clinical diseases.
Specific Aim #1: Perform a Comprehensive Review of Approaches to High-throughput Methods of Phenotyping and Genotyping
The first aim of this thesis was to determine the current state of the evidence about the use of phenotyping and genotyping to drive research. This aim comprises two manuscripts which detailed a comprehensive review examining the current knowledge on using clinical data within EHR to derive phenotypes that can further genomic research and drug discovery. To utilize genomic data to drive discovery and improvements in clinical care, accurate and efficient phenotyping methods must be utilized. These phenotypes include specific diseases or observable traits and are used to decipher the genetic determinants of human diseases, physiologic attributes, and medication response.
We highlighted in these manuscripts the recent advances in phenotyping methods, biobanking, and drug development and repurposing accelerated by applying genome-wide association studies
(GWAS) and phenome-wide association studies (PheWAS) to longitudinal health data information, along with limitations of these methods. GWAS and PheWAS do not only provide insight into biology of diseases, but also provide opportunities for drug targeting, development, and identification of populations at risk for drug-related adverse events. Knowledge of the genetic mechanisms that drive phenotypic and drug response variation can help guide diagnosis and the tailoring of medication therapy. In addition to summarizing the current data, in this aim we focus on opportunities for future applications of phenotyping that can provide linkages between disease-gene associations and therapeutic approaches.
3
Specific Aim #2: Characterize a Rare Clinical Disease, Loxoscelism, using Electronic Health Records and Phenotyping Methods
The second research project described the use of the EHR to characterize a rare disease process, loxoscelism, that can arise following a bite from a brown recluse spider. Systemic loxoscelism in its mild form consists of nausea, vomiting, fever, chills, or arthralgia. In its more severe form, brown recluse bites may cause massive hemolysis, hemoglobinuria, acute renal failure, disseminated intravascular
coagulation, and rarely death.(6–10) In this study, we described clinical characteristics and outcomes of the largest known cohort of individuals with systemic loxoscelism to date, leveraging our large de- identified electronic clinical data warehouse. We then performed a phenome-wide association study (PheWAS) of these individuals matched to a control population to identify key differences in ~1800 phenotypes between individuals who develop systemic loxoscelism and those who do not. We aimed to demonstrate how high-throughput phenotyping methods can provide insight into diseases. In doing so, we highlighted clinical characteristics of this rare and potentially lethal illness and uncovered previously undocumented phenotypic associations.
Specific Aim #3: Evaluate the Association of a Common Disease, Obesity, and Obesity Genetic Risk with Postoperative Complications
The third research project used genotyping to derive polygenic risk scores coupled with
phenotyping to evaluate for associations of obesity with postoperative complications. Obesity, defined as a body-mass index (BMI) of 30.0 kg/m2 or greater, is known to be a strong predictor of cardiovascular morbidity and mortality. Over two-thirds of the adult population in the United States have an overweight or obese BMI.(11–14) However, the extent to which obesity and genetics determine post-operative complications is incompletely understood. We aimed to determine the influence obesity and genetic risk for obesity has on postoperative outcomes using high-throughput methods of both phenotyping and genotyping. We leveraged a large EHR population to identify specific postoperative complications,
4
including postoperative infection, incisional hernia, and small bowel obstruction, associated with BMI. In a separate cohort, we then used a polygenic risk score for BMI to investigate the relationship between genetic risk for obesity and these postoperative complications.(15) We demonstrated that both clinical and genomic risk of obesity is associated with the development of postoperative incisional hernia and
infection.
Specific Aim #4: Evaluate the Association of Obesity and Genome-wide Obesity Genetic Risk with Healthcare Disease Burden
Obesity is known to have a strong influence on the development of comorbidities and increased mortality risk. However, the extent of the role obesity has on comorbid conditions across the phenome is unknown. Further, while there are data showing obesity is a polygenic disease with a greater proportion of the variance in BMI explained with greater coverage of the genome in a polygenic risk score, it is
unknown if genome-wide polygenic risk scores perform better in phenome-wide association studies.
Therefore, we identified phenotypes associated with class 3 obesity in a clinical cohort and replicated these findings in two separate genetic cohorts using genome-wide polygenic risk scores for BMI, elucidating the complex genomic and phenomic characteristics of this prevalent disease. Class 3 obesity and polygenic risk for obesity was associated with 199 distinct phenotypes. The burden of disease associated with obesity was significant with a predicted 17.1% of disease in obese individuals potentially preventable if individuals maintained a normal BMI.
Research Synthesis
Through these specific aims, we are able to advance the knowledge on approaches to phenotyping methods to elucidate patterns of disease. Through the use of different phenotyping methods across diverse disease processes, we were able to illustrate the strengths and weaknesses of extracting data for research that was curated for clinical medicine. These methods allowed for curation of the largest dataset of
5
individuals with systemic loxoscelism and characterization of this rare disease. This thesis is also the first application of genome-wide risk scores in a phenome-wide approach, demonstrating that genome-wide polygenic risk scores have improved ability to define disease risk and associations. This body of work reduced phenome-wide phenotyping uncertainties by grouping of billing codes, large cohort sizes, and the requirement of multiple instances of the billing codes on separate days, providing results that were validated across cohorts and with both clinical and genomic predictors. These novel methods allowed us to demonstrate the full extent of the role obesity has on postoperative complications and the overall burden of disease driven by obesity in society. Translation of these findings could involve applying genome-wide risk profiling methods to identification of individuals who would benefit from environmental modifications or heightened medical awareness prior to the onset of obesity and its comorbid conditions.
6 References
1. Denny JC, Bastarache L, Roden DM. 2016. Phenome-wide association studies as a tool to advance precision medicine. Annu. Rev. Genomics Hum. Genet. 17:353–73
2. Hebbring SJ. 2014. The challenges, advantages and future of phenome-wide association studies.
Immunology. 141(2):157–65
3. Hebbring SJ, Schrodi SJ, Ye Z, Zhou Z, Page D, Brilliant MH. 2013. A PheWAS approach in studying HLA-DRB1*1501. Genes Immun. 14(3):187–91
4. Denny JC, Ritchie MD, Basford MA, Pulley JM, Bastarache L, et al. 2010. PheWAS:
demonstrating the feasibility of a phenome-wide scan to discover gene-disease associations. Bioinforma.
Oxf. Engl. 26(9):1205–10
5. Denny JC, Bastarache L, Ritchie MD, Carroll RJ, Zink R, et al. 2013. Systematic comparison of phenome-wide association study of electronic medical record data and genome-wide association study data. Nat. Biotechnol. 31(12):1102–10
6. Futrell JM. 1992. Loxoscelism. Am. J. Med. Sci. 304(4):261–67
7. Murray LM, Seger DL. 1994. Hemolytic anemia following a presumptive brown recluse spider bite. J. Toxicol. Clin. Toxicol. 32(4):451–56
8. Rosen JL, Dumitru JK, Langley EW, Meade Olivier CA. 2012. Emergency department death from systemic loxoscelism. Ann. Emerg. Med. 60(4):439–41
9. Nance WE. 1961. Hemolytic anemia of necrotic arachnidism. Am. J. Med. 31:801–7
10. Rees RS, Altenbern DP, Lynch JB, King LE. 1985. Brown recluse spider bites. A comparison of early surgical excision versus dapsone and delayed surgical excision. Ann. Surg. 202(5):659–63
11. Global BMI Mortality Collaboration null, Di Angelantonio E, Bhupathiraju S, Wormser D, Gao P, et al. 2016. Body-mass index and all-cause mortality: individual-participant-data meta-analysis of 239 prospective studies in four continents. Lancet Lond. Engl. 388(10046):776–86
7
12. Prospective Studies Collaboration, Whitlock G, Lewington S, Sherliker P, Clarke R, et al. 2009.
Body-mass index and cause-specific mortality in 900 000 adults: collaborative analyses of 57 prospective studies. Lancet Lond. Engl. 373(9669):1083–96
13. Emerging Risk Factors Collaboration, Wormser D, Kaptoge S, Di Angelantonio E, Wood AM, et al. 2011. Separate and combined associations of body-mass index and abdominal adiposity with
cardiovascular disease: collaborative analysis of 58 prospective studies. Lancet Lond. Engl.
377(9771):1085–95
14. Ogden CL, Carroll MD, Kit BK, Flegal KM. 2014. Prevalence of childhood and adult obesity in the United States, 2011-2012. JAMA. 311(8):806–14
15. Locke AE, Kahali B, Berndt SI, Justice AE, Pers TH, et al. 2015. Genetic studies of body mass index yield new insights for obesity biology. Nature. 518(7538):197–206
8 CHAPTER II
Defining Phenotypes from Clinical Data to Drive Genomic Research
Jamie R. Robinson, M.D., M.S.1, 2, Wei-Qi Wei, M.D., Ph.D.1, Dan M. Roden, M.D.1,3,4, Joshua C.
Denny, M.D., M.S.1, 3
1 Department of Biomedical Informatics, Vanderbilt University Medical Center, Nashville, TN
2 Department of General Surgery, Vanderbilt University Medical Center, Nashville, TN
3 Department of Medicine, Vanderbilt University Medical Center, Nashville, TN
4 Department of Pharmacology, Vanderbilt University Medical Center
This manuscript was published in the journal Annual Reviews of Biomedical Data Science as follows:
Robinson JR, Wei W, Roden DM, Denny JC. Defining phenotypes from clinical data to drive genomic research. Annual Review of Biomedical Data Science. 2018; 1:69-92.
9 Abstract
The rise in available longitudinal patient information in electronic health records (EHRs) and their coupling to DNA biobanks has resulted in a dramatic increase in genomic research using EHR data for phenotypic information. EHRs have the benefit of providing a deep and broad data source of health- related phenotypes, including drug response traits, expanding the phenome available to researchers for discovery. The earliest efforts at repurposing EHR data for research involved manual chart review of limited numbers of patients but now typically involve applications of rule-based and machine learning algorithms operating on sometimes huge corpora for both genome-wide and phenome-wide approaches.
We highlight here the current methods, impact, challenges, and opportunities for repurposing clinical data to define patient phenotypes for genomics discovery. Use of EHR data has proven a powerful method for elucidation of genomic influences on diseases, traits, and drug-response phenotypes and will continue to have increasing applications in large cohort studies.
10 Introduction
The widespread adoption of electronic health records (EHRs) has raised the possibility of using these data in clinical research. Abundant evidence now supports the idea that the EHR repurposed for research represents a rich data set of a patient’s health trajectory, including diseases, laboratory and radiology tests, and medications and their response, much of which can be hard to acquire in a research setting. Simultaneously, high-throughput methods for genotyping have considerably decreased the cost of genetic discovery while also improving in accuracy and availability. A key component of these are genome-wide association studies (GWAS) and whole genome and exome sequencing technologies, which systematically analyze variation across the genome. Since 2005, over 3000 GWAS have identified almost 40,000 unique SNP-trait associations (1).
The vast majority of early genomic research studies before 2010 were performed using
observational cohorts or randomized controlled trial data. Perhaps in part as a result, some of the largest GWAS published have been traits that are common to many studies, such as height and body mass index.
Nearly coinciding with the growth of genetic investigation has been the national adoption of EHRs across the United States. The national adoption rate among non-federal acute care hospitals was only 9.4% in 2008 but reached 94% by 2013 (2). The formation of EHR-linked DNA biobanks that repurpose EHR data from their clinical data stores to research-oriented databases, combined with advances in informatics tools and terminologies, led to the beginning of successful EHR utilization for genetic studies in 2010 (3–
7) The first EHR-based studies recapitulated non-EHR GWAS by focusing on well-defined clinical phenotypes to test against variation in the human genome but later gave rise to other innovative, reverse- genetics approaches such as phenome-wide association studies (PheWAS), which provide a systematic approach to the analysis of many phenotypes potentially associated with a specific genotype (8).
Critical to discovery through genomic and phenomic investigation is the accumulation of
sufficiently large sample sizes with well-defined phenotypes. These phenotypes include specific diseases or observable traits and are used to decipher the genetic determinants of human diseases, physiologic
11
attributes, and medication response. In this review, we highlight the growth of and approaches to phenotyping using clinical data within EHRs as it pertains to genomics research, limitations of these techniques, and future opportunities for integration of genotypic and phenotypic clinical data.
Use of Clinical Data in Research Cohorts Available for Genetic Study
Traditional genetic studies have used population- or clinical trial-based cohorts with prospective participant enrollment and questionnaires to gather data on specific aspects. While this approach can result in high-quality phenotypes, there are significant challenges due to the time and monetary expense required for participant accrual, retention, questionnaire completion, and validation (9, 10). Patient accrual can take months to years. Further, long-term follow-up and patient retention can be tedious or unfeasible, with exclusion of populations of patients important to include, such as those too ill to
participate or at the extremes of age. Prospective cohorts are also generally guided by a particular clinical research question, and thus phenotype data may be limited to those conditions, hindering reuse of these data for future studies examining different phenotypes.
Accordingly, EHRs have emerged as an efficient method for obtaining dense patient information for research over the last two decades. Historically, clinical data and documentation has been collected primarily to support patient care and administrative functions, such as billing. Thus, cross-sectional aggregation and querying of EHR data was not a priority. In 2003, the National Academy of Medicine (then the Institute of Medicine) released a report on the key capabilities of an EHR, noting that facilitating research is an important secondary use of EHRs (11). Early studies utilizing aggregated EHR data often consisted of epidemiological studies performed at early EHR adoption sites with well-maintained databases such as the Veterans Health Administration or UK general practice research database (12–14).
Recent efforts bringing together diverse international healthcare data have been able to study treatment
12
protocols in as many as 250 million individuals (15). Some examples of network initiatives utilizing EHR data for genomic research are detailed below.
Current Biobanking Efforts
Biobanking of genetic data linked to the longitudinal patient data available within the EHR aggregates otherwise disparate information, potentially making it available to both clinicians and
researchers. Some of the earliest biobanks linked to EHR data derived their samples from left over blood collected as part of clinical care, and would have otherwise been discarded (9). These include the Harvard Crimson, which pursued as-needed sample collection for phenotypes of interest, and Vanderbilt
University Medical Center’s BioVU, which started as a prospective collection of all individuals who did not opt-out of DNA collection as part of their routine consent to treatment (18–25)(16, 17). Since 2015, BioVU has converted to an opt-in consent model (electronically requested at the point of care) due to changes in the National Institutes of Health (NIH) Genomic Data Sharing policy requiring subject consent for data sharing (18).
Several other initiatives have been launched across the world for the development of very large EHR-linked biobanks which have started to deliver biomedical data sets comprising extensive phenotype and genotype information on hundreds of thousands of subjects. In the United States, the Electronic Medical Records and Genomics Network (eMERGE) and the Million Veteran Program (MVP) represent examples (19, 20). The MVP has recruited more than 580,000 participants and is establishing a
longitudinal study of Veterans for future genomic and clinical research that combines data from survey instruments, the EHR, and biospecimens (20).
One of the more robust EHR phenotyping efforts has been performed by the eMERGE
consortium, a national network organized and funded by the National Human Genome Research Institute with the goal of combining DNA biorepositories with EHRs for high-throughput and generalizable genomic discovery. An integral aim of eMERGE is to support the creation, validation, and dissemination
13
of phenotype algorithms by providing tools that guide the user through the stages of development, public sharing, and reuse (21).
In Europe, the UK Biobank is a large prospective study of more than 500,000 individuals to investigate the role of genetic factors, environmental exposures, and lifestyle in the causes of major diseases (22). Participants aged 40-69 years were enrolled over 4 years in 22 recruitment centers, each completing questionnaires and donating biospecimens. The emphasis is now on further phenotyping of participants and ascertaining their health outcomes through follow-up and linkages to healthcare-based datasets (23). In Asia, the China Kadoorie Biobank also has more than 500,000 individuals and has prospectively linked genomic information to both EHR data and participant surveys.
The All of Us Research Program1 is a NIH-funded initiative to build a United States research cohort of more than one million individuals, including prospective participant provided information, molecular data (including genomics), and linkage to health information in EHRs (24). Participants will be recruited from diverse healthcare centers located across the country and as “direct volunteers”, individuals who may not have a direct connection with a recruiting healthcare system.
Repurposing of EHR Data
Rationale for use of Clinical Data for Genomics Research
EHRs offer longitudinal patient information in a form that is relatively unbiased to particular diseases or research agendas, allowing for study of diverse genomic risk, diseases, and outcomes. The rich phenotypic clinical documentation coupled with laboratory data, medication receipt, family history,
1 Precision Medicine Initiative, PMI, All of Us, the All of Us logo, and The Future of Health Begins With You are service marks of the U.S. Department of Health and Human Services.
14
and environmental exposures, makes the EHR a practical data source for reuse in genomic studies. The key advantage of repurposing EHRs for research is that they are already created and maintained for healthcare delivery and prospectively accrue clinical observations and costly tests at regular intervals driven by an individual’s health trajectory.
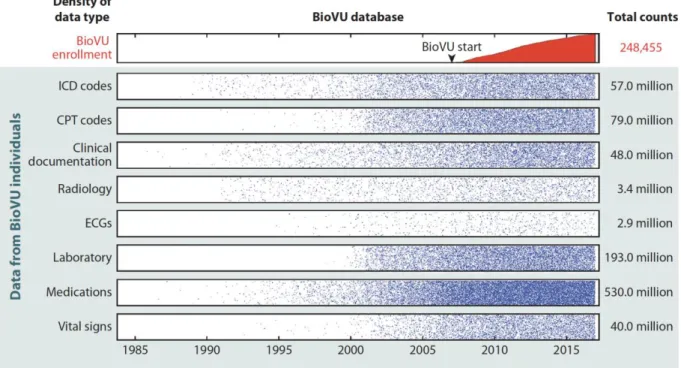
To quantify the density of information in the EHR, we explored the data available for BioVU participants (Figure 1). We found that individuals had an average of 7.8 years of clinical data, including many years before enrollment and up to 33 years of longitudinal recorded information. Much of these data are costly and may be infeasible to collect for a research trial. For example, consider the cost to obtain and clinically interpret the 3.4 million radiology tests (~14 radiology tests per patient) presented in Figure 1; these included over 628,000 computed tomography (CT) scans and nearly 192,000 magnetic resonance imaging (MRI) scans, all with clinical interpretations. Assuming a conservative estimate of
$500 per test, these CT and MRI scans alone would cost $410 million. Thus, there is a significant
reduction in research time and expense for accrual of large sample sizes with a breadth of clinical data (9, 25).
15
Figure 1. Density of data in the Vanderbilt EHR-linked biobank, BioVU. While enrollment in BioVU and accrual of samples for DNA analysis started in 2007, clinical data within the electronic health record on the individuals enrolled dated as far back as 1984. Data points were transformed by taking the square root and dividing by 20.
Another potential benefit of linking DNA repositories to EHRs is the inclusivity of EHRs in comparison to traditional population-based cohorts, which often will exclude certain diseases, children, minority or poor populations, and the elderly. This is critical for both identification of a range of cases as well as controls. Because EHR-based cohorts provide significant variability in phenotypic traits, a single cohort can be reused many times for many phenotypes or genetic variants examined (9, 26). Once the genetic data have been collected, the majority of cost and effort is thus expended at defining, refining, and validating phenotypes of interest.
Large sample sizes for modern genetic research methods, such as GWAS and PheWAS, are critical to the discovery of novel findings and afforded by the EHR (27). For both GWAS and PheWAS, there is a need to correct for multiple comparisons, increasing the threshold for statistically-significant results. For GWAS, the threshold has been established at 5x10⁻⁸ (28). While the threshold for statistical
16
significance is less well-established for PheWAS, a Bonferroni correction is often applied in these analyses, resulting in a conservative significance level that assumes independence across all phenotypes, which is unlikely given that many phenotypes of human diseases and traits are closely related. Since statistical power is a function of number of tests performed, effect size (often low for many variants), and minor allele frequency, use of this stringent threshold has necessitated use of larger and larger cohorts to enable identification of significant associations, especially those that are rare or low-frequency variants of moderate-to-large effect.
Classes of Data Available in EHRs for Phenotype Curation
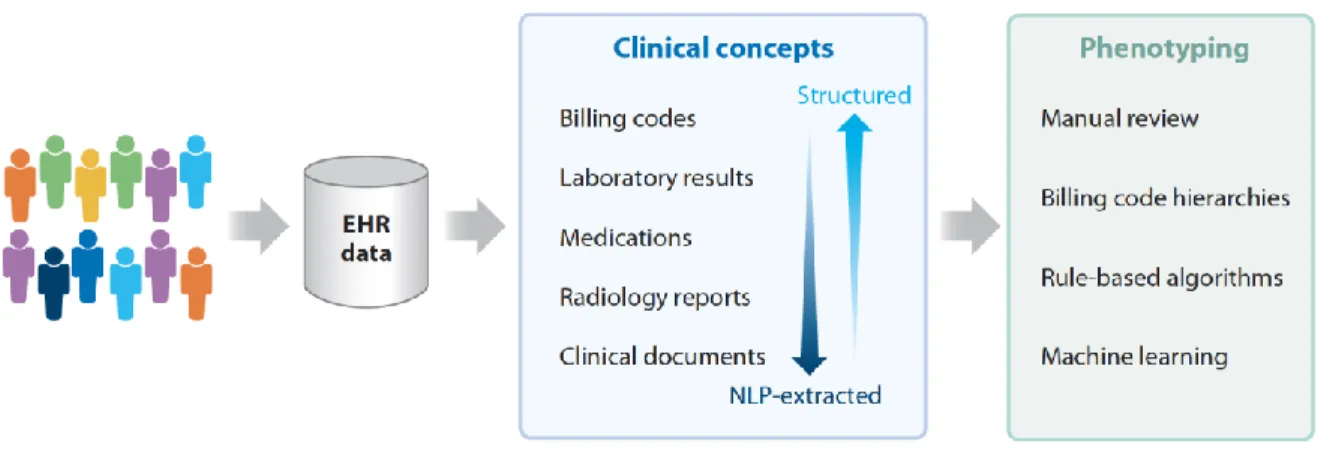
EHR phenotyping is the process of identifying individuals with an explicit observable trait from large quantities of imperfect clinical patient data (Figure 2) (29). The earliest approach to phenotyping is via manual chart review, typically performed by thorough searching of clinical documents, laboratory, and medication information by individuals with medical domain knowledge. For automation of phenotyping, EHR data, which is stored in both structured and unstructured formats, is extracted and utilized for analysis (Table 1). Structured data is typically easier for computerized extraction, with examples being billing codes, laboratory results, vital signs, and often medications. A large proportion of the EHR is relatively unstructured, including almost all clinical documentation, radiology reports, and some test or laboratory results. For many phenotypes, accurate case selection is best achieved through use of a combination of structured and unstructured data (10).
17
Figure 2. Methods of electronic health record (EHR)-based phenotyping. Clinical concepts are in both structured and unstructured (require machine-extraction) in the EHR. These concepts can be used for various forms of phenotyping.
18
Table 1. Common data classes within electronic health records (EHRs).
Demographic s
Diagnoses Procedure s
Medicatio n records
Laborator y results
Imaging Clinical text documentatio n
Data format Structured Structured Structured Partially structured
Mostly structured
Partially structured
Mostly unstructured
Data standard
None ICD9/10 CPT RxNorm LOINC DICOM
for images
SNOMED-CT
Query method
Simple Simple Simple Simple,
text searching, NLP
Simple, text searching
Simple, text searching, NLP
NLP
Recall Moderate Moderate Variable Moderate Moderate Moderate Moderate
Precision Moderate Low High Moderate High High High
Affected by healthcare fragmentatio n
No Low/moderat
e (chronic) to high (acute)
High Moderate High High Moderate
Strengths Easy to query Easy to query Easy to query
High validity for inpatient setting
High validity
High validity
Most dense clinical information;
can capture out-of-hospital history
Weaknesses Variable recall and precision based on demographic
Susceptible to inaccuracies
Susceptible to missing data
Susceptible to missing data
Variable recall and precision based on test;
susceptible to missing data
Susceptibl e to missing data;
difficult to process raw images
Most difficult to process and interpret at scale
Used in Phenotyping
Most common Most common
Common Common Somewhat
common
Somewhat common
Less common
*CPT, Current Procedural Terminology; DICOM, Digital Imaging and Communications in Medicine;
ICD-9/ICD-10, International Classification of Diseases, Ninth Revision/Tenth Revision; LOINC, Logical Observation Identifiers Names and Codes; SNOMED-CT; NLP, Natural Language Processing;
Systematized Nomenclature of Medicine-Clinical Terms
19
Billing data are the most commonly used resource for identifying phenotypes in both clinical and genomic research (21, 30). This structured data typically consists of International Classification of Diseases (ICD) and Current Procedural Terminology (CPT) codes. The ICD coding system classifies diseases, symptomatology, and procedures based on a hierarchical terminology structure maintained by the World Health Organization (WHO). CPT codes were created by the American Medical Association, and are used to bill for clinical services, such as an imaging study or surgical procedure. Both classes of billing data are ubiquitous and easily queried within EHRs, making them highly utilized as at least a portion of most phenotyping algorithms. A query of the data types used in phenotyping algorithms in the Phenotype Knowledgebase (www.pheKB.org) shows that 122 of 154 (73%) algorithms used ICD codes (Table 2), all of which used ICD-9 codes and 26 that used both ICD-9 and -10 codes. This demonstrates one challenge of using billing codes within longitudinal patient information as coding systems change over time, such as the migration from ICD-9 to ICD-10 coding in 2015 in the US, resulting in the need for mapping strategies to combine codes from different systems. Sensitivity and specificity of billing codes alone are variable across phenotypes, with one study showing a range of positive predictive values (PPVs) for ICD codes from 0.12 to 0.56 across ten diseases (29). ICD codes generally have low specificity but are highly sensitive for diseases, as a clinician may bill an ICD code for a diagnosis based upon clinical suspicion rather than confirmation of disease (31). CPT codes tend to have higher specificity, as procedural coding is quite accurate, but lower sensitivity in comparison to ICD codes due to procedures being performed at other institutions, demonstrating fragmentation of EHR data (32).
Other types of structured data within the EHR, such as laboratory results and medications, are also often used to identify phenotypes (Table 2). In particular, 53% of algorithms available on PheKB utilize medication data. Record of medication receipt can be in various forms in the EHR; however, inpatient computerized provider order entry systems and outpatient drug prescribing systems have increased the availability of drug exposures as structured data. Medication data in the absence of corroborating evidence has not been found to be especially useful, with area under the receiver operator
20
characteristic curve (AUC) of 0.54 for 10 diseases (29). Importantly, the capture of medications is essential to provide exposure data for pharmacogenomic studies (31, 33). Challenges to analyzing laboratory data in particular include the repeated measures, naming conventions, and various specimen sources, resulting in difficult interpretation. While laboratory and medication data must be placed into appropriate clinical context with careful selection, they can improve phenotyping accuracy for many conditions.
Table 2. Data modalities used in phenotyping algorithms available on PheKB. Data as of 10/15/2017.
Non-public algorithms include algorithms in development and those whose performance has not yet been validated.
Public (n = 44)
Non-public (n = 110)
Percent of total ICD-9 or -10
codes
39 73 73%
Medications 31 51 53%
CPT codes 23 44 44%
Natural language processing
28 36 42%
Laboratory test results
21 37 38%
Vital signs 5 14 12%
* ICD-9/ICD-10, International Classification of Diseases, Ninth Revision/Tenth Revision; NLP, Natural Language Processing; CPT, Current Procedural Terminology
The main source of unstructured data within the EHR is clinical documentation, consisting of the most accurate record of the providers’ thoughts and richest information for phenotype algorithms. To be useful for electronic-based phenotyping, clinical documentation must be in a format that is computable.
The majority of clinical notes consist of narrative text, lacking uniform format or structure, thus they must be processed with either basic keyword searching or modern tools such as natural language processing (NLP), discussed further in the next section.
21 Processing of EHR Text Data
Narrative clinical documentation includes a wealth of information about diagnoses, signs and symptoms, risk factors, treatments, family history, exposures, and clinical decision making, many of which are not well captured by structured information in most EHRs. Indeed, the gold standard in validating whether a patient has a diagnosis or a given trait generally involves a review of the clinical notes (30). NLP is a tool for producing computable representations from this narrative unstructured text (34). There are many approaches to NLP, ranging from rule, grammar, and machine learning (ML)-based approaches for producing comprehensive “understandings” of the text (so-called “general-purpose” NLP systems (35–40)) to focused applications applied to particular tasks (e.g., identifying medications and their features (41), or left ventricular ejection fraction (42)). General-purpose NLP systems often seek to parse unstructured text documents into phrases that can be mapped to concepts within controlled
terminologies such as the Unified Medical Language System (UMLS), the Systematized Nomenclature of Medicine-Clinical Terms (SNOMED-CT), or RxNorm (for medications) (37, 41, 43–46). Mapping the textual elements within clinical free-text documents to a semantic terminology provides a standardized method to represent the data for downstream computation. Other tasks that often improve the
performance of NLP systems include identification of negation and qualifiers (47), semantic role labeling (48), word sense disambiguation (49), and temporal analysis (50).
Some important clinical features often have historically only been found in narrative data, such as family history and smoking status. Smoking status has been the focus of many dedicated rule-based, ML, and hybrid NLP systems with F-measures ranging from 84-97% (38, 51–53). NLP also has the capacity to identify family history information with variable accuracy in prior studies (54–57). Identifying these important features within clinical documents allows the features to be reused and add meaningful information to diverse research studies. The introduction of Meaningful Use Stages 2 and 3 with the requirement for structured data entry for smoking status and family history will make these data more available over time with NLP tools (58, 59). Further, functionality such as Duke University’s MeTree,
22
which allows a patient to complete his or her own family history, are providing new avenues for increased entry of structured information in the EHR (60, 61).
Performance for concept extraction varies with recall and precision ranging from 70-90%, depending on the specific application of the NLP (36–38, 44, 62). For this reason, EHR-based phenotyping algorithms have typically combined NLP features with other data components. Specific phenotypes such as adverse events and diseases can be successfully extracted using NLP (63–68), with several studies reporting higher predictive capability for case identification through NLP (either alone or in combination with other methods) in comparison to use of billing codes alone (19, 32, 34, 64, 69, 70).
Researchers have used both general-purpose NLP systems and focused applications, but the latter have become more common, since most phenotype algorithms do not need to identify all concepts but instead require a high-precision text mining approach to identify a set of terms applicable to specific concepts. For example, nearly all Vanderbilt phenotypes involving medications have employed a general- purpose NLP tool for medication extraction (MedEx) (41), but we have used a mix of regular expressions, general-purpose NLP tools (66, 71), or ML-based approaches for specific phenotypes (72). While
general-purpose NLP systems can be utilized across a range of phenotypes, they also generally have inferior recall and precision to purpose-built approaches for defined phenotypes. Further, while NLP methods have significantly improved in the ability to identify negation and sentence structure, these algorithms remain imperfect and secular shifts in documentation, such as the transition from use of dictation to typed templates to “point-and-click” note writers, can result in instability of algorithm performance.
Challenges of Repurposing EHR Data for Research
While EHRs contain a wealth of extractable information for phenotype classification, their interface and the data generated within them are used primarily for clinical care and reimbursement, typically with little consideration towards research impact. The secondary use of EHRs for clinical,
23
genomic, and pharmacogenomics discovery can be challenged by variable accuracy, lack of standardization, irregular follow-up, incompleteness of patient records, and significant amounts of unstructured information. Inaccuracy within EHRs can result from clinical uncertainty, omissions, or billing errors. Omission can occur due to provider workload and perceptions on what is deemed to be clinically relevant to report at the time of the encounter. Due to the lack of EHR centralization, the length and depth of a patient’s record can vary greatly due to when a patient inhabits a region, what insurance the patient carries and the hospital accepts, and where a patient receives his or her care, with patients often seeing multiple disconnected providers within a region. One study to evaluate the effect of potential data fragmentation on the accuracy of a phenotyping algorithm for type 2 diabetes found that almost one- third of cases were missed if EHR data from only a single site was used (73). While completeness of the EHR is difficult to define, it is important for researchers to understand the likely limitations of the data and how it may affect study findings (74).
Approaches to Identifying Phenotypes in the EHR
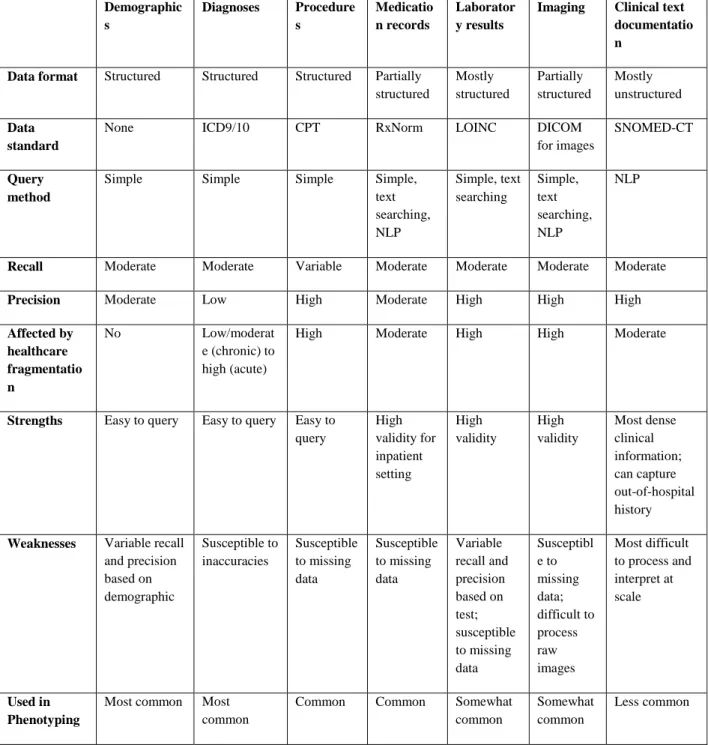
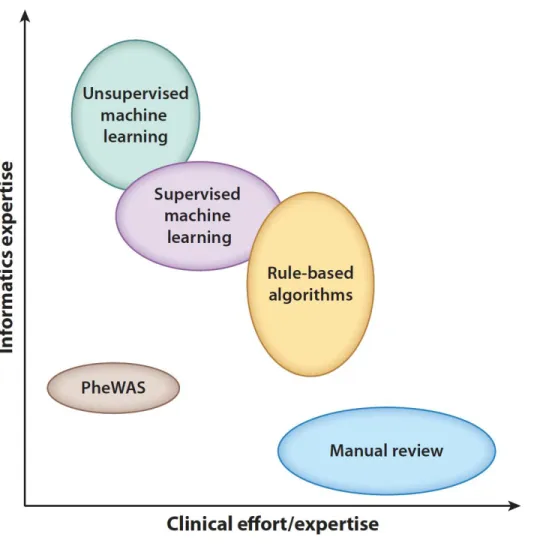
Large-scale, efficient phenotyping methods that utilize data within the EHR provide benefits that are not limited to genomic studies. Phenotyping is crucial to the identification of a population of patients that satisfy a set of criteria, which is important for clinical trial recruitment, retrospective cohort or outcomes studies, and cost analyses, among others. However, identification of patients that belong in a particular cohort is time-consuming and challenging. Different approaches to automated phenotyping have been pursued; we describe the most frequent and promising (Figure 3, Table 3).
24
Figure 3. Phenotyping methodological approaches differ in their clinical and informatics resources needed. The width/height of each oval represents the range of that type of resource needed.
Table 3. Strengths and Weaknesses of Current Phenotyping Approaches using Electronic Health Records (EHRs).
Manual chart review
Rule-based computerized phenotyping
Supervised machine learning
Unsupervised machine learning
Phenome-wide approaches (PheWAS) Description Clinician review
of medical records
Manually- created Boolean logic
Classification based on a set of features
Phenotypes learned through clustering of computer-
identified features
Systematic analysis of many phenotypes, usually using very simple rule- based approaches Data variables Can be used to
narrow records for manual review
Structured data, NLP
Structured data, NLP
Any Most commonly
billing codes but can be lab or NLP
25
Recall High Variable Variable Variable High
Precision High High High Variable Variable
Costs High Moderate;
major cost is in algorithm development
Moderate;
major cost is in creating training set
Moderate; usually needs very large data collections and computing resources
Low
Scalability of cohort size
Poor; costs directly proportional to N
High High High (large
cohorts required)
High
Scalability of phenotype number
Poor Poor Poor High High
Transportability High Variable but often high
Variable;
often less than rule- based
Variable; often less than rule- based
High
Expertise Required
Clinical domain knowledge
Clinical domain knowledge and informatics support
Clinical domain knowledge and informatics support
Little to no clinical domain knowledge, significant informatics support needed
Little to no clinical domain knowledge, minimal informatics support needed Strengths High validity,
considered gold- standard; little informatics support needed
High validity;
Ease of interpretation
Typically less costly than manual review
Can identify unspecified phenotypes;
Unbiased; No domain expertise or manual review
Ascertain broad range of phenotypes; can be used for very large populations Weaknesses Significant
knowledge and time required
Requires iterative algorithm development and manual review;
Domain and informatics expertise needed
Require manually classified training sets;
may require expert feature selection
Potentially poor interpretability or irrelevant findings if not coupled with supervised approaches
Often phenotype detail and accuracy limited by billing codes
Current use Idea for small cohorts and validation for computational methods
Often used in GWAS for single phenotypes
Often used in GWAS for single phenotypes
Rare, but increasing for identifying phenotypes from unstructured data
Hypothesis generation; drug repurposing;
interpretation of novel genomic loci
*PheWAS, Phenome-wide association studies; NLP=natural language processing
26 Logical Constraint-Based Approaches
The earliest automated approach applied to recognize patients with a particular phenotype of interest is through the use of Boolean logic. The simplest example of this is utilizing hierarchical billing code structures to determine cases and controls, as is performed in a standard PheWAS analysis.
However, more commonly these phenotype algorithms are more complex, manually-curated, and based upon rules applied in a step-wise fashion (75). Similar to the manner in which a content expert would determine case status, the logical constraint-based algorithms incorporate information from various sources of the EHR, including billing codes, clinical documents, laboratory data, and medication exposures.(19) Structured data, either data that is extracted from the EHR in structured way or is
processed into a standardized format using methods such as NLP, are necessary as input for the algorithm.
Construction and validation of Boolean algorithms are typically an iterative process with collaborations between clinical domain experts, bioinformaticians, clinical informaticians, NLP experts, and genomics researchers. Clinical experts are typically required for creation of the algorithm itself, and manual effort is required for review of at least a subset of the case and control cohorts classified by each algorithm to ensure the algorithm’s accuracy. The time and effort required is extremely phenotype dependent as the algorithms can vary from fairly simple to very complex. For example, the number of rules in an algorithm can differ dramatically: a 2012 review of 9 phenotypes found that algorithms contained between 8 and 174 rules for case identification (76).
Logical constraint-based approaches to phenotyping have several advantages. The most profound benefit is that they are the simplest to interpret and implement, allowing them to be more readily
replicable and transferable across different EHRs or clinical enterprises (21, 26, 66). In 2011, a GWAS was performed to identify associations with primary hypothyroidism using a phenotyping algorithm developed at a single site and implemented to be transportable across EHRs and institutions (26). This algorithm incorporated billing codes, laboratory values, text queries, and medication records within five
27
separate EHRs. Overall, the algorithms’ PPVs were 92.4% and 98.5% for cases and controls, respectively.
For the controls, PPVs at all sites were above 95%, while PPV for cases as varying sites ranged from 82- 98%, with the lowest PPV mainly due to misclassification of individuals who had undergone
thyroidectomy elsewhere or in the distant past. Experience has shown that algorithms developed for identification of rare phenotypes or those including only billing codes for case determination typically have the poorest performance.
These algorithms work well for circumstances in which high validity is needed for a single phenotype for a disease or simple trait that may need to be applied across multiple institutions. The ease of interpretation makes logical constraint-based algorithms attractive to clinicians, and thus research results potentially more translatable to clinical practice, and they can easily be applied to large data sets.
The principal limitation is that a new algorithm needs to be created for each new phenotype pursued.
Machine Learning (ML) Approaches to Defining Phenotypes
ML-based algorithms have been proposed as a method to achieve the improved accuracy and breadth needed to scale phenotype annotation. ML approaches can automate the identification of complex patterns to classify individuals into different groups, such as a case or control for a given phenotype. The traditional approach to ML is that of supervised learning, in which an expert creates a “gold standard” of classified individuals and a feature set used for determination and then the trained algorithm can be used to make predictions on unlabeled examples (77). When individuals are not labeled into groups, an unsupervised learning approach can be applied, which attempts to find natural clusters or patterns of data and individuals. An unsupervised approach can also be used for feature extraction and then tested against an annotated outcome of interest for creation of the classifier (which can be viewed as a type of
supervision). Fully unsupervised ML requires no need for domain expert annotation or feature selection;
thus this approach is high-throughput and scalable but also can lead to greater difficulty in interpretation.
28 Supervised Machine Learning
Supervised ML requires a set of training examples belonging to either a phenotype case or control and then can build a model that can be used on other examples for classification. Several different
methods can be used for supervised ML, such as support vector machines (SVM) (66, 72, 78, 79), logistic regression (66, 80), random forests (70), or neural networks (81, 82).
While supervised ML has been shown to be extremely effective for individual tasks, the
requirement for manual annotation, a time-consuming and costly process, and feature selection results in limited scalability (83). The conventional approach to building a set of annotated samples is to select a random pool of individuals to manually classify. Active learning approaches to ML-based phenotyping can potentially overcome the need for large annotated datasets. Chen et al. demonstrated the use of an uncertainty sampling algorithm to find and annotate only the most informative samples, those samples with the most uncertain features (83). This approach achieved similar classification results with
annotation of a fraction of samples compared to the use of a randomly annotated set. ICD-9 codes have been used as a surrogate for defining training cases and controls to limit manual input; however, this confines phenotypes to those defined by billing codes (79, 84).
Feature selection is the technique of selecting a subset of potential terms or features to use in the ML model. ML-based classification algorithms can incorporate a range of features, including billing data, clinical documentation extracted with NLP, semantic terminologies, medication exposures, and laboratory data. Features can either be chosen from a set of all potential clinical concepts or from a refined set through application of algorithms (e.g., using univariate statistical associations, ML approaches, or penalized regression models) or by domain expert curation. Potential features within the EHR are vast, and for many phenotypes, it is impractical to find an optimal subset of features using manual approaches.
Prior studies have suggested the use of unrefined feature sets including all clinical concepts to reduce the domain knowledge required for phenotyping (72). While this provides effective performance for some phenotypes, algorithms using unrefined feature sets typically have lower accuracy than those using
29
expertly curated features, unless very large training sets are used. Bejan et al. proposed statistical feature selection by ranking features based upon their association with a case or control to improve algorithm performance for phenotype identification of pneumonia (85). Yu et al. created the Automated Feature Extraction for Phenotyping (AFEP) approach for disease phenotyping by using NLP applied to
knowledge sources (such as Medscape and Wikipedia) to develop medical concepts relevant to a disease followed by concept screening, in which concepts that were either too rare, too common, or not relevant enough were excluded from the feature sets in automated ways (86). AFEP algorithms achieved accuracy comparable to the use of expert-curated feature sets for rheumatoid arthritis and coronary artery disease.
Another approach to limit the need for manually engineered features is to use deep learning. Deep learning allows for the construction of a hierarchy of progressively complex feature layers, with
transformation into more abstract representations at higher levels by training a neural network. The key aspect of deep learning is that these layers of features are not designed by domain experts, and rather they are learned from the data (87). Gulshan et al. applied supervised deep learning to more than 128,000 images of patients with diabetic retinopathy along with controls, with the development of algorithms that identified diabetic retinopathy with similar performance to ophthalmologists (AUC of 0.99) (81).
Similarly, Esteva et al. used deep neural networks for automated classification of skin lesions,
demonstrating the capability of identifying skin cancer with performance comparable to dermatologists (82).
In an early demonstration of deep learning neural networks applied to longitudinal health data, Lasko et al. applied an unsupervised feature learning approach to produce phenotypic features from uric- acid measurements for inputs in a supervised logistic regression classifier, and the model was capable of accurately distinguishing (with an AUC of 0.97) between gout and acute leukemia (88). A unique aspect of this study was managing the variable representation of time intervals, since labs are taken at irregular intervals for patients. Lab values for unobserved times were estimated using Gaussian probability