THE INFLUENCE OF BASEL III ON ISLAMIC BANK RISK
Xiaoling Ding1,Razali Haron2 and Aznan Hasan3
1 International Islamic University Malaysia, Malaysia, [email protected]
2 International Islamic University Malaysia, Malaysia, [email protected]
3 International Islamic University Malaysia, Malaysia, [email protected]
ABSTRACT
This paper investigates the impact of bank regulatory capital on Islamic bank risk using bank-level data from 29 countries covering the period from 2004 to 2020. Applying the generalized method of moments technique on dynamic panels, we discover that on average Islamic bank regulatory capital ratios exceed the level required by Basel III.
The findings provide evidence in support of the moral hazard hypothesis; that is, there is a negative relationship between capital and risk. They indicate that Islamic banks are better protected against risk when they fulfill Basel III and IFSB regulatory capital requirements. According to our findings, authorities that aim to improve the financial stability of the banking industry should reinforce their policies and oblige banks to adhere to regulatory capital requirements during crises such as Covid-19. Finally, we observe that different risk indicators have diverse correlations with regulatory capital, and that the findings are robust across a variety of estimation methodologies.
Keywords: Basel III regulatory capital, Islamic banking, Crisis and risk, System GMM.
JEL classification: C33; G21; G32; G38; P43.
Article history:
Received : July 15, 2022 Revised : October 12, 2022 Accepted : February 28, 2023 Available online : April 3, 2023 https://doi.org/10.21098/jimf.v9i1.1590
I. INTRODUCTION 1.1. Background
The response of the financial system to the Covid-19 outbreak has been the first global test of Basel III, which has been in place since the global financial crisis (GFC) (2007-2008) (Hernández de Cos, 2022). In this context, scholars, regulators and industry participants have expressed interest in whether the Basel III reforms that have been implemented thus far have achieved their intended goals. Basel III seeks to address the shortcomings of Basel I and Basel II, which were manifested clearly during the GFC of 2007–2008, and to improve regulation, supervision and risk management within the global banking sector (BCBS, 2022). However, most of the empirical research to date has been centred on the relationship between capital and risk, and uses non-risk-based traditional capital ratios rather than the risk-based Basel III regulatory capital ratios (Abbas, Ali, Yousaf & Wong, 2021;
Alsharif, 2021). The primary objective of this study is to determine how Basel III capital ratios influence Islamic bank risk.
The results of previous research, including international studies by Bitar, Pukthuanthong & Walker (2020) and Saleh and Abu Afifa (2020); regional research by Le et al. (2020) and Lileikiene et al. (2021); and national findings by Khang et al. (2022) and Ogunmola et al. (2022) offer crucial insights into the profitability or efficiency of banks. Despite the persistent risk posed by Covid-19 to the global financial system and the enduring discussion concerning Basel III reforms, empirical studies that investigate the impact of the new Basel III capital requirements on the risk of Islamic banks globally remain scarce. To fill this gap, this study evaluates the impact of Basel III capital requirements on Islamic bank risk globally. Previous research provides little evidence regarding the effect of Basel III enhanced capital ratio requirements on the risk of Islamic banks. Examples of regional studies on capital and risk include those of Ben et al. (2019), Louhichi et al. (2020), Mateev et al. (2022) and Mateev and Bachvarov (2021) in the MENA region, and and Alam et al. (2019) and Alsharif et al. (2019) in Asia and the Gulf Cooperation Council (GCC).
Rather than capital ratio and risk, some global studies have examined the impact of endorsing the new Basel III liquidity reforms (Ashraf et al., 2016; Mahmood et al., 2018) and analyzed the impact of banking regulation and supervision on efficiency and risk taking (Alam, 2013).
This research is also pertinent for various reasons. First, the traditional non- risk-based capital ratio is defined differently than the risk-based ratio (Bitar et al., 2016). The Basel Committee on Banking Supervision (BCBS) sets the risk-based capital ratio for all banks around the world; the ratio is also known as the regulatory capital ratio (Tier 1 plus Tier 2 capital to risk-weighted assets). The non-risk-based capital ratio refers to the ratio of total capital to total assets. According to Basel III requirements, the regulatory capital ratio must be a minimum of 8% (BCBS, 2022;
IFSB 23, 2021). In addition, banks are required to maintain a capital conservation buffer (CCB) of 2.5% and a countercyclical buffer (CCyB) of 1-2.5% (BCBS, 2022;
IFSB 23, 2021). Based on data availability, this study conducts an empirical analysis and focuses on investigation of the Basel III total capital ratio of 8% plus a buffer of 2.5%. Overall, the impact of the capital adequacy ratio (10.5%) on Islamic bank risk is a significant research topic, necessitating empirical investigation.
Second, the subprime crisis of 2007–2008 raised fundamental questions about bank capital quality and bank risk (Berger & Bouwman, 2013). Post-crisis reform proposals focus on how capital regulation should change to prevent future crises (BCBS, 2010a). Policymakers, regulators, industry participants and academics are interested to know if capital regulation has affected bank risk differently during the GFC and Covid-19 than in normal times, and if Basel III has changed the risk taking of Islamic banks. In line with the operations of Islamic banks, the IFSB has issued several standards and guidance notes on Islamic banking financing and risk management. For example, the most recent version (IFSB 23, 2021) was released in 2021. In the risk management standards (IFSB GN-2, 2010; IFSB1, 2005), risk profile is divided into six categories, each with its own definition and relevant requirements, such as credit risk (CR) and market risk (MR), Liquidity Risk(LR), Operational Risk(OR) or Non-Shari’ah Compliance Risk (NSCR), Equity Investment Risk(EIR), and Rate of Return Risk(RRR). In accordance with financing standards (IFSB 15, 2013; IFSB 23, 2021; IFSB2, 2005), the minimum capital requirements for Islamic financing assets are divided into nine classes, each of which takes different types of risk into account (see Appendix A). Accordingly, it is noted that commodity Murabahah, Musharakah and diminishing Musharakah, and Mudarabah are the three riskiest contracts out of the nine employed by Islamic banks. Due to the importance of the variation in these risk contracts, it is essential to conduct empirical research on how Basel III international capital standards affect Islamic bank risk.
Third, another consequence of the GFC has been the rapid expansion of Islamic banking, a banking system based on the principles of non-interest-bearing deposit accounts and profit-sharing investment contracts (henceforth PSIA) (IFSB, 2016).
PSIA is the most prevalent technique which Islamic banks can use to obtain capital, whereas conventional banks rely mostly on interest-bearing deposits (Abdel Karim
& Archer, 2013a). The BCBS has designed a framework for conventional banks, but this does not consider certain elements of Islamic banks, such as the PSIA (Ashraf et al., 2016). For this reason, the IFSB has established prudential rules, which include prescriptions for adapting conventional capital requirements for Islamic financial institutions (IFSB 23, 2021). It is noted that the rules for PSIA, Sukuk, Musharakah, Salam, Istisna’a, and Qard-al-Hassan, for instance, are quite distinct (Ashraf et al., 2016) (see Appendix B). To develop better knowledge of how Basel III international standards effect Islamic banks and to address gaps in the available evidence, regulatory capital and risk based on these contracts need to be examined further (Bitar, Kabir Hassan, Pukthuanthong, & Walker (2018).
1.2. Objective
The main objective of this paper is to investigate how the regulatory capital ratio affects the risk of Islamic banks. It contributes to the literature in several aspects.
First, it arrives at results based on the updated data set from 2004 to 2020, and compares this to previous studies that employed data during Basel II, such as those of Abbas et al. (2021), Bitar et al. (2016), Bitar et al. (2018), Lee & Hsieh (2013), Mateev et al. (2022) and Mateev & Bachvarov (2021). Second, in a comparision of regional studies (Ashraf et al., 2016; Bitar et al., 2017; Mateev & Bachvarov, 2021)
we examine how the BCBS and IFSB regulations impact the risk of Islamic banks globally in terms of the Basel III risk-based capital ratio. This will contribute greater understanding of the global impact of Basel III on Islamic banking. Third, our research is unique because we make a comparison and investigate the effect that the Basel accords have on the risk of Islamic banks using six different risk proxies, thus extending the studies of Bitar et al. (2018), Harkati et al. (2020c), Mateev et al. (2022), Mateev et al. (2022) and Mateev and Bachvarov (2021). To assess the persistence of risk, dynamic panel methods are used to examine the panel data. This enables us to conduct reliable testing; identify the risk proxy that is appropriate for Islamic banks worldwide; and provide robust results. In brief, the findings of this study will enhance regulators’ and the banking industry’s understanding of the implications of Basel III on Islamic banks in various jurisdictions.
The paper is divided into five sections. The first section is the introduction, while the second section discusses the relevant literature. The third section explains the data sample and model, the fourth section assesses the findings, and the fifth section presents the conclusion.
II. LITERATURE REVIEW AND HYPOTHESIS DEVELOPMENT
Abbas and Younas (2021), Bitar et al. (2016), Lee & Hsieh (2013) and Mateev et al.
(2022) contend that the regulatory and moral hazard paradigms can be utilized to provide an explanation of the relationship between capital and risk. The regulatory theory asserts that there is a positive association between capital and risk, whereas the moral hazard assumption proposes that capital works to reduce banks’ exposure to risk.
Several studies have documented a positive relationship between bank regulatory capital and bank risk. Bitar et al. (2016) and Bitar et al. (2018) investigated the relationship between regulatory capital and credit risk using loan loss reserve as a proxy for bank risk in the Middle East and North Africa (MENA) and the Organisation for Economic Co-operation and Development (OECD) regions between 1999 and 2013, finding the relationship to be positive. Abbas and Ali (2020), Abbas and Bashir (2021) and Saif-Alyousfi and Saha (2021) used the GMM technique and adopted data from the GCC region, the United States and Japan.
They employed non-performing loans and loan loss provision as their measures of credit risk and obtained similar results.
Even when using different risk proxies and samples from international markets, the positive capital – risk relations was further reaffirmed by Abbas and Ahmad (2021) and Ben Jedidia (2020); more specifically, they discovered a positive correlation between liquidity risk and bank capital. In addition, Akhtar et al. (2021) conclude that there is a positive relationship between bank insolvency risk and capital ratio in Pakistan. Studies by Abbas et al. (2021) and Abbas and Bashir (2021) with bank samples of 942 and 507 respectively. and covering the periods of 2002-2018 and 2001-2020, also reached a similar conclusion concerning the link between prudential capital and financial institution overall risk for the United States and Japan.
In accordance with Shariah instructions on issues involving finance and economy, Islamic banks apply their own distinct business model and set of guiding
principles (Jawadi, Cheffou & Jawadi, 2016; Jawadi, Cheffou, Jawadi & Louhichi, 2016). According to the fundamental tenet, by applying non-interest-based profit and loss sharing (PLS) principles to investment account holders (IAHs), Islamic banks could theoretically boost their profit margins. However, since IAHs would be liable for losses, doing so would reduce the value of deposits. Consequently, the associated risk is increased because the managers and owners might indeed continue to seek additional IAHs and engage in increased leverage. The empirical findings that support these insights are provided by Abudu-Rahman (2019), Ben Jedidia (2020), Isnurhadi et al. (2021), Mateev et al. (2022) and Wahab et al. (2017), who employed different samples, methodologies and risk indicators.
According to Bitar et al. (2016) and Lee and Hsieh (2013), regulatory costs, the unforeseen consequences of minimum capital requirements, managers’ risk aversion, or avoiding bankruptcy costs could all lead to a positive correlation between capital and risk. A positive relationship between capital and risk is also referred to as the “regulatory hypothesis” (Mateev et al., 2022 ; Bitar et al., 2018), which means that regulators encourage banks to enhance their capital in proportion to the amount of risk they take. Therefore, we propose the following hypothesis:
H1. The capital ratio is positively related to Islamic bank risk.
However, recent research also indicates that capital and risk are negatively related. Using non-performing loans to gross loans (NPLGF) as a proxy for credit risk, Mutarindwa et al. (2020) discovered a negative relationship between capital and bank risk using a regional dataset of 606 African banks and the fixed-effect panel estimator. Using GMM, Asharaf, Arshad & Hu (2016) obtained the same results for a sample of 25 banks in Pakistan, while Abbas and Younas (2021) achieved the same outcomes for a data set of 923 banks in the United States. Lee and Chih (2013) also report a negative relationship for large banks in China.
Considering Islamic banks at a more practical level, it becomes clear that they are unable to continuously channel losses to IAHs. This is because in the long run investors will stop investing in them. In accordance with Bitar et al. (2018), IAHs might decide to withdraw their funds, which would create liquidity and solvency issues. Maintaining profit smoothing reserves is one way for Islamic banks to address the issue. Because of this, Islamic financial institutions may choose to keep greater capital ratios than their rivals to safeguard themselves from any possible future instability issues that may arise. Therefore, according to Demirguc-Kunt et al. (2013), a greater level of capital quality compels banks to cover losses with resources beyond themselves, rather than relying on funds provided by the public sector.
The moral hazard hypothesis may explain why capital has a negative impact on bank risk. Because depositors are protected by deposit insurance, in general unregulated financial institutions have a propensity to take excessive risks in the interest of maximizing shareholder value, even when doing so comes at the expense of their customers (Bitar et al., 2016). Moreover, undercapitalized banks expose themselves to a significantly higher risk of abusing the various existing flat deposit insurance programs ( Lee & Hsieh, 2013). Depositors, on the other
hand, are no longer actively involved in the process of monitoring bank financing because their money is safe (Bitar et al., 2016). The moral hazard hypothesis is supported by the literature (Alsharif, 2021; Ghenimi et al., 2021; Harkati et al., 2020c; Isnurhadi et al., 2021; Mateev et al., 2022; Misman & Bhatti, 2020), which indicates that capital has a negative effect on bank risk in the context of Islamic banks. The hypothesis formulated is therefore:
H2. The capital ratio is negatively related to Islamic bank risk.
It is important to highlight that notable crises, such as the global financial crisis and Covid-19, have had an impact on the activity and risk of banks. In line with Abbas and Ali (2020), Ben Jedidia (2020) and Ghenimi et al. (2021), the following hypothesis is posited:
H3. The impact of the regulatory capital ratio on the risk of Islamic banks differs between crisis and normal times.
Finally, the Basel III agreement has the potential to negatively affect Islamic financial institutions because of their lack of experience and effectiveness in liquidity management, as well as the fact that the Shari’ah principle places restrictions on the use of loans and collateral devices by Islamic financial institutions, which limits their flexibility. With consideration of previous results in the literature (Hamadi et al., 2016; Jutasompakorn et al., 2021; Lim & Yong, 2017), there will be a different impact of regulatory capital on bank risk during the Basel II and Basel III eras. As a result, the following hypothesis is proposed to account for this possibility:
H4. The impact of the regulatory capital ratio on the risk of Islamic banks will differ between the pre-Basel III and post-Basel III stages.
III. METHODOLOGY 3.1. Data
The Fitch Connect database served as our main data source (Harkati et al., 2020a, 2020b, 2021; Ibrahim, 2020). The World Bank World Development Indicators World Bank provide macroeconomic information such as on domestic credit to private sector (DCPS) and the GDP growth rate. This study employed a panel dataset comprising 105 Islamic banks from 29 different nations covering the period 2004 to 2020. If a bank did not have three consecutive years of data, it was removed from the sample (Bitar et al., 2018; Lee & Hsieh, 2013). The Basel III variable data must also be presented. In addition, we only included banks that were in operation through the 2019–2020 financial year.
3.2. Variable Construction
Dependent variables (risk). The study considered six risk measures of Islamic banks for the purposes of robustness. First, three ratios were used to measure credit risk, which was intended to measure the financing quality of Islamic banks: that is,
the financing loss reserves to gross financing ratio (FLRGF) (Bitar et al., 2016; Bitar et al., 2018; Mateev et al., 2022); the non-performing financing to gross financing ratio (NPFGF) (Abbas & Bashir, 2021; Abbas & Younas, 2021; Mateev et al., 2022;
Mutarindwa et al., 2020); and the financing loss provision to gross financing ratio (FLPGF) (Alsharif, 2021; Isnurhadi et al., 2021; Saif-Alyousfi & Saha, 2021), with higher values indicating poorer financing quality. Second, we used bank liquidity risk, measured as the ratio of liquid assets to total assets (LATA) (Abbas, Ali, &
Ahmad, 2021; Abudu-Rahman, 2019; Ghenimi et al., 2021; Siddika & Haron, 2020).
This ratio indicates the liquidity available to meet expected and unexpected cash demands, with higher values indicating lower liquidity risk. Third, we utilized a common measure of insolvency risk, the Z-score. This captures the insolvency of a bank by combining the accounting measures of leverage, profitability and volatility of return (Akhtar et al., 2021; Mateev et al., 2022). A bank with a high Z-score is more stable. When the indicator of insolvency risk is high, there is less chance of default. Finally, the ratio of risk-weighted assets to total assets was used to determine total risk (Abbas, Masood, et al., 2021; Abbas & Bashir, 2021; Jacques
& Nigro, 1997).
Capital ratio. The main independent variable in the study is the regulatory capital ratio. Based on the data availability, we measured the total capital ratio using risk-weighted assets, in accordance with the Basel accords (hereinafter referred to as regulatory capital) (Akhtar et al., 2021; Bitar et al., 2020; Misman &
Bhatti, 2020). Under the Basel III accord, this ratio must be at least 10.5%.
Control variables. We controlled for certain bank-, industry-, and macroeconomic-specific factors. The bank-specific factors included (i) the natural log of total assets to capture bank size - previous research shows that banks become more stable as they grow (Mateev, et al., 2022); (ii) the market share of Islamic banks (MS_IB) (Aslam & Haron, 2021; Mirzaei, 2019; Nomran & Haron, 2021); (iii) the growth of assets ratio (GTASSETS) (Bitar, Pukthuanthong, Walker, 2018; Lee et al., 2014); (iv) the net financing to total assets ratio (NFINTA) (Bitar et al., 2018; Lee & Hsieh, 2013); and (v) the deposit to total assets ratio (DEPASSETS) (Mateev et al., 2022).
The following were the industry-specific variables: (i) the industry share of Islamic banks was used to define their market power in each country studied;
(IS_IB) (Nosheen & Rashid, 2021); (ii) the Herfindahl Hirschman Index (HHI), a metric used to manage the variation in market concentration effects on financial stability between nations (Nosheen & Rashid, 2021); and (iii) domestic credit to private sector (DCPS), with a greater DCPS indicating a more competitive financial environment, meaning DCPS should be have a positive effect on risk (Lee & Hsieh, 2013). Finally, the macroeconomic variables were GDP growth (GDPG) and inflation (INFLA). GDPG was expected to lower risk, while the effect of INFLA on risk is a priori ambiguous (Lee & Hsieh, 2013). In countries with a high rate of inflation, banks may charge higher fees, while simultaneously facing a shrinking number of loans.
Dummy variables. We included dummy variables to control for the effects of the 2008-2009 global financial crisis, the Covid-19 pandemic, and the Basel III Accord phase-in arrangements. The financial crisis dummy took the value of 1 for 2008-2009 and 0 otherwise, while the Covid-19 dummy equalled 1 for 2020 and 0
otherwise (Abbas et al., 2021; Ashraf et al., 2016; Cahyono et al., 2021; Grassa et al., 2022; Mateev & Bachvarov, 2021; Nurdany et al., 2021). According to the Basel III Accord, the first year of phase-in arrangements for Basel III capital requirement implementation was 2013 (BCBS, 2022). Therefore, the Basel III dummy was equal 1 for years 2013-2020 and 0 otherwise.
3.3. Model Specification
In accordance with the previous literature, we specified the following baseline model:
where the dependent variable in the equation represents the six risk indicators noted above. The primary explanatory variable is regulatory capital (CAP). Depending in the equation, a set of controlled variables are included: the bank-specific control variables are bank SIZE, MS_IB, GTASSETS, NFINTA and DEPASSETS; while the macroeconomic-level control variables are IS_IB in each country, HHIA, DCPS, GDPG and INFLA. Two dummies are also incorporated to control for financial crisis and the Basel III period. We further investigated how capital affects bank risk during crisis and normal times by introducing interaction terms for these periods with the capital variable. In addition, further analysis was conducted to compare the impact of capital on Islamic bank risk during the pre- Basel III and post-Basel III eras.
3.4. Estimation Method
To estimate the model, we applied the robust two-step dynamic panel data and system GMM estimation technique (Arellano & Bover, 1995; Blundell & Bond, 1998, 2000). This estimation method was employed for several reasons. First, it addresses potential endogeneity, heteroskedasticity and autocorrelation issues across individual firms (Doytch & Uctum, 2011). Second, in this study the GMM estimator was used to estimate the impact of capital and bank risk, as OLS and fixed effects are incapable of resolving issues such as risk persistence (Saif-Alyousfi &
Saha, 2021). Third, it is widely noted that the dynamic GMM technique effectively manages the correlation between the regressors and the residuals (Nosheen &
Rashid, 2021). Following the above-mentioned studies, the two-step GMM system along with Windmeijer’s (2005) adjusted standard error were employed in the investigation.
IV. RESULTS AND ANALYSIS 4.1. Validity of the Instruments
In determining whether the instruments were justified, following Lee and Hsieh (2013) and Nosheen and Rashid (2021) we utilized the specification test proposed by Blundell and Bond (2000) and the J-statistic of Hansen (Hansen, 1982) to test the reliability of the instruments. The instrument variables are valid if the null (1)
hypothesis of the Hansen test for the validity of over-identifying restrictions cannot be rejected. In contrast, the instrument variables are inappropriate if the null hypothesis is rejected. Additionally, confirmation that that the model is correctly specified is shown by the residuals’ lack of second-order serial correlation. The AR (2) test was used to determine whether the residuals contained second-order serial correlation (Arellano & Bond, 1991). The results section gives details of the diagnostic tests.
4.2. Descriptive Statistics and Correlations
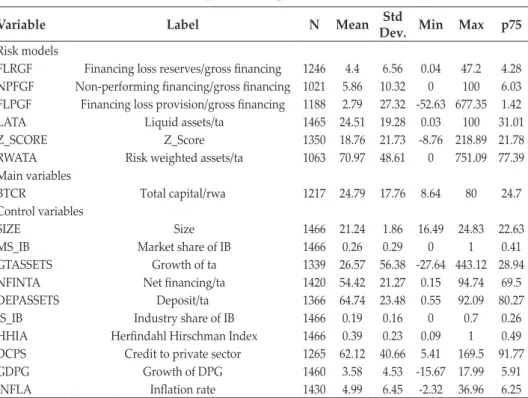
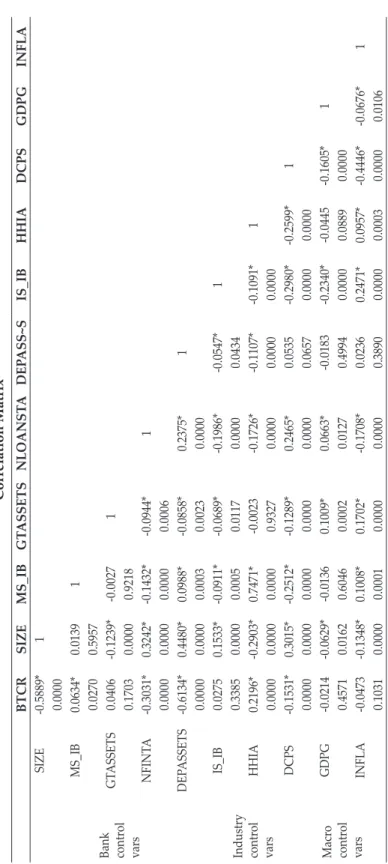
Table 1 provides descriptive statistics of all the variables (bank-specific, industry development and macroeconomic). The average level of the main independent variable (capital) is 24.71 percent. Its lowest value is 8.64 percent, which is 0.64 percent higher than the Basel III total capital ratio minimum requirement. In terms of the dependent variable (risk), the average mean of the risk-weighted assets to total assets ratio is 70.97 percent, while the financing loss provision/gross financing ratio has a mean of 2.79 percent. In comparison to the other variables, the total number of observations for the Basel III ones is relatively small compared to other variables, due most likely to the non-reporting of Basel III total capital ratios by many Islamic banks. The matrix of the Pearson correlation coefficients can be seen in Table 2. In most cases, the correlation coefficients are fairly low (less than 0.3), which indicates that multicollinearity should not be a major issue.
Table 1.
Summary of Descriptive Statistics
Variable Label N Mean Std Dev. Min Max p75
Risk models
FLRGF Financing loss reserves/gross financing 1246 4.4 6.56 0.04 47.2 4.28 NPFGF Non-performing financing/gross financing 1021 5.86 10.32 0 100 6.03 FLPGF Financing loss provision/gross financing 1188 2.79 27.32 -52.63 677.35 1.42
LATA Liquid assets/ta 1465 24.51 19.28 0.03 100 31.01
Z_SCORE Z_Score 1350 18.76 21.73 -8.76 218.89 21.78
RWATA Risk weighted assets/ta 1063 70.97 48.61 0 751.09 77.39
Main variables
BTCR Total capital/rwa 1217 24.79 17.76 8.64 80 24.7
Control variables
SIZE Size 1466 21.24 1.86 16.49 24.83 22.63
MS_IB Market share of IB 1466 0.26 0.29 0 1 0.41
GTASSETS Growth of ta 1339 26.57 56.38 -27.64 443.12 28.94
NFINTA Net financing/ta 1420 54.42 21.27 0.15 94.74 69.5
DEPASSETS Deposit/ta 1366 64.74 23.48 0.55 92.09 80.27
IS_IB Industry share of IB 1466 0.19 0.16 0 0.7 0.26
HHIA Herfindahl Hirschman Index 1466 0.39 0.23 0.09 1 0.49
DCPS Credit to private sector 1265 62.12 40.66 5.41 169.5 91.77
GDPG Growth of DPG 1460 3.58 4.53 -15.67 17.99 5.91
INFLA Inflation rate 1430 4.99 6.45 -2.32 36.96 6.25
Note: data is winsorized at 1% and 99% percentiles to control for outliers
Table 2. Correlation Matrix BTCRSIZEMS_IBGTASSETSNLOANSTADEPASS~SIS_IBHHIADCPSGDPGINFLA
Bank control vars
SIZE-0.5889*1 0.0000 MS_IB0.0634*0.01391 0.02700.5957 GTASSETS0.0406-0.1239*-0.00271 0.17030.00000.9218 NFINTA-0.3031*0.3242*-0.1432*-0.0944*1 0.00000.00000.00000.0006 DEPASSETS-0.6134*0.4480*0.0988*-0.0858*0.2375*1 0.00000.00000.00030.00230.0000
Industry control vars
IS_IB0.02750.1533*-0.0911*-0.0689*-0.1986*-0.0547*1 0.33850.00000.00050.01170.00000.0434 HHIA0.2196*-0.2903*0.7471*-0.0023-0.1726*-0.1107*-0.1091*1 0.00000.00000.00000.93270.00000.00000.0000 DCPS-0.1531*0.3015*-0.2512*-0.1289*0.2465*0.0535-0.2980*-0.2599*1
Macro control vars
0.00000.00000.00000.00000.00000.06570.00000.0000 GDPG-0.0214-0.0629*-0.01360.1009*0.0663*-0.0183-0.2340*-0.0445-0.1605*1 0.45710.01620.60460.00020.01270.49940.00000.08890.0000 INFLA-0.0473-0.1348*0.1008*0.1702*-0.1708*0.02360.2471*0.0957*-0.4446*-0.0676*1 0.10310.00000.00010.00000.00000.38900.00000.00030.00000.0106
4.3. Regression Results and Discussion
4.3.1. Impact of Regulatory Capital on the Risk of Islamic Banks
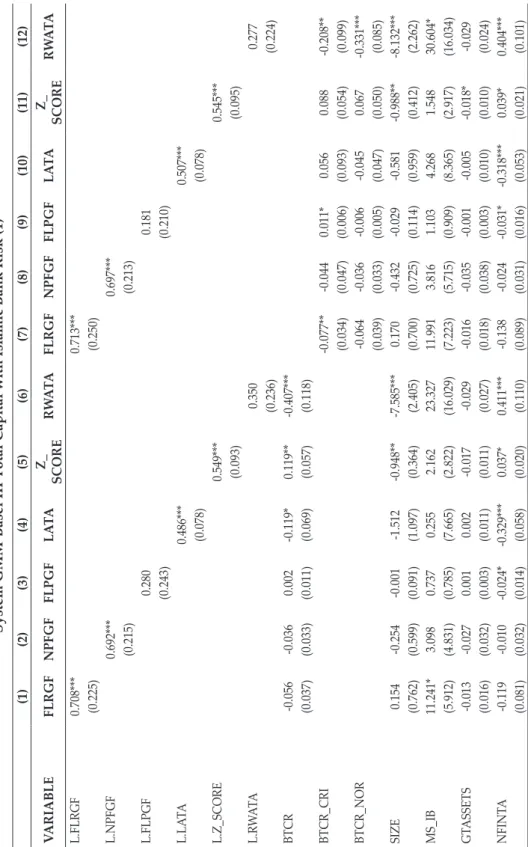
Both the regulatory and the moral hazard hypotheses serve as the basis for our testable hypotheses. We first analysed the impact of the regulatory capital ratio on the risk of Islamic banks using six risk measures and incorporated financial crisis and Basel III dummies separately. To determine whether the Basel III phase-in arrangements and financial crises had a moderating effect on this relationship, we then introduced interaction terms into the model, namely the interactions between capital ratio and crisis and Basel II dummies. Tables 3-4 present the results of the regression analysis, and the findings are discussed below.
When we used the ratio of risk-weighted assets to total assets (total risk), the liquid assets to total assets ratio (liquidity risk), and the Z-score (insolvency risk or stability) as the proxies for the full sample and research period, we found statistically significant relationships between capital and Islamic bank total risk, conforming to the moral hazard hypothesis. This finding is in line with those of Abbas and Ali (2020), Asharaf et al (2016), Jacques and Nigro, (1997) and Siddika and Haron (2020), but contradicts those of Abbas, Masood, Ali, Rizwan (2021), Abbas and Bashir (2021), and Wahab et al. (2017). We have reliable instruments and no serial correlation since the Hansen and serial-correlation tests do not rule out the null hypothesis of correct specification.
When we observed the bank-specific variables, we made the following findings. Using the proxies Z_SCORE (insolvency risk) and RWATA (total risk), the relationship between bank size and bank risk is negative. This negative effect of size on bank risk is in line with Abbas and Bashir (2021), Harkati et al. (2020c), and Siddika and Haron (2020). The result is also consistent with Abbas and Younas (2021), Mateev, Moudud-Ul-Huq, Sahyouni (2022) and Misman and Bhatti (2020).
Second, in terms of NFINTA, a higher amount of net financing in Islamic banks to total assets significantly reduces bank liquidity and credit risk, but increases total risk. This evidence is consistent with Siddika and Haron (2020), but differs from Bitar et al. (2016), Bitar et al. (2018), Harkati et al. (2020c), and Mateev et al. (2022).
Finally, DEPTASSETS significantly increases bank risk, as measured by the ratio of financing loss provisions to gross financing, and reduces total risk. In addition, no correlation with the other risk factors is detected. Our findings are consistent with Abbas and Younas (2021), Asharaf et al (2016) and Mateev et al. (2022).
Examining the effect of the macroeconomic variables, we found that GDP growth had a negative relationship with financing loss reserves and non-performing financing to gross financing, and a positive impact on total risk. In contrast, the other risk indicators (FLPGF, LATA and Z SCORE) do not seem to be affected by GDP growth. This supports the previous studies of Mateev et al. (2022) and Siddika and Haron (2020), but contradicts those of Abbas and Bashir (2021) and Akhtar et al. (2021). In our investigation, inflation has no statistically significant influence on bank risk (Abbas & Bashir, 2021; Akhtar et al., 2021; Mateev et al., 2022). However, Abbas and Bashir (2021) found a significantly positive impact of inflation on risk.
When examining the impact of the industry-specific variables, we discovered a positive and significant relationship between HHI and bank liquidity risk, which is consistent with Mateev et al. (2022). Furthermore, we found that DCPS had a positive and significant impact on bank risk (FLPGF), but not significant for other
proxies. Similar conclusions are also made by Lee and Hsieh (2013) and Mateev et al. (2022), but differ from those of Siddika and Haron (2020).
4.3.2. Impact of the Financial Crisis on the Relationship between Regulatory Capital and Islamic Bank Risk
To further explore the influence of capital on bank risk during the crisis periods (GFC and Covid-19) versus normal times, we extended the study of Saif-Alyousfi and Saha (2021) to include the two crisis dummies. The findings are shown in Table 3 and suggest that the financial crisis influenced bank risk, in line with Saif- Alyousfi and Saha (2021). In addition, using FLPGF and LATA as the proxies for risk, the results differ between normal and crisis times. However, we found no significant difference between the two periods when risk was measured by FLRGF, NPFGF, Z-SCORE and RWATA. The results also indicate that during times of financial crisis, banks face higher financing losses, but these decrease during normal times. In addition, liquidity risk increased during the financial crisis, but fell during normal times. Overall, the third hypothesis (H3), that the financial crisis (2008-2008) has a significant impact on the relationship between the Basel capital ratio and Islamic bank risk, is supported.
In brief, our findings show that financial crises, i.e., in general, have an impact on bank risk, and that the impact of capital on bank risk during times of crisis and normal times is different depending on the risk measures.
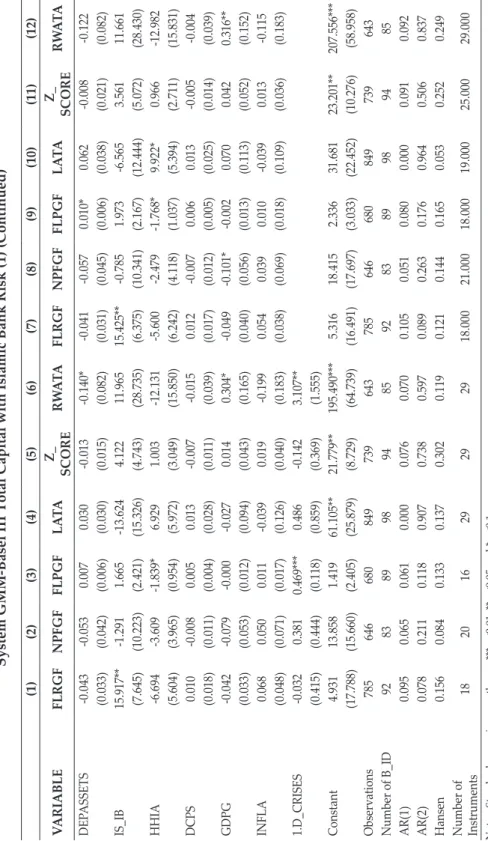
Table 3. System GMM-Basel III Total Capital with Islamic Bank Risk (1) (1)(2)(3)(4)(5)(6)(7)(8)(9)(10)(11)(12) VARIABLEFLRGFNPFGFFLPGFLATAZ_ SCORERWATAFLRGFNPFGFFLPGFLATAZ_ SCORERWATA L.FLRGF0.708***0.713*** (0.225)(0.250) L.NPFGF0.692***0.697*** (0.215)(0.213) L.FLPGF0.2800.181 (0.243)(0.210) L.LATA0.486***0.507*** (0.078)(0.078) L.Z_SCORE0.549***0.545*** (0.093)(0.095) L.RWATA0.3500.277 (0.236)(0.224) BTCR-0.056-0.0360.002-0.119*0.119**-0.407*** (0.037)(0.033)(0.011)(0.069)(0.057)(0.118) BTCR_CRI-0.077**-0.0440.011*0.0560.088-0.208** (0.034)(0.047)(0.006)(0.093)(0.054)(0.099) BTCR_NOR-0.064-0.036-0.006-0.0450.067-0.331*** (0.039)(0.033)(0.005)(0.047)(0.050)(0.085) SIZE0.154-0.254-0.001-1.512-0.948**-7.585***0.170-0.432-0.029-0.581-0.988**-8.132*** (0.762)(0.599)(0.091)(1.097)(0.364)(2.405)(0.700)(0.725)(0.114)(0.959)(0.412)(2.262) MS_IB11.241*3.0980.7370.2552.16223.32711.9913.8161.1034.2681.54830.604* (5.912)(4.831)(0.785)(7.665)(2.822)(16.029)(7.223)(5.715)(0.909)(8.365)(2.917)(16.034) GTASSETS-0.013-0.0270.0010.002-0.017-0.029-0.016-0.035-0.001-0.005-0.018*-0.029 (0.016)(0.032)(0.003)(0.011)(0.011)(0.027)(0.018)(0.038)(0.003)(0.010)(0.010)(0.024) NFINTA-0.119-0.010-0.024*-0.329***0.037*0.411***-0.138-0.024-0.031*-0.318***0.039*0.404*** (0.081)(0.032)(0.014)(0.058)(0.020)(0.110)(0.089)(0.031)(0.016)(0.053)(0.021)(0.101)
Table 3. System GMM-Basel III Total Capital with Islamic Bank Risk (1) (Continued) (1)(2)(3)(4)(5)(6)(7)(8)(9)(10)(11)(12) VARIABLEFLRGFNPFGFFLPGFLATAZ_ SCORERWATAFLRGFNPFGFFLPGFLATAZ_ SCORERWATA DEPASSETS-0.043-0.0530.0070.030-0.013-0.140*-0.041-0.0570.010*0.062-0.008-0.122 (0.033)(0.042)(0.006)(0.030)(0.015)(0.082)(0.031)(0.045)(0.006)(0.038)(0.021)(0.082) IS_IB15.917**-1.2911.665-13.6244.12211.96515.425**-0.7851.973-6.5653.56111.661 (7.645)(10.223)(2.421)(15.326)(4.743)(28.735)(6.375)(10.341)(2.167)(12.444)(5.072)(28.430) HHIA-6.694-3.609-1.839*6.9291.003-12.131-5.600-2.479-1.768*9.922*0.966-12.982 (5.604)(3.965)(0.954)(5.972)(3.049)(15.850)(6.242)(4.118)(1.037)(5.394)(2.711)(15.831) DCPS0.010-0.0080.0050.013-0.007-0.0150.012-0.0070.0060.013-0.005-0.004 (0.018)(0.011)(0.004)(0.028)(0.011)(0.039)(0.017)(0.012)(0.005)(0.025)(0.014)(0.039) GDPG-0.042-0.079-0.000-0.0270.0140.304*-0.049-0.101*-0.0020.0700.0420.316** (0.033)(0.053)(0.012)(0.094)(0.043)(0.165)(0.040)(0.056)(0.013)(0.113)(0.052)(0.152) INFLA0.0680.0500.011-0.0390.019-0.1990.0540.0390.010-0.0390.013-0.115 (0.048)(0.071)(0.017)(0.126)(0.040)(0.183)(0.038)(0.069)(0.018)(0.109)(0.036)(0.183) 1.D_CRISES-0.0320.3810.469***0.486-0.1423.107** (0.415)(0.444)(0.118)(0.859)(0.369)(1.555) Constant4.93113.8581.41961.105**21.779**195.490***5.31618.4152.33631.68123.201**207.556*** (17.788)(15.660)(2.405)(25.879)(8.729)(64.739)(16.491)(17.697)(3.033)(22.452)(10.276)(58.958) Observations785646680849739643785646680849739643 Number of B_ID928389989485928389989485 AR(1)0.0950.0650.0610.0000.0760.0700.1050.0510.0800.0000.0910.092 AR(2)0.0780.2110.1180.9070.7380.5970.0890.2630.1760.9640.5060.837 Hansen0.1560.0840.1330.1370.3020.1190.1210.1440.1650.0530.2520.249 Number of Instruments18201629292918.00021.00018.00019.00025.00029.000 Notes: Standard errors in parentheses. *** p<0.01, ** p<0.05 and * p<0.1
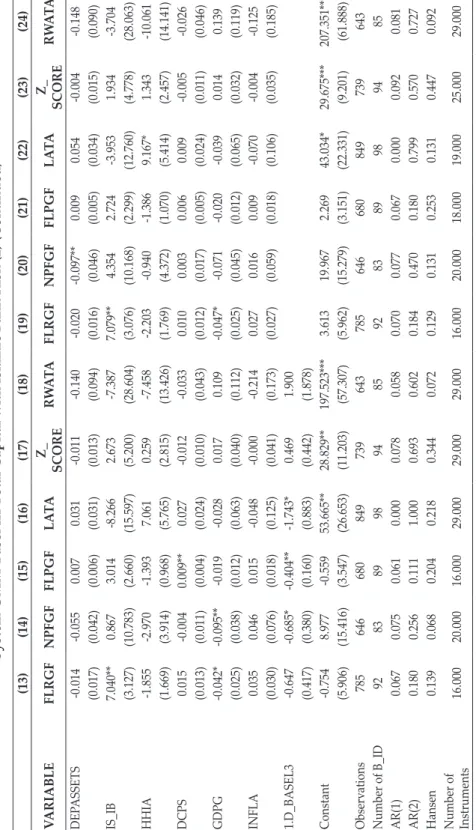
4.3.3. Impact of Basel III on the Relationship between Regulatory Capital and Islamic Bank Risk
After the Basel III capital requirement phased-in implementation in 2013, following Jutasompakorn et al. (2021) we controlled for the Basel III period with a dummy variable (D_Basel III), with a value of 1 for 2013-2020 and 0 otherwise. To determine if our results are the same before and after Basel III, we generated two distinct control variables representing the pre-Basel III and post-Basel III periods.
We then interacted both with the capital ratio. The results are shown in Table 4.
The implementation of Basel III influences banks’ NPFGF, FLRGF and RWATA negatively and significantly. Credit risk using financing loss provision also shows a reduction. In a similar vein, bank stability increases significantly. Therefore, H4, that Basel III has a significant impact on the relationship between regulatory capital and Islamic bank risk, is supported.
In conclusion, the findings of the empirical research based on the overall sample indicate that increasing the regulatory capital of Islamic banks will result in a decrease in their total risk (RWATA), liquidity risk (LATA) and RWATA, and an increase in insolvency risk (bank stability) (Z-SCORE).
(13)(14)(15)(16)(17)(18)(19)(20)(21)(22)(23)(24) VARIABLEFLRGFNPFGFFLPGFLATAZ_ SCORERWATAFLRGFNPFGFFLPGFLATAZ_ SCORERWATA L.FLRGF0.704***0.716*** (0.179)(0.189) L.NPFGF0.656***0.657*** (0.208)(0.197) L.FLPGF0.2210.176 (0.210)(0.191) L.LATA0.448***0.423*** (0.078)(0.080) L.Z_SCORE0.549***0.536*** (0.091)(0.094) L.RWATA0.416*0.350 (0.235)(0.229) BTCR-0.034-0.0340.002-0.101*0.114**-0.408*** (0.027)(0.033)(0.011)(0.058)(0.056)(0.125) BTCR_PREBASEL3-0.032**-0.120**0.0010.0120.068**-0.435*** (0.015)(0.056)(0.004)(0.054)(0.033)(0.144) BTCR_POSTBASEL3-0.045*-0.152***-0.005-0.0520.082**-0.350*** (0.024)(0.053)(0.006)(0.060)(0.039)(0.082) SIZE0.271-0.0300.096-1.155-1.242***-7.606***0.097-0.348-0.014-0.910-1.297***-7.888*** (0.245)(0.594)(0.138)(1.135)(0.468)(2.114)(0.251)(0.661)(0.124)(0.976)(0.381)(2.325) MS_IB2.2682.2570.4051.2362.85222.9063.6116.9120.4834.3012.26129.596* (1.835)(4.991)(0.749)(7.814)(2.987)(14.995)(2.198)(7.425)(0.926)(8.885)(2.412)(17.065) GTASSETS-0.017-0.0270.001-0.000-0.019-0.021-0.017-0.034-0.000-0.006-0.017*-0.024 (0.015)(0.031)(0.003)(0.011)(0.012)(0.027)(0.016)(0.035)(0.003)(0.010)(0.009)(0.027) NFINTA-0.064-0.010-0.028**-0.345***0.0340.356***-0.071-0.044-0.034**-0.344***0.038*0.371*** (0.042)(0.032)(0.014)(0.059)(0.021)(0.118)(0.044)(0.028)(0.015)(0.052)(0.019)(0.105) Table 4. System GMM-Basel III Total Capital with Islamic Bank Risk (2)
Table 4. System GMM-Basel III Total Capital with Islamic Bank Risk (2) (Continued) (13)(14)(15)(16)(17)(18)(19)(20)(21)(22)(23)(24) VARIABLEFLRGFNPFGFFLPGFLATAZ_ SCORERWATAFLRGFNPFGFFLPGFLATAZ_ SCORERWATA DEPASSETS-0.014-0.0550.0070.031-0.011-0.140-0.020-0.097**0.0090.054-0.004-0.148 (0.017)(0.042)(0.006)(0.031)(0.013)(0.094)(0.016)(0.046)(0.005)(0.034)(0.015)(0.090) IS_IB7.040**0.8673.014-8.2662.673-7.3877.079**4.3542.724-3.9531.934-3.704 (3.127)(10.783)(2.660)(15.597)(5.200)(28.604)(3.076)(10.168)(2.299)(12.760)(4.778)(28.063) HHIA-1.855-2.970-1.3937.0610.259-7.458-2.203-0.940-1.3869.167*1.343-10.061 (1.669)(3.914)(0.968)(5.765)(2.815)(13.426)(1.769)(4.372)(1.070)(5.414)(2.457)(14.141) DCPS0.015-0.0040.009**0.027-0.012-0.0330.0100.0030.0060.009-0.005-0.026 (0.013)(0.011)(0.004)(0.024)(0.010)(0.043)(0.012)(0.017)(0.005)(0.024)(0.011)(0.046) GDPG-0.042*-0.095**-0.019-0.0280.0170.109-0.047*-0.071-0.020-0.0390.0140.139 (0.025)(0.038)(0.012)(0.063)(0.040)(0.112)(0.025)(0.045)(0.012)(0.065)(0.032)(0.119) INFLA0.0350.0460.015-0.048-0.000-0.2140.0270.0160.009-0.070-0.004-0.125 (0.030)(0.076)(0.018)(0.125)(0.041)(0.173)(0.027)(0.059)(0.018)(0.106)(0.035)(0.185) 1.D_BASEL3-0.647-0.685*-0.404**-1.743*0.4691.900 (0.417)(0.380)(0.160)(0.883)(0.442)(1.878) Constant-0.7548.977-0.55953.665**28.829**197.523***3.61319.9672.26943.034*29.675***207.351*** (5.906)(15.416)(3.547)(26.653)(11.203)(57.307)(5.962)(15.279)(3.151)(22.331)(9.201)(61.888) Observations785646680849739643785646680849739643 Number of B_ID928389989485928389989485 AR(1)0.0670.0750.0610.0000.0780.0580.0700.0770.0670.0000.0920.081 AR(2)0.1800.2560.1111.0000.6930.6020.1840.4700.1800.7990.5700.727 Hansen0.1390.0680.2040.2180.3440.0720.1290.1310.2530.1310.4470.092 Number of Instruments16.00020.00016.00029.00029.00029.00016.00020.00018.00019.00025.00029.000 Standard errors in parentheses. *** p<0.01, ** p<0.05 and * p<0.1
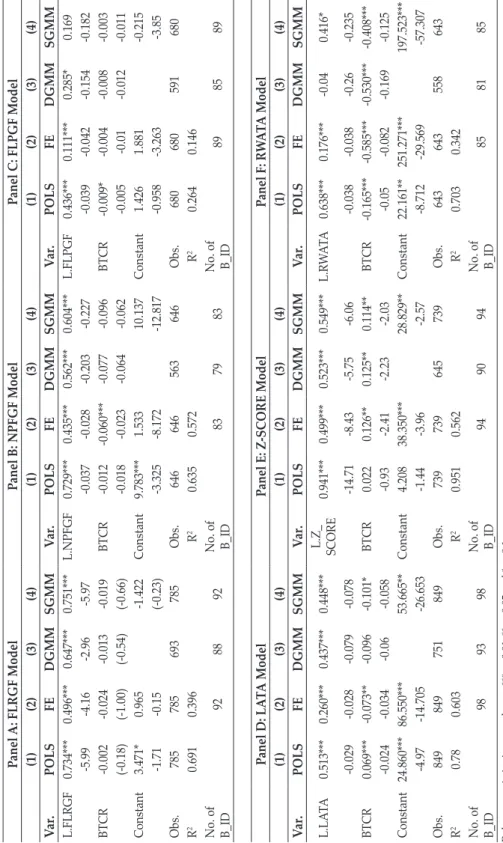
4.4. Robustness Test
4.4.1. Other Estimation Techniques: POLS, FEM, DGMM and SGMM
To check for the robustness of the results, we employed alternative estimation methods: pooled OLS, FE or RE (Saif-Alyousfi & Saha, 2021) and the two-step system GMM estimator (Windmeijer, 2005) with corrected standard error (Saif- Alyousfi et al., 2020; Saif-Alyousfi et al., 2020). The results are presented in Table 5.
As demonstrated, two main conclusions can be drawn from the results. First, the findings remain consistent and confirm that the relationships between LATA, Z-SCORE and RWATA on one hand, and bank capital on the other, favor the moral hazard hypothesis. Second, by comparing four estimators (POLS, FE, DGMM and SGMM), we found that the coefficients of the autoregressive term estimated using the GMM estimators with the full sample model were 0.751, 0.604, 0.169, 0.448, 0.549 and 0.416 for L. FLRGF, L. NPFGF, FLPGF, LATA, Z SCORE and RWATA respectively. They are between the autoregressive coefficient of POLS with values of 0.734, 0.729,0.436,0.513,0.941, and 0.638 for L. FLRGF, L. NPFGF, FLPGF, LATA, Z_SCORE and RWATA respectively, which are upward biased. The autoregressive coefficients of the fixed effect estimator are 0.496,0.435, 0.111,0.26, 0.499, and 0.176 for L.FLRGF, L.NPFGF,FLPGF, LATA and Z_SCORE respectively, which are downward biased. This provides evidence for the consistency of the GMM estimators. Additionally, based on the findings, similar conclusions can be drawn from the results of the difference GMM and system GMM. The outcomes therefore hold up well against different system GMM estimators.
Table 5. Other Estimation Techniques Panel A: FLRGF ModelPanel B: NPFGF ModelPanel C: FLPGF Model (1)(2)(3)(4)(1)(2)(3)(4)(1)(2)(3)(4) Var. POLSFEDGMMSGMMVar.POLSFEDGMMSGMMVar.POLSFEDGMMSGMM L.FLRGF0.734***0.496***0.647***0.751***L.NPFGF0.729***0.435***0.562***0.604***L.FLPGF0.436***0.111***0.285*0.169 -5.99-4.16-2.96-5.97-0.037-0.028-0.203-0.227-0.039-0.042-0.154-0.182 BTCR-0.002-0.024-0.013-0.019BTCR-0.012-0.060***-0.077-0.096BTCR-0.009*-0.004-0.008-0.003 (-0.18)(-1.00)(-0.54)(-0.66)-0.018-0.023-0.064-0.062-0.005-0.01-0.012-0.011 Constant3.471*0.965-1.422Constant9.783***1.53310.137Constant1.4261.881-0.215 -1.71-0.15(-0.23)-3.325-8.172-12.817-0.958-3.263-3.85 Obs.785785693785Obs.646646563646Obs.680680591680 R20.6910.396R20.6350.572R20.2640.146
No. of B_ID
928892
No. of B_ID
837983
No. of B_ID
898589 Panel D: LATA ModelPanel E: Z-SCORE ModelPanel F: RWATA Model (1)(2)(3)(4)(1)(2)(3)(4)(1)(2)(3)(4) Var.POLSFEDGMMSGMMVar.POLSFEDGMMSGMMVar.POLSFEDGMMSGMM L.LATA0.513***0.260***0.437***0.448***
L.Z_ SCORE
0.941***0.499***0.523***0.549***L.RWATA0.638***0.176***-0.040.416* -0.029-0.028-0.079-0.078-14.71-8.43-5.75-6.06-0.038-0.038-0.26-0.235 BTCR0.069***-0.073**-0.096-0.101*BTCR0.0220.126**0.125**0.114**BTCR-0.165***-0.585***-0.530***-0.408*** -0.024-0.034-0.06-0.058-0.93-2.41-2.23-2.03-0.05-0.082-0.169-0.125 Constant24.860***86.550***53.665**Constant4.20838.350***28.829**Constant22.161**251.271***197.523*** -4.97-14.705-26.653-1.44-3.96-2.57-8.712-29.569-57.307 Obs.849849751849Obs.739739645739Obs.643643558643 R20.780.603R20.9510.562R20.7030.342
No. of B_ID
989398
No. of B_ID
949094
No. of B_ID 858185 Robust t-statistics in parentheses. *** p<0.01, ** p<0.05 and * p<0.1
V. CONCLUSION AND RECOMMENDATIONS
The paper has investigated the impact of the regulatory capital ratio on Islamic bank risk for a sample of 105 banks in 29 countries over the period 2004-2020.
Regarding the Islamic banking system, three primary conclusions can be drawn.
First, at a theoretical level, IBs can benefit from applying profit and loss sharing (PLS) principles to investment account holders (IAHs); consequently, the investment accounts of IBs can be used as leverage to maximize bank profits at the expense of bank IAHs and capital position, implying that greater leverage requires higher capital ratios, thereby supporting regulatory theory. Second, in practice, IBs cannot always transfer losses to IAHs, as these will eventually cease investing with them. Consequently, they may consider maintaining higher capital ratios than conventional banks to avoid any potential solvency issues. This can also create incentives for bank shareholders to exert greater control over investment decisions made by bank managers, in line with the moral hazard hypothesis. Third, the mean of the capital ratio in the study sample is 24.79%, which is higher than the Basel III capital requirement of 10.5%. Specifically, the findings of the study are consistent with the key objective of Basel III, which states that increasing minimum capital requirements leads to increased bank stability and decreased risk.
It is hoped our empirical findings will be useful for Islamic bank regulators, policymakers, bankers and scholars. First, for all Islamic banks worldwide, we found a negative correlation between capital and risk, thereby supporting the moral hazard hypothesis. Due to the negative relationship between risk and capital, regulators could perhaps employ stricter oversight to prevent banking institutions from engaging in risky activities. Second, Islamic bank risk is affected by regulatory capital. Regulators should promote the adoption of Basel III/
Amended IFSB Standards, which enhance bank risk prevention, especially in periods of crisis such as the GFC and Covid-19. From a banker’s perspective, Islamic banks could improve their system by modifying their risk management to implement Basel III/IFSB’s recommendations. Third, distinct risk variables exhibit distinct relationships with regulatory capital. Therefore, the authorities should recognize that a policy based on a single risk variable may be completely flawed.
Our study has several limitations, of which two are noteworthy. First, no conceptual or statistical research discusses the impact of financial regulations on risk using various risk indicators such as the indicators for credit risk. Due to the lack of earlier work, there is no widely recognized benchmark for evaluating the influence of BCBS/IFSB total capital on Islamic banks. Second, our sample of risk-based regulatory capital ratios, such as the Basel III Tier 1 ratio, Tier 2 ratio, common equity ratio, additional tier 1 ratio, and Basel III leverage ratio, is less readily available for Islamic financial institutions. As a result, the additional econometric tests are constrained by the absence of more granular data.
Concerning future study, there is a pressing need to conduct more research on the topic of Islamic banking system regulation. Further research and studies are required to adapt Basel III/IFSB guidelines to Islamic bank-operating countries.
As a result, we are of the opinion that it is necessary to conduct comparative empirical studies between banks located in various regions or countries in order to understand whether banks are required to apply various regulatory guidelines. In conclusion, future studies could further consider the impact of regulatory capital