Page | 1578
Jurnal Riset Akuntansi dan Bisnis Airlangga
Vol. 8 No. 2 2023
THE MODERATING ROLE OF ESG DISCLOSURE ON FIRM STRATEGY AND STOCK PRICE CRASH RISK
Gregorius Jeandry1 Nurdin2
ABSTRACT
This study aims to examine the effect of the company's business strategy on the stock price crash risk and examine the role of ESG disclosure as moderation in the relationship between business strategy and the stock price crash risk. The study population includes all companies listed on the Indonesia Stock Exchange (IDX) for the period 2017–2022. The sampling technique used was saturation sampling, with a total of 609 observations.
Data collection techniques use content analysis. The data analysis technique uses ordinary least squares. This study found that firm strategy with the prospector typology affect the stock price crash risk, while the defenders and analyzers typologies have no effect on the stock price crash risk. ESG disclosure can weaken the effect of the business strategies of the prospector, defender, and analyzer typologies on stock price crash risk. Additional analysis found that ESG can reduce the risk of future stock price crashes. The contribution to signal theory is that there is consistently a strategic motivation for management to control good and bad information for the public. Bad information can cause the risk of price crashes to be higher than good information. Through ESG disclosure, it can provide positive signals to the public so that the risk of stock price crashes is low. The practical contribution for investors is as an investment strategy by paying more attention to the tendency of stock price crashes. For the government as a basis for making economic policies to create a well-maintained business climate.
Keyword: Strategy, ESG Disclosure, Risk, Stock
ABSTRAK
Penelitian ini bertujuan untuk menguji pengaruh strategi bisnis perusahaan terhadap risiko crash harga saham dan menguji peran pengungkapan ESG sebagai moderasi terhadap hubungan strategi bisnis terhadap risiko crash harga saham. Populasi penelitian adalah seluruh perusahaan yang terdaftar di Indonesia Stock Exchange (IDX) periode 2017-2022. Teknik pengambilan sampel menggunakan saturation sampling dengan jumlah 609 observasi. Teknik pengumpulan data menggunakan konten analisis. Teknik analisis data menggunakan ordinary least square. Studi ini menemukan bahwa strategi bisnis dengan tipologi prospector berpengaruh terhadap risiko crash harga saham, sedangkan tipologi defenders, dan analyzers tidak berpengaruh terhadap risiko crash harga saham. Pengungkapan ESG dapat memperlemah pengaruh strategi bisnis dari tipologi prospector, defender, dan analyzer terhadap risiko crash harga saham. Analisis tambahan menemukan bahwa ESG dapat mengurangi risiko crash harga saham perusahaan di masa depan. Kontribusi terhadap teori signal adalah secara konsisten adanya motivasi strategis bagi manajemen untuk mengendalikan informasi baik dan buruk kepada publik.
Informasi yang buruk dapat menyebabkan risiko crash harga saham lebih tinggi dibandingkan informasi baik.
Melalui pengungkapan ESG dapat memberikan sinyal positif bagi publik sehingga risiko crash harga saham menjadi rendah. Kontribusi praktis bagi investor adalah sebagai strategi investasi dengan lebih memperhatikan kecenderungan terjadinya crash harga saham. Bagi pemerintah sebagai dasar membuat kebijakan ekonomi untuk menciptakan pasar efisien sehingga iklmi bisnis tetap terjaga dengan baik.
Kata Kunci: Strategi, Pengungkapan ESG, Risiko, Saham
Introduction
In general, investors consider stock price movements to be the most dominant factor. The fundamental aspect is that the stock price reflects the company's value, which indicates whether the company's performance is good or bad. In the capital market, one of the risks less observed by investors in the
1Firts Author : Lecturer at Universitas Khairun, Ternate, Email: [email protected]
2Correspondence Author : Lecturer at Universitas Khairun, Ternate, Telp. 081335306211 Email: [email protected]
ARTICLE INFO Article History:
Received 17 June 2023 Accepted 21 October 2023 Available online 31 November 2023
Page | 1579
Jurnal Riset Akuntansi dan Bisnis Airlangga
Vol. 8 No. 2 2023
occurrence of a fall in stock prices, known as the stock price crash risk. Stock price is an unusually significant change in the stock price but includes all stocks on the market. Thus, it is very important to assess the stock price crash risk for investors in their portfolios. Conrad et al., (2013) and Luo (2022) state that investors consider an important factor in assessing and analyzing stocks to be the crash risk of stock prices, in which investors expect maximum returns from each investment with a relatively small risk.
Conceptually, crash risk is based on the argument that every manager has the potential and tendency to hold and accumulate bad news over a long period of time (Habib and Hasan, 2017), which has crossed a certain threshold and results in a decline in stock prices (Jin and Myers, 2006; Kim et al., 2011; Kim et al., 2014;
Silva, 2022). According to signaling theory, poor information about a company's performance can have an impact on its stock price (Liu, 2021; Silva, 2022; Xu et al., 2022). Financial reporting transparency is associated with this risk (Feng et al., 2022; Jin and Myers, 2006; Kim et al., 2011). This theory's justification is that management receives compensation and support for limiting and hiding the public's access to inaccurate company information (Silva, 2022; Hutton et al., 2009; Kothari et al., 2009), thus reducing the value of the company's shares, and harming investors.
Previous studies found that crash risk is influenced by supervisory factors (An, and Zhang, 2013), short interests (Callen, and Fang, 2015), CEO pay (Xu, and Zou, 2019), female auditors (Wang et al., 2020), better-connected CEO (Krishnamurti et al., 2021), and managers' excessive comfort level (Qiao et al., 2022, and Xu et al., 2022). Other studies have also found that ESG disclosure affects crash risk (Bae et al., 2021; Hua Fan, and Michalski, 2020; Lee et al., 2022;
Shafer, and Szado, 2020; Silva, 2022). Some previous studies have not investigated the business strategy aspect. Failure of the business to implement the strategy properly results in financial irregularities and pricing mistakes, which ultimately cause stock prices to decline (Safi et al., 2022, and Higgins et al., 2015). A company's business strategy has the potential to have a first-order impact on crash risk and cause direct economic consequences for investors. Increasingly sharp business competition means every company must have a business strategy for developing its business activities. The strategy used by the company must be suitable for the character and its environmental conditions in order to survive
The business strategy adopts Miles et al., (1978), namely prospectors, defenders, analyzers, and reactors. Each of these strategies has a unique relationship with the selected market. The prospector typology makes many changes in running the company. The defender typology runs its company stably without making many changes. The reactor typology is a type of company that is more pressured by the environment because it pays less attention to changes in the environment and the competitive system. The analyzer typology has a stable product market and makes changes. Prospector, defender, and analyzer are the most powerful strategies for the market (Akindayomi, and Amin, 2022). The reactor typology is considered an organization that has no strategy in dealing with the business environment.
Nevertheless, Miles et al., (1978) outline that defender, analyzers, and prospector are believed to affect the stock price crash risk.
Page | 1580
Jurnal Riset Akuntansi dan Bisnis Airlangga
Vol. 8 No. 2 2023
Inconsistent results were shown in previous studies, Habib, and Hasan, (2017) found that companies with the prospector type are more vulnerable to future crashes.
Safi et al. (2022) finding that prospector companies that follow aggressive strategies are more susceptible to the stock price crash rsik than defenders. Defenders perform negatively in terms of growth and overall performance, making them vulnerable to the risk of falling share prices (Zamani et al., 2013). Different results were shown by Browman and Ambrosini (2007), Prospector companies can reduce the stock price crash risk by building a good corporate image, and increasing market share. Jia, (2018), found that companies implementing exploitative innovation strategies are less vulnerable to the risk of falling share prices. Exploitative companies will use their resources and are more likely to be creative in looking for new things for long-term goals. Analyzers provided higher performance, and less the stock price crash risk (Parnell and Wright, 1993), but analyzers have a negative performance so that it has an impact on the decline in stock pricesin USA and Turkey (Parnell et al., 2015). The gaps in the results of this research need to be studied to provide investors with a more comprehensive understanding of the factors that cause stock price crash risk.
We developed this study by looking at it from a signaling perspective and exploring the possibility of factors that can be seen by management as positive signals to reduce stock price crash risk. We believe that ESG disclosure as a form of business continuity can moderate the effect of business strategy on crash risk. ESG (Environmental, Social, and Governance) disclosure can be seen as a good signal captured by investors, thus making the company get a good assessment through increased demand for stock transactions and avoiding a fall in stock price. The topic of ESG is still very relevant today (Silva, 2022), given the large number of companies implementing sustainable strategies and the increasing disclosure of ESG globally in the last two decades (Silva, 2022).
In the literature review shows that ESG disclosure can mitigate corporate crash risk (Bae et al., 2021; Dumitrescu, and Zakriya, 2021; Hua Fan , and Michalski, 2020;
Silva, 2022), both from economic, social and governance aspects which correlate negatively with stock price crash risk (Lee et al., 2022, and Li et al., 2022). Aside from being a crash risk mitigation factor, company involvement and intention in ESG disclosure is related to the type of organizational strategy. For example, Chih et al., (2022), who conducted research by applying the Miles and Snow strategy to companies in China, found that prospectors who invest in CSR have better CSR performance and CSR innovation performance than others. In addition, the poor CSR performance of Defender companies can be corrected by innovative CSR activities.
Aguilar et al., (2020), analyzing family business strategy in implementing CSR in Mexico, found that family-owned businesses with a strategic orientation as prospectors and analyzers had higher levels of developing CSR practices, reactor businesses showed lower levels of developing CSR practices, and prospector and Analyzers tend to be product developers and innovators in their respective markets. Yuan et al., (2020) found that companies with innovative strategies (prospectors) perform better than companies with an efficient orientation (defenders) when it comes to CSR performance. Furthermore, they concluded that business strategy is an important determinant of CSR performance.
Page | 1581
Jurnal Riset Akuntansi dan Bisnis Airlangga
Vol. 8 No. 2 2023
Several previous studies have examined the relationship between a company's business strategy and stock price crash risk. Still, none has discussed the moderating effect of ESG disclosure on the relationship between a company's business strategy and stock price crash risk. This study was conducted in all companies listed on the Indonesian Stock Exchange. Our concern in a developing country, Indonesia because differences in culture and regulatory requirements may also lead to different results (Aggarwal et al., 2009). In addition, heterogeneity or differences in research results are also caused by the characteristics of the data used in the study (Bajzik, 2021). Based on Singhania and Saini's findings (2022), Indonesia is one of the countries with low ESG disclosure. In developing countries, ESG evaluation is still very early, in which investors tend to be speculative rather than paying attention to fundamental matters (Feng et al., 2022). Differences in culture and regulatory requirements may also lead to different results (Aggarwal et al., 2009). In addition, heterogeneity or differences in research results are also caused by the characteristics of the data used in the study.
Theoretically, this study contributes, among others: First, it increases our understanding of the importance of signaling theory, which describes the strategic motivation for management to control good and bad information for the public, which can affect the risk of stock price crashes. Through ESG disclosure, it can provide positive signals to the public so that the risk of stock price crashes becomes low, especially in the context of Indonesia as a developing country. This can help investors allocate their resources efficiently and effectively by considering the type of business strategy of the company. Second, it helps identify market imperfections and understand how stock price information about these risks is reflected. This research can help improve market efficiency by reducing uncertainty and inefficiency that may occur due to a lack of information. Practically, this research contributes, among others: First, it helps investors and financial analysts understand the dominant factors that contribute to falling stock prices. This information can be used to make optimal investment decisions. Second, it helps the government formulate economic policies to create an efficient market so that the business climate is well maintained.
Literature Review Signaling Theory
In principle, signaling theory discusses efforts to reduce asymmetry between interested parties, in this case between company insiders and stakeholders (Spence, 2002). Companies provide information to the public so that stakeholders, especially investors, can find out as much as possible about the business. Information disclosure serves as a signal that presents information, records, or descriptions for both past, current, and future circumstances for the survival of a company and how the market affects it. Complete, accurate, and timely information is needed by investors in the capital market as an analytical tool for making investment decisions. If the announcement contains positive value, it is expected that the market will react when the announcement is received by the market (Thahira and Mita, 2021). Market reaction is indicated by changes in stock prices. If the information announcement is a good signal for investors, the stock price will increase, and vice versa.
As the party that has full control over company information, managers have great potential to play with company information. Bond and Anderson (1987), Kothari
Page | 1582
Jurnal Riset Akuntansi dan Bisnis Airlangga
Vol. 8 No. 2 2023
et al. (2009), and Graham et al., (2005) prove that managers sometimes deliberately delay the delivery of bad news to give managers more time to interpret the information.
Delaying bad news cannot be done forever. Within a certain period of time, if bad news has accumulated and management can no longer hide it, the bad news will appear in the market, causing a negative response from investors. Investors sell their shares together, which causes the risk of a rapid and drastic collapse in stock prices or stock price crash risk (Habib et al., 2018, and Kothari et al., 2009). Stock price crash risk can be influenced by aggressive business strategies when companies engage in earnings manipulation practices. Therefore, managers tend to delay bad news to a certain extent in order to maintain company stability (Bentley et al., 2013, and Higgins et al., 2015).
It can be concluded that the company's business strategy potentially has a large impact on the risk of collapse and has direct economic consequences for investors. Other parties with the ability to influence decision-making are likely to notice a positive signal when non-financial information, like ESG, is disclosed. If businesses provide non-financial details about their environmental impact, social responsibility, and corporate governance, investors might react favorably. A higher demand for stock transactions will give the company a positive evaluation in the eyes of investors, raising stock prices and the company's value.
Business Strategy
Strategy is a tool that directs environmental alignment and facilitates business integration. It includes elements like goals and objectives, actions, and resource allocation that, if improperly carried out, can result in financial irregularities (Snow, and Hambrick, 1980). Therefore, to create organizational performance effectiveness, strategic decisions are required. Miles et al., (1978) grouped the business strategy into four parts: defender, prospector, analyzer, and reactor. Each of which has a unique strategy related to the selected market. Defender is very aggressive in market penetration by developing a limited number of high-quality products. Prospector focused on discovering and exploiting new products, market opportunities and sales growth. Analyzer, a combination of Defenders and Prospectors, seeks to minimize risks and maximize profit opportunities. Reactors react to changes in the environment and are characteristically less coherent, so they cannot respond quickly to changes in their environment. But reactors are difficult to identify so research related to business strategy only focuses on three strategies that can be identified (Bentley, et al., 2012).
Therefore, the business strategies that are often used are prospectors, defenders, and analyzers. The three typologies are believed to influence investor judgment which has an impact on the risk of stock price changes.
Crash Risk
Crash risk refers to the negative value in company-specific returns caused by the hoarding of bad news by companies that have reached a certain threshold and are simultaneously exposed to the market (Kim et al., 2011; Kim et al., 2014; Silva, 2022).
Managerial motivation in withholding information from the public creates information asymmetry between internal organizational and external parties. Jin, and Myers (2006) proved this information asymmetry by conducting research that linked information asymmetry to falling stock prices. They found that the tendency of managers to
Page | 1583
Jurnal Riset Akuntansi dan Bisnis Airlangga
Vol. 8 No. 2 2023
withhold bad news affects the fall of the company's stock price in the future. Other factors include various motivations, including earnings management practices (Kothari et al., 2009) or investment decisions with prevailing market sentiments that exploit information asymmetry to hide negative information (Bebchuk, and Stole, 1993).
ESG Disclosure
ESG is a standard of corporate investment practice that integrates and executes corporate policies in a manner consistent with the concepts of environmental, social, and governance (Amel-Zadeh, and Serafeim., 2018). The issues addressed in environmental standards relate to the company's energy consumption, waste, pollution, protection of natural resources, and management of impacts on flora and fauna. Social criteria describe the company's relationship with external parties such as communities, suppliers, community groups, buyers, and other legal entities with which the company has ties. Governance standards address the process of good and sustainable corporate governance within the company.
ESG disclosure is considered a good signal that is expected to be received by other parties, especially investors, which gives the company a good assessment in the eyes of investors. ESG disclosure can be a strategy for companies to create a positive image and good corporate performance. Therefore, ESG disclosure is able to reduce investors' bad perceptions of the company, so that the stock price crash risk is getting smaller. ESG information not only helps shareholders assess a company's potential risk or estimate future cash flows (Grewal et al., 2020), but it also benefits stakeholders who do not have a direct financial stake in the company, such as consumers or the general public (Benabou, and Tirole, 2010; Christensen, et al., 2017). Furthermore, ESG reporting has several aspects and typically addresses a wide range of subjects, regulations, and actions (Amel-Zadeh, and Serafeim, 2018). It also typically focuses on long-term strategic initiatives.
Hypothesis Development
Business Strategy and Stock Price Crash Risk
Previous research has shown that business strategy provides long-term stability by delaying bad news (Bentley et al., 2012, and Higgins et al., 2015). Based on these findings, it can be concluded that business strategy can directly impact stock price crash risk. To develop its business activities, every company must have a business strategy due to increasingly fierce competition. In order to survive in the intense business competition, the company's strategy must also follow nature and the surrounding environment. Based on signaling theory perspective, managers will try to provide the best company signals to investors. Signaling theory tries to explain how companies use information and signals to communicate with capital markets and other stakeholders. These signals can be in the form of financial policies, business strategies, or other actions that provide information to investors about the condition of the company (Akindayomi, and Amin, 2022). Glover, and Lin (2018) state that good communication in conveying information can strengthen investors' reactions to good news and smooth investors' reactions to bad news.
Several previous studies such as Habib, and Hasan (2017), state that future stock price crash risk is more prone to occur in companies with an innovative (prospector) business strategy than companies with a defender strategy type. Safi et al., (2022) find
Page | 1584
Jurnal Riset Akuntansi dan Bisnis Airlangga
Vol. 8 No. 2 2023
that prospector firms that follow an aggressive strategy are more vulnerable to the risk of falling stock prices than defenders. Xu et al. (2022) find that prospective business strategy is significantly and positively related to the risk of falling stock prices. Zorofchi et al., (2021) found that firms with the defender type are less susceptible to future stock price crash risk than those with the Analyzer and prospector types. Analyzers provided higher performance, and less the stock price crash risk (Parnell, and Wright, 1993), but analyzers have a negative performance so that it has an impact on the decline in stock pricesin USA and Turkey (Parnell et al., 2015). These findings are based on the perspective of hoarding bad news, which explains that the rapid growth of prospector companies increases likelihood of financial reporting originating from financial reporting, which then motivates management to hoard bad news nd ultimately impacts the crash risk of future stock prices. Based on the discussion above, we conclude the hypothesis as follows:
H1A: Defender business strategy influences crash risk H1B: Analyzer business strategy influences crash risk H1C: Prospector's business strategy influences crash risk
ESG Disclosure, Business Strategy, and Stock Price Crash Risk
The new paradigm of business sustainability is closely related to the quality of non-financial information set by the board of directors direksi (Ekasari et al., 2018).
Increasing investor confidence in the company's non-financial information currently influences the choice of investors to buy the company's shares (García-Benau et al., 2013). Ekasari Harmadji et al., (2018) investigated the sustainability reporting strategy for crash risk by using it to explain non-financial information. They discovered that the quality of sustainable reporting reduces information asymmetry to investors, thereby lowering the company's crash risk in the future. Another study using ESG disclosure, Silva (2022) analyzed ESG disclosure with crash risk in global companies from 2007- 2019, concluding that ESG disclosure weakens future firm-specific crash risk. The same results were shown by (Bae et al., 2021; Hua Fan, and Michalski, 2020; Yang et al., 2023) which showed that ESG disclosure was able to mitigate the company's future stock price crash risk.
The results of the research above show that investors are very interested in companies that implement ESG practices, especially as there are increasingly widespread environmental issues that every company must meet. A survey conducted by the (Mandiri Institute, 2022) found that ESG issues are what attract the most interest from investors in Indonesia. The survey further found that as many as 89% of investors would invest in ESG if the risk were low. As many as 57% are willing to accept lower investment returns from ESG instruments. This shows that implementing ESG can be a positive signal to investors, mitigating the possibility of falling share prices. Based on this rationalization, we conclude that ESG disclosure can moderate the relationship between business strategy and future stock price crash risk. Thus, the hypothesis that we propose is as follows:
H2A: ESG disclosure moderates the influence of defender business strategy on crash risk H2B: ESG disclosure moderates the influence of analyzer business strategy on crash risk H2C: ESG disclosure moderates the influence of prospector business strategy on crash
risk
Page | 1585
Jurnal Riset Akuntansi dan Bisnis Airlangga
Vol. 8 No. 2 2023
Research Method Type of Research
This study is included in this type of correlational study. This study uses independent variables in the form of company business strategies consisting of prospector, defender, and analyzer typologies, as well as ESG disclosure as a moderating variable. The dependent variable tested is the risk of stock price crashes.
Data Types and Sources
The type of data used is quantitative with ratio data. This study used secondary data obtained from various sources. ESG Disclosures from the CESGS Dataset (institution owned by Universitas Airlangga.). Composite stock prices (IHSG) and weekly stock prices yahoo finance website, business strategy proxies and other financial data from OSIRIS.
Population and Samples
Population in this study is all companies listed on the Indonesia Stock Exchange (IDX) for the period of 2017-2022. The time duration in this study includes long-term forecasting. Sample in this study uses a saturation sample, that is, the entire population in this study becomes the object of the research. We excluded financial institutions (SIC 2-digit codes between 60 and 67) due to the different nature of this industry, similar to the approach used in prior research (Harymawan et al., 2022, and Kamarudin et al., 2020). The procedure leaves us with a sample of 609 firm-year observations.
Data Collection Method
This study uses documentation to collect data from data sources and is collected by copying data on each sample company such as CESGS Dataset (institution owned by Universitas Airlangga.). Composite stock prices (JCI) and weekly stock prices yahoo finance website, business strategy proxies and other financial data from OSIRIS. In addition, literature studies were also conducted from related sources such as books, journals, and articles related to this study.
Operational Definition and Measurement Variabel Stock Price Crash Risk
Stock price crash risk is the possibility of a sharp decline in a company's share price, reflecting the uncertainty or risk faced by investors related to the potential for large losses in the value of their investment (Habib et al., 2018). We refer to Chen et al. (2001) and Habib et al. (2018) in measuring stock price crash risk. The first step is to estimate the company's weekly specific return, with the following formula:
Rjt = αj + γ1, jrm,t-2 + γ2,jrm,t-1 + γ 3,jrm,t + γ 4, jrm,t+1 + γ 5, jrm,t+2 + εj,t……..(1) Where rjt is the return of firm j in week t and rmj is the market return in week t. Weekly specific return of company i in week t (Wj,t) of each company is the
Page | 1586
Jurnal Riset Akuntansi dan Bisnis Airlangga
Vol. 8 No. 2 2023
natural logarithm of one plus the residual return in equation 1, which is denoted as follows:
Wit = ln (1+ εit)………..(2)
The first measurement is NSCKEW, calculated by taking the third moment of the company's negative weekly return and normalizing it by the standard deviation of the company's negative weekly return.
NCSKEWit =
−(𝑛(𝑛−1)
3 2 ∑ 𝑊𝑖𝑡3)
((𝑛−1)(𝑛−2)(∑ 𝑅𝑖𝑡2)(∑ 𝑅𝑖𝑡2)
3 2)
……….(3)
n is the number of trading weeks in a year. Because this measure is multiplied by - 1, a large NCSKEW reflects a high crash risk.
The second measurement is by looking at the volatility of fluctuations in weekly stock returns (DUVOL), which is the natural logarithm of the standard deviation ratio of changes in firm-specific returns.
DUVOLit = log {(𝑛(𝑛𝑢−1) ∑𝐷𝑜𝑤𝑛𝑊𝑖𝑡2
𝑑−1) ∑𝑈𝑝𝑊𝑖𝑡2 }……….(4)
Where nu (nd) represents the number of weeks increased (decreased) during the firm's specific return for the year. The higher the DUVOL value, the higher the crash risk (Chen et al., 2001). For each firm j during the fiscal year period τ, the company-specific weekly returns are separated into two groups: “down” when returns are less than the annual average, and “up” when returns are more significant than the yearly average. The standard deviation of company-specific weekly returns is calculated separately for these two groups.
Business Strategy
Strategi bisnis perusahaan adalah strategi yang digunakan perusahaan agar mampu beradaptasi menghadapi lingkungan yang kompetitif (Bentley et al., 2012).
Strategi bisnis penelitian ini menggunakan tiga proksi tipologi strategi bisnis dari Miles et al., (1978), seperti Prospector, Defender, dan Analyzer. We constructed a composite measure regarding Bentley et al., (2012). The criteria used are:
1. Ratio of research and development to sales (RDS) ratio (Company's propensity to search for new products), is operationalized by dividing RandD expenditures against sales computed over a rolling prior five-year average.
2. Ratio of employees to sales (Company's ability to produce and distribute products and services efficiently), operationalized by dividing the number of employees so sales computed over a rolling prior five-year average.
3. Historical growth measure, one-year percentage change in total sales (Company's historical growth or investment opportunities, one-year percentage change in total sales computed over a rolling prior five-year average.
4. Ratio of marketing (SG and A) to sales (Company's focus on exploiting new products and services), Ratio of selling, general and administrative expenses to sales computed over a rolling prior five-year average.
Page | 1587
Jurnal Riset Akuntansi dan Bisnis Airlangga
Vol. 8 No. 2 2023
5. Employee fluctuations (Company's organizational stability), a standard deviation of total employees computed over a rolling prior five-year period.
6. Capital intensity (Company's commitment to technological efficiency), capital intensity which is measured as net PPE [PPENT] scaled by total assets [AT]
computed over a rolling prior five-year average.
All variables are calculated using the average value over the previous five years. Each of the six individual variables is ranked by forming a quintile within each double-digit SIC industry year. Within each company year, the observation with the highest quintile variable is given a score of 5, the second highest quintile is given a score of 4, etc., and the observation with the lowest quintile variable is given a score of 1. Then for each company year, we add up the scores across the six variables so that the company can receive maximum score of 30 (prospector type) and minimum score of 6 (defender type). Except capital intensity which is reversed-scored so that observations in the lowest (highest) quintile are given a score of 5 (1). The cut-off for determining the type of business strategy is Defenders (6-12); Analyzers (13-23); Prospectors (24-30) (Bentley et al., 2012).
ESG Disclosure
ESG disclosure is the disclosure of company activities related to the surrounding ecology, interaction with the social environment, and governance that aim to achieve company goals and meet stakeholder needs (Silva, 2022). This variable is measured using the GRI Standards adopted by the Global Reporting Initiative (2016). In the ESG disclosure approach, companies can use GRI 300 for environmental topics with a total disclosure indicator of 32 items, GRI 400 for social topics with a total disclosure indicator of 40 items, and GRI 102 for governance information with a total disclosure indicator of 27 items. The calculation technique for ESG disclosure can use the comparison of the number of indicators successfully reported by a company with the total number of indicators in each GRI module for each ESG aspect. This calculation uses a dummy variable by giving a value of 1 if the disclosure item is disclosed and 0 if the disclosure item is not disclosed.
Control Variable
To ascertain the robustness of the conclusions, our baseline setting controls for determinants of crash risk used by prior research. Chen et al., (2001) and Hutton et al., (2009) show an association between firm size and crash risk, whereas Graham et al., (2005) and Chen et al. (2001) document a positive association between market-to-book ratio and stock price crashes. Hutton et al., (2009) argue that the association of leverage with crash risk should be negative since greater leverage signals ex-ante greater capacity to fulfill the financial obligations. Chen et al., (2001) report that greater analyst coverage is associated with more crashes in the future. Andreou et al., (2016), and Hutton et al., (2009) show return on equity is associated positive with a greater likelihood of later experiencing a stock price crash. Following the insights of these studies, firm size is Operationalized as the natural logarithm of total assets at the end of the period, adoption from Chen et al.,(2001), and Silva, (2022). Leverage is defined as total liabilities to total assets,
Page | 1588
Jurnal Riset Akuntansi dan Bisnis Airlangga
Vol. 8 No. 2 2023
adoption from Chen et al., (2001), Feng et al., (2022), and Hutton et al., (2009).
Return on equity is defined as income after extraordinary items, adoption from Andreou et al., (2016), and Hutton et al., (2009). Market to book ratio is comparison between share price and book value per share, adoption from Andreou et al., (2016), and Hutton et al., (2009).
Model Specification
There are three models used in this research. The research model is explained as follows:
Model 1
NCSKEW = α + β1Def + β2 ESG + β3Def*ESG + β4Size + β5Lev + β6REO+ β7MB+ ε…(1) DUVOL = α + β1Def + β2 ESG + β3Def*ESG + β4Size + β5Lev + β6REO+ β7MB+ ε…(2)
Model 2
NCSKEW = α + β1Anlyz + β2 ESG + β3Anlyz*ESG + β4Size + β5Lev + β6REO+ β7MB+ ε....(3) DUVOL = α + β1Anlyz+ β2 ESG + β3Anlyz*ESG + β4Size + β5Lev + β6REO+ β7MB+ ε ….(4)
Model 3
NCSKEW = α + β1Pros+ β2ESG + β3Pros*ESG + β4Size + β5Lev + β6REO+ β7MB+ ε…(5) DUVOL = α + β1Pros + β2ESG + β3Pros*ESG + β4Size + β5Lev + β6REO+ β7MB+ ε…(6)
Model 1 is for testing the hypotheses H1a and H2a, model 2 is for H1b and H2b, model 3 is for testing H1c and H2c.
Data Analysis
In this study we used panel data regression which is a combination of times series and cross section data. Gujarati and Porter, (2009) stated that there are several methods used to estimate regression models using panel data, including pooling least square (common effect), fixed effect, and random effect approach.
This study used eviews software to analyze. We conducted the Hausman Test to determine whether the Fixed Effect Model (FEM) or Random Effect Model (REM) model will be used in the regression. Provisions for decision making are if the p- value < critical value, then the most appropriate model is the Fixed Effect Model.
Conversely, if the p-value > critical value then the most appropriate model is the Random Effect Model (REM). In addition, we also present descriptive statistics and Pearson correlations. Descriptive statistics to provide an overview of the results of the average, maximum and minimum values of all variables. Meanwhile, Pearson correlation is to see the strength of the relationship between each variable.
Result
Descriptive and Correlation Analysis
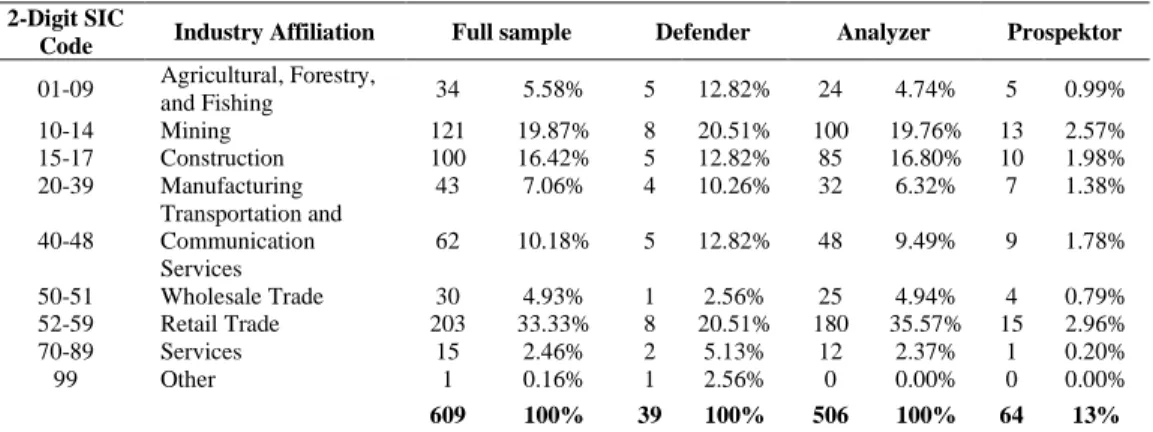
Table 1 shows the sample distribution by industry. Statistics show that out of a total of 609 observations, 83.09% (506 observations) were in the analyzer type company group, followed by the prospector type of 10.51% (64 observations), and the defender type of 6.40% (39 observations)). Overall, the composition of the
Page | 1589
Jurnal Riset Akuntansi dan Bisnis Airlangga
Vol. 8 No. 2 2023
largest industrial affiliation was in the Wholesale Trade sector, namely 33.33%, followed by Mining and Construction, respectively 19.87% and 16.42%. The most defender company composition was in the Mining and Retail Trade sector (20.51%), followed by the Agricultural, Forestry, and Fishing, and Transportation and Communication Services, and Constructions sectors (12.82%), and Wholesale Trade Others was the sector with the most a little. Companies with analyzer and prospector types have the highest observations in the Retail Trade sector, with 180 and 15 observations, respectively.
Table 1. Industry Composition
2-Digit SIC
Code Industry Affiliation Full sample Defender Analyzer Prospektor 01-09 Agricultural, Forestry,
and Fishing 34 5.58% 5 12.82% 24 4.74% 5 0.99%
10-14 Mining 121 19.87% 8 20.51% 100 19.76% 13 2.57%
15-17 Construction 100 16.42% 5 12.82% 85 16.80% 10 1.98%
20-39 Manufacturing 43 7.06% 4 10.26% 32 6.32% 7 1.38%
40-48
Transportation and Communication Services
62 10.18% 5 12.82% 48 9.49% 9 1.78%
50-51 Wholesale Trade 30 4.93% 1 2.56% 25 4.94% 4 0.79%
52-59 Retail Trade 203 33.33% 8 20.51% 180 35.57% 15 2.96%
70-89 Services 15 2.46% 2 5.13% 12 2.37% 1 0.20%
99 Other 1 0.16% 1 2.56% 0 0.00% 0 0.00%
609 100% 39 100% 506 100% 64 13%
Notes: Sample division refers to (Bentley et al., 2012) with Cut-off determination of business strategy type Defenders (6-12), analyzers (13-23) and Prospectors (24-30).
Source: processed data, 2023
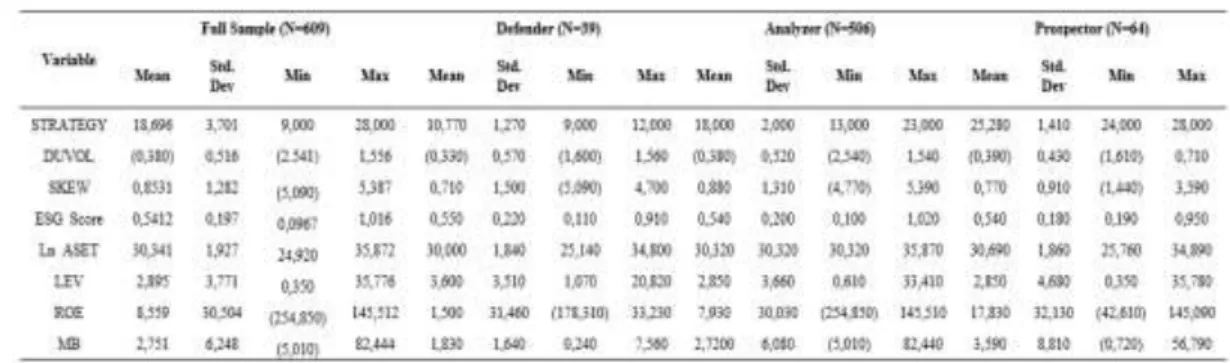
Table 2 provides descriptive statistics for all variables. We also offer separate descriptive statistics for companies based on their strategy types:
defenders, analyzers, and prospectors. The mean value for the strategy variable (full sample) is 18.6962. Suppose it is adjusted to the strategy cut-off value. In that case, it can be explained that the average sample in this study is in the Analyzers type strategy group (strategy cut-off has been defined in the methodology). The mean value of the SKEWNES variable for the analyzer type is 0.88, which is higher than the mean for the defenders (0.71) and prospectors (0.77), which indicates that the analyzer type company sample has a relatively higher crash risk compared to the defenders and prospectors company samples
Table 2. Descriptive Statistic
Source: processed data, 2023
Page | 1590
Jurnal Riset Akuntansi dan Bisnis Airlangga
Vol. 8 No. 2 2023
In contrast to DUVOL, where the sample of firms with prospectors -0.39 is higher than analyzers -0.38 and defender -0.33. The mean value for the ESG variable is 0.55 with Defender strategy, which is higher than analyzer and prospector. This indicates that companies with a defender strategy have more extensive ESG disclosures and concern for improving the company's positive image. The mean value leverage with analyzer strategy is 3.66, which is higher than defender and prospector. This indicates that companies with an analyzer strategy have a high risk, because most of their assets are financed by debt.
Firm Size with prospector strategy is 30,69, which is higher thant that defender and analyzer. This indicates that companies with a prospector strategy have a large company size, so they are able to increase productivity and company performance. Return on equity with prospector strategy is 17,83, which is higher thant that defender and analyzer. This indicates that companies with a prospector strategy have a good ability to generate profits with their capital. Market to book value with prospector strategy is 3,59, which is higher thant that defender and analyzer. This indicates that companies with a prospector strategy have a stock value that is too high (overvalue).
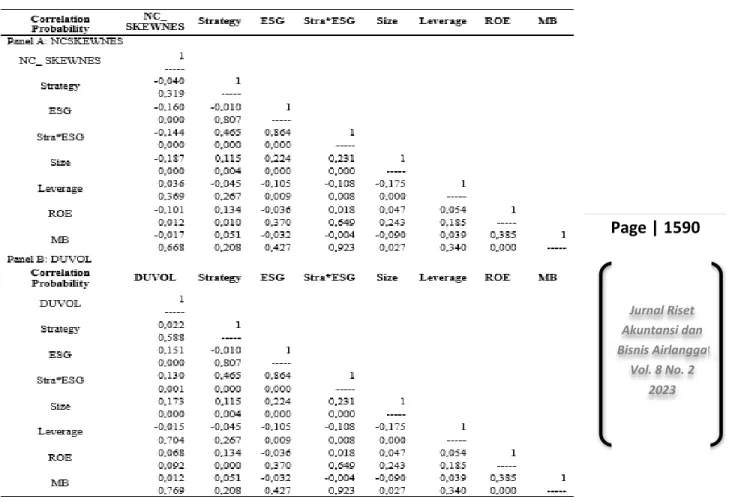
Table 3 shows Pearson (Spearman) correlation coefficients above (below) the diagonal among the business strategy, ESG disclosure, firm size, leverage, reruen on equity, and market to book value. As expected, the three-business strategy typologi are significantly related to one another with a positive correlation of approximately 1,00.
Selain itu penelitian ini menguji adanya multikolinearitas dengan pearson correlation.
Table 3. Correlation Coefficient
Source: processed data, 2023
Page | 1591
Jurnal Riset Akuntansi dan Bisnis Airlangga
Vol. 8 No. 2 2023
This study test of multicollinearity using pearson correlation, table 3 shows the coefficient value is smaller than 0.8. Among the attributes, it can be concluded that the data does not have multicollinearity problems. Untabulated results of the variance inflation factor (VIF) indicate that our regression model specifications are unlikely to suffer from the collinearity problem.
Hypothesis Testing Model Selection
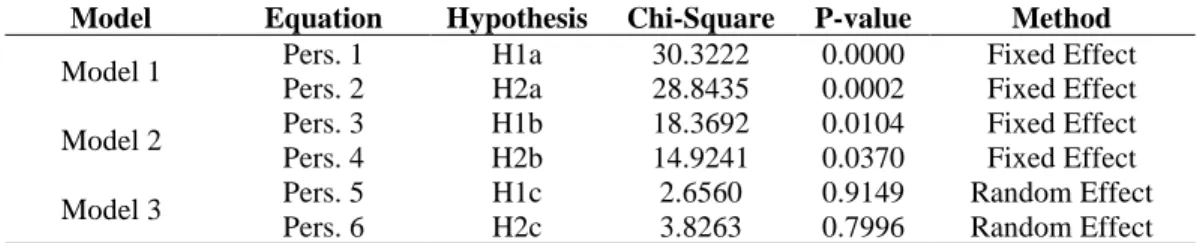
The first stage in testing the hypothesis is to carry out the Hausman Test to determine the regression model approach, whether with a fixed effect or random effect. The test results are presented in table 4. Based on the Hausman test results, it was found that the regression method in equations 1 to 4 uses the Fixed Effect Model (FEM) with a p-value greater than the probability (1%, 5%, 10%). While for equations 5 and 6 use the Random Effect Model (REM) with a p-value less than the probability.
Table 4. Hausman Tes Regression Model
Model Equation Hypothesis Chi-Square P-value Method
Model 1 Pers. 1 H1a 30.3222 0.0000 Fixed Effect
Pers. 2 H2a 28.8435 0.0002 Fixed Effect
Model 2 Pers. 3 H1b 18.3692 0.0104 Fixed Effect
Pers. 4 H2b 14.9241 0.0370 Fixed Effect
Model 3 Pers. 5 H1c 2.6560 0.9149 Random Effect
Pers. 6 H2c 3.8263 0.7996 Random Effect
Source: processed data, 2023
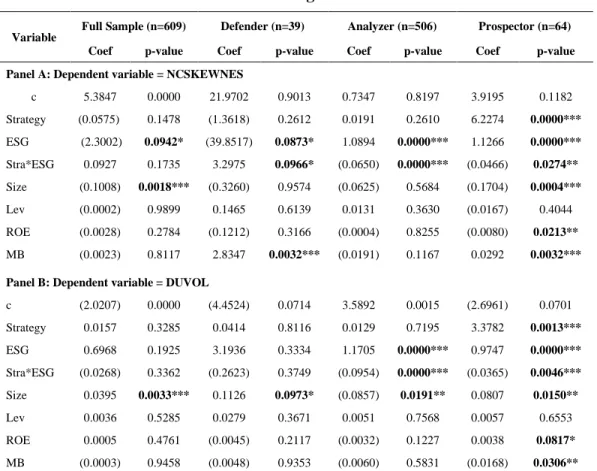
Table 5 provides information on the results of hypothesis testing in this study. We ran six tests based on models 1, 2, and 3 to prove our hypotheses. The results of testing the hypothesis in this study indicate that the direct effect of business strategy (full-sample) (p-value SKEWNES=0.1478> ; p-value DUVOL=0.3285> ), defender business strategy (H1a, p-value SKEWNES=
0.2612> ; p-value DUVOL=0.8116> ), the prospector's business strategy (H1c, p- value SKEWNES=0.3280> ; p-value DUVOL=0.8270> ) is not proven to affect stock price crash risk either by using measurements NCSKEWNES and DUVOL.
Unlike the business strategy analyzer (H1b, p-value SKEWNES=0.0148< ; p-value DUVOL=0.5505> ), it affects SKEWNES but not DUVOL. Testing the moderating effect proves that ESG moderates the influence between defenders' strategy (H2a, p-value NCSKEWNES=0.0966; p-value DUVOL=0.3749), analyzers' strategy (H2b, p-value NCSKEWNES=0.000; p-value DUVOL=0.000), and prospectors (H2c, p-value NCSKEWNES=0.0274; p-value DUVOL=0.0046) on stock price crash risk. However, this study cannot prove the moderating effect of ESG on corporate strategy (full sample). The results of the conclusion of hypothesis testing are shown in table 6.
Page | 1592
Jurnal Riset Akuntansi dan Bisnis Airlangga
Vol. 8 No. 2 2023
Table 5. Regression Results
Variable Full Sample (n=609) Defender (n=39) Analyzer (n=506) Prospector (n=64) Coef p-value Coef p-value Coef p-value Coef p-value Panel A: Dependent variable = NCSKEWNES
c 5.3847 0.0000 21.9702 0.9013 0.7347 0.8197 3.9195 0.1182
Strategy (0.0575) 0.1478 (1.3618) 0.2612 0.0191 0.2610 6.2274 0.0000***
ESG (2.3002) 0.0942* (39.8517) 0.0873* 1.0894 0.0000*** 1.1266 0.0000***
Stra*ESG 0.0927 0.1735 3.2975 0.0966* (0.0650) 0.0000*** (0.0466) 0.0274**
Size (0.1008) 0.0018*** (0.3260) 0.9574 (0.0625) 0.5684 (0.1704) 0.0004***
Lev (0.0002) 0.9899 0.1465 0.6139 0.0131 0.3630 (0.0167) 0.4044
ROE (0.0028) 0.2784 (0.1212) 0.3166 (0.0004) 0.8255 (0.0080) 0.0213**
MB (0.0023) 0.8117 2.8347 0.0032*** (0.0191) 0.1167 0.0292 0.0032***
Panel B: Dependent variable = DUVOL
c (2.0207) 0.0000 (4.4524) 0.0714 3.5892 0.0015 (2.6961) 0.0701
Strategy 0.0157 0.3285 0.0414 0.8116 0.0129 0.7195 3.3782 0.0013***
ESG 0.6968 0.1925 3.1936 0.3334 1.1705 0.0000*** 0.9747 0.0000***
Stra*ESG (0.0268) 0.3362 (0.2623) 0.3749 (0.0954) 0.0000*** (0.0365) 0.0046***
Size 0.0395 0.0033*** 0.1126 0.0973* (0.0857) 0.0191** 0.0807 0.0150**
Lev 0.0036 0.5285 0.0279 0.3671 0.0051 0.7568 0.0057 0.6553
ROE 0.0005 0.4761 (0.0045) 0.2117 (0.0032) 0.1227 0.0038 0.0817*
MB (0.0003) 0.9458 (0.0048) 0.9353 (0.0060) 0.5831 (0.0168) 0.0306**
Notes: ***, **, * represent significance levels at 1%, 5%, and 10%.
Source: processed data, 2023
Table 6. Hypothesis Conclusion
Hypothesis Decission
DUVOL SKEWNES
H1a Defender business strategy influences crash risk Reject Reject H1b Analyzers business strategy influences crash risk Reject Reject H1c Prospector's business strategy influences crash risk Accept Accept H2a ESG disclosure moderates the influence of defender
business strategy on crash risk Reject Accept (-) H2b ESG disclosure moderates the influence of the
analyzer's business strategy on crash risk Accept Accept (-) H2c ESG disclosure moderates the influence of prospector's
business strategy on crash risk Accept Accept (-) Source: processed data, 2023
Discussions
Business Strategy, and Crash Risk
It is interesting to examine the impact of strategy selection on its effect on stock price crash risk. Most of the literature has proven that stock price is the main consideration of every investor when making investments. The signaling theory perspective provides a clear picture of how the market reacts to managers' decisions to withhold bad company information at a specific time when it can no longer be
Page | 1593
Jurnal Riset Akuntansi dan Bisnis Airlangga
Vol. 8 No. 2 2023
restrained and comes to the fore, and then the information results in a decline in stock prices. One of the factors determining the level of risk of falling stock prices is the type of business strategy implemented by each company. This finding has proven that each type of business strategy used by public companies in Indonesia has a different impact or response to decisions taken by investors. The diversity of strategies in one strategy unit does not become a quality signal for Indonesian investors when they see the company's strategy. They will be more likely to see strategies at a more specific level and make many innovations and changes because they describe the characteristics of the strategy when applied within the company.
These findings prove that the defender and analyzer business strategies have no effect on stock price crash risk, whether measured by SKEWNES or DUVOL.
Meanwhile, the prospector business strategy significantly affects stock price crash risk.
This finding emphasizes that there is a strategic motivation for company management to hide and accumulate bad news in Indonesian public companies that implement a prospector strategy. Prospectors' business strategies change their product market mix rapidly to become innovative market leaders, while defender and analyzer business strategies concentrate more on a narrow and stable product base to compete on price, service, or quality. Prospectors' tendency to withstand bad news and higher probability of downside risk may also be based on the observation that prospectors suffer from higher information asymmetry compared to defender and analyzer firms.
Indonesian investors react more by selling shares or not buying shares in companies that have higher risk uncertainty and financial statements that indicate earnings management. They believe that companies with a prospector type of strategy focus more on new product innovation, aggressively pursuing market growth, and emphasizing competition through unique product offerings. This strategy has economic consequences, such as higher research and development (R&D) allocation costs. The R&D process and massive market expansion, in accounting terms, will be directly proportional to the profit in the current year. Therefore, in an effort to minimize this, efficiency is needed by performing earnings management in its financial statements.
Concealment of information on earnings management practices causes a greater potential for stock price crash risk because the information will be detected with good audit quality by independent auditors. In contrast to the defender and analyzer strategies, where companies focus more on market stability and pay attention to long- term stability that limits the types of products issued by the company, the possibility of stock price crash risk in this type of strategy is very small. Therefore, the prospector strategy affects the stock price crash risk compared to the defender and analyzer strategies, which have no effect.
The results of this study support research from Habib and Hasan (2017), Sing and Agarwal (2009), and Safi et al., (2022), which prove that the prospector's business strategy affects the stock price crash risk. Companies that adopt such strategies are assumed to focus more on innovation (including significant investment in R&D), which requires compensation contracts with a long-term perspective and encourages managerial risk-taking. In accordance with signaling theory, the size of compensation can trigger management motivation to hide information from the public, which will lead to an information asymmetry between management and investors. This condition makes companies with prospectors more vulnerable to crash risk. This study also does
Page | 1594
Jurnal Riset Akuntansi dan Bisnis Airlangga
Vol. 8 No. 2 2023
not support the research of Browman and Ambrosini (2007), Prospector companies can reduce the stock price crash risk by building a good corporate image, and increasing market share. Jia, (2018) found that companies implementing exploitative innovation strategies are less vulnerable to the stock price crash risk. Exploitative companies will use their resources and are more likely to be creative in looking for new things for long-term goals.
This study support Zorofchi et al., (2021), Habib, and Hasan (2017), and Safi et al., (2022), the defender strategy has no effect on stock price crash risk in the future.
This finding documents that future stock price crash risks are less vulnerable in companies with a defenders strategy type. The defender’s strategy type seeks a stable market and produces only limited products to serve a narrow market. Strategy defender will seek to protect its share of the market aggressively. In this character, companies with a defender type are more likely to be lower than the occurrence of stock price crash risk in the future. This study also does not support the research of Zamani et al., (2013), which shows that the defender strategy can affect the increased stock price crash risk because these companies tend to obtain less than optimal performance. This strategy tends to be less dynamic towards changes in the business environment and maintains existing ones, but has a good level of efficiency. This condition makes managers tend to withhold bad information due to non-optimal performance, thus causing stock price crash risk to be higher in the future.
This study also support the statement of Miles et al., (1978), the analyzer strategy has no effect on the risk of falling stock prices.This characteristic of business strategy is a unique combination of defenders and prospectors into one system (Miles et al., 1978). As a combination of defenders and prospectors, companies with this type of strategy are more adaptive and flexible in making adjustments, especially those related to the possibility of market response in each company policy, including the flexibility of the cost structure. This is consistent with the findings that experience crash risk is not flexible in the cost structure. This study does not support the results of research from Parnell et al., (2015) which proves that the analyzer strategy can reduce the risk of falling stock prices in the future by paying attention to the balance, namely on the one hand minimizing risk, while on the other hand the company tries to seize opportunities for profit by imitating successful product innovations. The ability to obtain optimal profits can reduce stock price crash risk. Managers will always inform good news about their success in obtaining or achieving company performance targets with controlled risks.
ESG Disclosure, Business Strategy, and Stock Price Crash Risk
The moderation effect in this study provides an overview of the role of ESG disclosure on the influence between business strategy and company crash risk. The test results show that ESG disclosures moderate the impact of defenders, analyzer, and prospector business strategies on stock price crash risk. The minus sign on the regression coefficient indicates that the moderation effect of ESG disclosure reduces the potential for a future crash risk in the company's stock price. From the signaling's perspective, this condition can be explained by the fact that greater disclosure of information hinders the accumulation of negative information from managers and reduces information asymmetry. This is in line with the cost of capital through ESG disclosures that can reduce the compensation investors need through the negative
Page | 1595
Jurnal Riset Akuntansi dan Bisnis Airlangga
Vol. 8 No. 2 2023
effects of left-tail risk. Ultimately, portfolio manager investors can benefit from the new knowledge that ESG disclosures can reduce stock price crash risk. From the signaling theory perspective, investors see that ESG is a positive signal by companies.
The positive signal indicates that in addition to business strategies (defenders, analyzers, and prospectors), the company also implements a long-term sustainable strategy through ESG disclosure that can reduce information asymmetry to reduce the crash risk of the company's stock price in the future (Reimsbach et al., 2018).
Additional information disclosed regarding ESG improves corporate governance mechanisms (for example, improving monitoring of managers' actions and reducing the costs of searching and obtaining information). Effectively, more information regarding environmental and social risks and practices followed by a company can help investors better determine a company's value and reduce information risk. ESG disclosure reduces information asymmetry regarding the business strategies of prospectors, defenders, and analysts implemented by companies, so that ESG disclosure can reduce stock price crash risk.
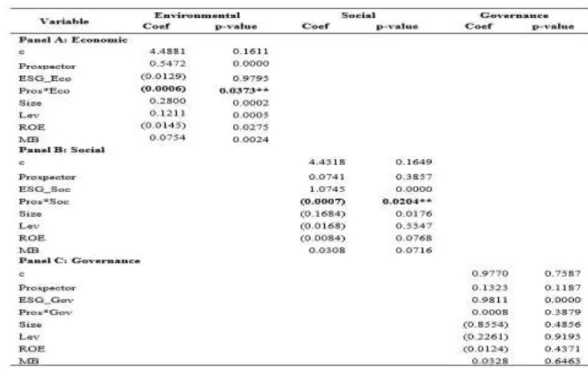
Additional Analysis
We conducted an additional analysis by examining the influence between prospectors' business strategies and the moderation of the ESG (economic, social, governance) disclosure component on SKEWNES as one of the measurements of crash risk. This test analyzes the extent of the role of ESG components in moderating the influence of business strategies on crash risk. The results show that business strategies ESG_Eco (Coef. -0.0006; p-value: 0.0373) and ESG_Soc (Coef. 0.0007; p-value:
0.0204) significantly reduce the influence of prospectors' business strategies on crash risk. Meanwhile, ESG_Gov does not moderate.
Table 8. Additional Test Results
Notes: ***, **, * represent significance levels at 1%, 5%, and 10%.
Source: processed data, 2023