THE RESPONSE OF BRICS TRADE INTEGRATION TO GEOPOLITICAL RISKS
Kazi Sohag, Md Monirul Islam, Oleg Mariev
Graduate School of Economics and Management, Ural Federal University, Russian Federation
e-mail: [email protected]; [email protected] (corresponding email); [email protected];
Submitted: 25 March 2023 - Last revised: 18 September 2023 - Accepted: 29 November 2023
Mounting geopolitical risks have led over time to a reorientation of trade integrations across different economic blocs. As one of the increasingly dominant global blocks, the organisation comprised of Brazil, Russia, India, China, and South Africa (BRICS) has intensified their trade integration. Therefore, we conducted a thorough analysis of how BRICS countries’
multilateral trade integration responded to geopolitical risk events from January 1996 to December 2021. To achieve this, we utilized a sophisticated econometric method, specifically the cross-quantilogram approach, to analyse high frequency data due to their non-normal and fat-tailed features. Our study confirms the proposition that geopolitical risks strengthened trade integration within the BRICS bloc. Specifically, our findings show that the volume of exports from one economy to another responded positively at lower to medium quantiles of exports and lower geopolitical risks, considering a 12–36-month horizon. Moreover, we found that the quantity of exports from Russia to China was higher in the presence of higher geopolitical risks. Our study demonstrates that geopolitical risks can create a sense of shared identity and mutual interest among the BRICS countries, fostering greater cooperation and trade integration.
Keywords: trade integration, geopolitical risks, cross-quantilogram approach, BRICS bloc
Abstract
I. INTRODUCTION
In the era of globalisation, the world has been witnessing significant economic, political, and social states of connectedness, which are often induced by geopolitical turmoil. Many political and economic blocs have been formed based on a mutual understanding among nations.1 Among many, BRICS, the organisation comprised of Brazil, Russia, India, China, and South Africa, is a significant economic bloc regarded as a potential rival to the G7 alliance.
BRICS represents five of the major emerging nations in the world, together
1 Wu Xinbo, “Understanding the Geopolitical Implications of the Global Financial Crisis,” The Washington Quarterly 33, no. 4 (2010): 155–163, https://doi.org/10.1080/0163660x.2010.516648.
accounting for 16% of global trade and 24% of the world’s GDP.2 From this point of view, an international bloc such as BRICS is a matter of particular interest. Each country realizes its economic and political interests through membership, inventing new mechanisms to influence globalisation processes.3 Given the current geopolitical conflict, some of the BRICS members, particularly Russia and China, have faced economic sanctions, forcing them to re-orient their trade integration strategies.4 Additionally, geopolitical risks have forced the BRICS policymakers to adopt several macroeconomic policies to decouple from the adverse effects. For instance, BRICS nations adopted bilateral national currencies swap lines, and Central Bank Digital Currencies (CBDCs). The trans-regional partnership of BRICS, due to the member countries’ multidimensional interactions, strengthens these countries’
positions in the global political and economic arenas, which motivates us to research how BRICS trade relationships have responded to global geopolitical risks over time.
Several strands of propositions further motivate us to scrutinize this study. The first motivation is the theoretical aspect of trade integration among countries. Trade linkages are a crucial component of international economic integration. However, there appears to be little consensus among scholars on whether stronger trade ties result in business cycle synchronisation. Strong trade ties among nations have led5 to the notion that diverse nations’ business cycles are comparable. Frankel and Rose showed how economic ties encourage the spread of total shocks among nations. For instance, a thriving export shock in one nation may increase the demand for items made in destination nations.
The strength of trade ties between the two countries affects how significant these effects are. Direct trade between nations is a critical factor influencing cross-country links, as6 claimed. However,7 it has been suggested that close trade ties between nations may have an opposite impact since countries tend
2 The Economic Times, “BRICS Members Have Similar Approach to Governance of Global Economy:
PM,” The Economic Times, June 23, 2022, https://economictimes.indiatimes.com/news/india/brics- members-have-similar-approach-to-governance-of-global-economy-pm/articleshow/92415117.cms.
3 Alexandra G Koval and Sergei F Sutyrin, “Transformation of the Russian Trade Policy Facing the Geopolitical Challenges,” in Russian Trade Policy (Routledge, 2019), 26–42.
4 Zongyuan Zoe Liu and Mihaela Papa, Can BRICS De-Dollarize the Global Financial System? (Cambridge University Press, 2022).
5 Jeffrey A. Frankel and Andrew K. Rose, “Is EMU More Justifiable Ex Post than Ex Ante?,” European Economic Review 41, no. 3-5 (1997): 753–60, https://doi.org/10.1016/s0014-2921(97)00034-2.
6 Kristin J. Forbes and Menzie D. Chinn, “A Decomposition of Global Linkages in Financial Markets over Time,” Review of Economics and Statistics 86, no. 3 (2004): 705–22, https://doi.org/10.1162/0034653041811743.
7 Paúl Krugman, “What Do Undergrads Need to Know about Trade,” The American Economic Review 83, no. 2 (1993): 23–26.
to specialize when growing in a more integrated way. The contemporary dynamics of international trade have brought about significant changes in the global trade system. There is a rising idea that certain emerging economies and trade blocks such as BRICS are crucial to realigning the global trade structure and play significant roles in it.8 Therefore, a study on trade linkages between countries/economic and political blocks is urgently needed to identify whether any potential risks, especially global geopolitical risks, affects their trade portfolios.
The second motivation concerns the theoretical aspects of geopolitical risk-driven trade among countries. Geopolitical risks and trade relationships are obviously related because investors, bankers, managers in the financial sector, and the media view geopolitical issues as crises affecting investment decisions. These concerns can also impact economic cycles, financial markets, and global trade.9 Normatively, geopolitics refers to a state’s controlling its territory and possibly vying for more.10 However, power struggles and other events involving businesses, non-profit organisations, political parties, and rebel groups are now seen as a component of geopolitics. Therefore, the geopolitical issues encompass various events with diverse causes and effects, such as terrorist attacks, nuclear tensions, global warming, and the economic downturn in 2009.11 On the other hand, geopolitical risks are likely to impact global trade by increasing the cost of doing business internationally for private enterprises. This can happen both through creating new risks and escalating existing ones.12 This identifies geopolitical concerns as significant risks to the economic outlook.13 Further, trade embargoes are often imposed in response to wars and other military conflicts, which may impact trade between partners
8 Çiğdem Akın and M. Ayhan Kose, “Changing Nature of North–South Linkages:
Stylized Facts and Explanations,” Journal of Asian Economics 19, no. 1 (2008): 1–28, https://doi.org/10.1016/j.asieco.2007.12.002; Prema-chandra Athukorala and Nobuaki Yamashita,
“Production Fragmentation and Trade Integration: East Asia in a Global Context,” The North American Journal of Economics and Finance 17, no. 3 (2006): 233–56, https://doi.org/10.1016/j.najef.2006.07.002;
S. J. Evenett, “Five Hypotheses Concerning the Fate of the Singapore Issues in the Doha Round,”
Oxford Review of Economic Policy 23, no. 3 (2007): 392–414, https://doi.org/10.1093/oxrep/grm025.
9 Dario Caldara and Matteo Iacoviello, “Measuring Geopolitical Risk,” International Finance Discussion Paper 2018, no. 1222 (2018): 1–66, https://doi.org/10.17016/ifdp.2018.1222.
10 Brian M. Pollins, “Conflict, Cooperation, and Commerce: The Effect of International Political Interactions on Bilateral Trade Flows,” American Journal of Political Science 33, no. 3 (1989): 737–61, https://doi.org/10.2307/2111070.
11 Dario Caldara and Matteo Iacoviello, “Measuring Geopolitical Risk,” International Finance Discussion Paper 2022, no. 1222 (2022): 1–37, https://doi.org/10.17016/IFDP.2022.1222r1.
12 Rangan Gupta et al., “Effects of Geopolitical Risks on Trade Flows: Evidence from the Gravity Model,” Eurasian Economic Review 9 (2019): 515–530, https://doi.org/10.1007/s40822-018-0118-0.
13 International Monetary Fund, World Economic Outlook, October 2017: Seeking Sustainable Growth : Short- Term Reconvert, Long-Term Growth (Washington Dc: International Monetary Fund, 2017).
and thus, geopolitical events immediately diminish trade flows.14 Geopolitical uncertainties may indirectly impact trade flows through the investment channel.
Also, geopolitical risks can have a negative impact on investments, leading to increased business and transaction costs. As a result, businesses may reconsider their decisions regarding exporting and importing.15 Additionally, these risks can affect trade through various channels such as exchange rates, fiscal and monetary policies. Exchange rates are largely influenced by expectations, and geopolitical risks can alter the expectations of monetary and fiscal policies, which in turn can significantly affect exchange rates and ultimately impact trade flows. This is supported by theoretical models and research conducted by Balcilar et al. in 2018 and Mueller et al. in 2017.16
The third motivation for this study encompasses the rationale for aligning with BRICs countries. Based on the belief that the BRIC nations are rapidly developing, a report by Goldman Sachs states that BRICS countries will surpass the level of development in the majority of the developed nations in terms of trade by the year 2050.17 In May 2014, Russia and China signed a 30-year natural gas deal worth $400 billion. Under this agreement, Russia’s Gazprom will supply China with natural gas through the Power of Siberia pipeline, strengthening energy ties between the two BRICS countries.18 The BRICS countries were only sometimes influential as a formal commercial bloc or political coalition. Instead, it is a forum offering participants chances to network and initiate business relationships. The BRICS countries are prime examples of economic development, as seen by their robust economic growth and extraordinary capacity for global competition concerning trade flows. Notably, BRICS countries contribute 25% of the global nominal GDP (US$ 16.039 trillion) and 18% of international trade.19 Therefore, an in-depth investigation is mandated to determine whether geopolitical events influence these global bloc’s trade integration.
14 Reuven Glick and Alan M. Taylor, “Collateral Damage: Trade Disruption and the Economic Impact of War,” Review of Economics and Statistics 92, no. 1 (2010): 102–27, https://doi.org/10.1162/rest.2009.12023.
15 Charles Engel, “‘Exchange Rates and Interest Parity.’ ,” in Handbook of International Economics (North Holland, 2014), 453–522.
16 Mehmet Balcilar, Matteo Bonato, Riza Demirer, and Rangan Gupta “Geopolitical Risks and Stock Market Dynamics of the BRICS,” Economic Systems 42, no. 2 (2018): 295–306; Philippe Mueller, AlirezaTahbaz‐Salehi, and AndreaVedolin, “Exchange Rates and Monetary Policy Uncertainty,” The Journal of Finance 72, no. 3 (2017): 1213–1252.
17 Dominic Wilson and Roopa Purushothaman, “Dreaming with BRICs: The Path to 2050,” Global Economics Paper 99, no. 1 (2003).
18 Mirza Sadaqat Hudaa and Saleem H. Alib, “Energy Diplomacy in South Asia: Beyond the Security Paradigm in Accessing the TAPI Pipeline Project,” Energy Research & Social Science 34 (2017): 207, https://doi.org/10.1016/j.erss.2017.07.013.
19 Badar Alam Iqbal, “BRICS as a Driver of Global Economic Growth and Development,” Global Journal of Emerging Market Economies 14, no. 1 (2021): 7-8, https://doi.org/10.1177/09749101211067096.
The fourth motivation is associated with BRICS countries’ upcoming contribution and position to the world economy as forecasted by scholars worldwide. The economies of the BRICS countries might surpass those of the G-7 countries—France, Germany, Italy, Japan, the UK, and the US—in fewer than 40 years and amount to more than half of the G-7 economies by 2025.20 By 2041, China can overtake the US as the largest economy in the world. Given that it is expected to continue being one of the fastest-growing economies for the ensuing 30 to 50 years, India’s GDP can exceed all but the US and China in size in just 30 years, moving up to 3rd place by the year 2050. By 2036, Brazil’s economy will exceed that of Germany, making it the 5th largest economy in the world by 2050. Likewise, by 2030, Russia’s economy will overtake those of Germany, France, Italy, and the United Kingdom, and by 2050, ranking 6th globally.21 Some experts, however, have emphasized the unique risks and challenges emanating from internal and external geopolitical events, such as nuclear threats, terror, and military threats, that can hamper these countries’ growth and performance in the world economy.22
This study’s final motivation is concerned with examining existing works of literature, which have taken the BRICS economies and geopolitical risks into their concentration. In their study relating to the effect of geopolitical events on the stock returns and volatility of the BRICS countries,23 studies have used nonparametric causality-in-quantile tests. They found that the BRICS countries’ individual stock markets responded differently to geopolitical risk events. The Markov-switching model accurately predicted the nonlinear and asymmetric effects of country-specific and geopolitical risk uncertainty on stock returns in all subject emerging economies. 24 The geopolitical risk (GPR) index rose due to Middle East geopolitical tensions, which shocks the oil supply.25 Some scholars revealed that geopolitical risk ‘threats’ do not impact
20 Jim O’Neill et al., “How Solid Are the BRICs,” Global Economics Paper 134, no. 1 (2005): 1–23.
21 Dominic Wilson and Roopa Purushothaman, “Dreaming with BRICs: The Path to 2050,” Global Economics Paper 99, no. 1 (2003).
22 Thomas Haugaard Jensen and Jens Anton Kjærgaard Larsen, “‘The BRIC Countries.,’” in Monetary Review 4th Quarter (Danmarks Nationalbank, 2004), 39–54; Kritalina Geogieva and Muthukumara Mani, “‘Trade and the Environment Debate: WTO, Kyoto and Beyond.,’” in Trade Policy and WTO Accession for Economic Development in Russia and the CIS: A Handbook, ed. David G (World Bank, 2006).
23 Mehmet Balcilar et al., “Geopolitical Risks and Stock Market Dynamics of the BRICS,” Economic Systems 42, no. 2 (2018): 295–306, https://doi.org/10.1016/j.ecosys.2017.05.008.
24 Mohammad Enamul Hoque and Mohd Azlan Shah Zaidi, “Global and Country-Specific Geopolitical Risk Uncertainty and Stock Return of Fragile Emerging Economies,” Borsa Istanbul Review 20, no. 3 (2020): 197–213, https://doi.org/10.1016/j.bir.2020.05.001.
25 Juncal Cunado et al., “Time-Varying Impact of Geopolitical Risks on Oil Prices,” Defence and Peace Economics 31, no. 6 (2020): 692–706, https://doi.org/10.1080/10242694.2018.1563854; Jamal Bouoiyour et al., “What Are the Categories of Geopolitical Risks That Could Drive Oil Prices Higher?
Acts or Threats?,” Energy Economics 84 (2019): 104523, https://doi.org/10.1016/j.eneco.2019.104523.
oil price dynamics, whereas geopolitical risk ‘acts’ have a detrimental influence.
Their study of the nonlinear dynamic correlations between GPR and oil prices,26 demonstrated that GPR had a more significant impact on oil price volatility than on returns. Also, related research has considered issues affecting the BRICS cryptocurrency markets.27 Deteriorating economic conditions in developed economies negatively impact capital inflows into developed nations and exports from the BRICS countries to those markets.28 Some explored how China’s GPR (country-specific geopolitical risks) affected the prices of gold, oil, in relation to other BRICS countries.29 They investigated the effects of oil volatility and uncertainty in global economic policy on the stock volatility of oil importers and exporters. From reviewing the studies mentioned above, no studies have examined the bi-lateral trade integration between countries as triggered by the different dimensions of geopolitical risks.
The motivations and the literature gap mentioned above direct us to establish this study’s goal to scrutinize the response of bilateral trade between BRICS countries to the decomposed geopolitical risk ‘threats’ and ‘acts’ during 2000-2022. To this end, we utilized a highly sophisticated econometric method, the cross-quantilogram approach to analyse the big data properties with their fat-tailed features. Our investigation findings explore a heterogeneous response of the trade integration of the BRICS countries to the geopolitical risk events.
This study’s findings can significantly influence these economies’ policymaking domain in addressing geopolitical risks for continuing trade portfolios and contributing to the world economy.
Our study made a notable contribution to the existing trade literature.
First, this is the first study to consider the trade integration between BRICS countries and examine how the decomposed geopolitical ‘events,’ ‘threats,’ and
‘acts’ influence trade among these five economies. Second, the prevailing pieces of empirical studies investigated the nexus between the geopolitical risks and
26 Jianbai Huang et al., “Effects of Geopolitical Risks on Gold Market Return Dynamics: Evidence from a Nonparametric Causality-In-Quantiles Approach,” Defence and Peace Economics 34, no. 3 (2021): 1–15, https://doi.org/10.1080/10242694.2021.2007333.
27 Elie Bouri, Rangan Gupta, and Xuan Vinh Vo, “Jumps in Geopolitical Risk and the Cryptocurrency Market: The Singularity of Bitcoin,” Defence and Peace Economics 33 (2020): 150–
161, https://doi.org/10.1080/10242694.2020.1848285; Ahmet Faruk Aysan et al., “Effects of the Geopolitical Risks on Bitcoin Returns and Volatility,” Research in International Business and Finance 47, no.
47 (2019): 511–518, https://doi.org/10.1016/j.ribaf.2018.09.011.
28 Elie Bouri et al., “Spillovers between Bitcoin and Other Assets during Bear and Bull Markets,” Applied Economics 50, no. 55 (2018): 5935–5949, https://doi.org/10.1080/00036846.2018.1488075.
29 Yingli Li et al., “Analyzing the Time-Frequency Connectedness among Oil, Gold Prices and BRICS Geopolitical Risks,” Resources Policy 73 (2021): 102134, https://doi.org/10.1016/j.resourpol.2021.102134;
Qasim Raza Syed and Elie Bouri, “Impact of Economic Policy Uncertainty on CO2 Emissions in the US : Evidence from Bootstrap ARDL Approach,” Journal of Public Affairs 22, no. 3 (2022), https://doi.org/10.1002/pa.2595.
financial markets, highlighting stock returns and volatility,30 FX rates and terror attacks,31 and economic downturn induced by the risk issues.32 Deviating from these studies, our study covers a specific global, highly emerging economic block, BRICS, which is prone to geopolitical risks in business operations.
Third, using a highly sophisticated econometric technique, namely the cross- quantilogram approach to show the time-variant diversified forms of quantile connectedness between variables has detected the magnitudes of geopolitical risks’ effect on the bilateral trade of the BRICS economies, which is our novel annexure to the trade literature. Finally, the geopolitical risk-induced trade integration status of the BRICS economies drawn from our study can shed guide policymakers’ decisions in dealing with geopolitical risk events for bolstering the escalating trade portfolios of these countries in the international market.
The remaining parts of the study are as follows: Section II delineates the research methodology. Section III describes the study’s findings and relevant discussion. Section IV ends concludes the analysis and offers policy implications.
II. METHODOLOGY II.A. Estimation Technique
In order to evaluate how geopolitical risks (GPR) affect bi-lateral trade among BRICS countries, we are utilizing the cross-quantilogram (CQ) method created by Han et al. in 2016.33 We have chosen this method for several reasons. The CQ method is suitable for analysing different parts of a data distribution, including extreme observations and the central portion of the distribution.
30 Christos Bouras et al., “Geopolitical Risks, Returns, and Volatility in Emerging Stock Markets: Evidence from a Panel GARCH Model,” Emerging Markets Finance and Trade 55, no. 8 (October 4, 2018): 1841–56, https://doi.org/10.1080/1540496x.2018.1507906; Sun-Yong Choi, “Evidence from a Multiple and Partial Wavelet Analysis on the Impact of Geopolitical Concerns on Stock Markets in North-East Asian Countries,” Finance Research Letters 46 (May 2022): 102465, https://doi.org/10.1016/j.frl.2021.102465;
Elie Bouri et al., “Spillovers between Bitcoin and Other Assets during Bear and Bull Markets,” Applied Economics 50, no. 55 (June 29, 2018): 5935–49, https://doi.org/10.1080/00036846.2018.1488075;
Mehmet Balcilar et al., “Geopolitical Risks and Stock Market Dynamics of the BRICS,” Economic Systems 42, no. 2 (June 2018): 295–306, https://doi.org/10.1016/j.ecosys.2017.05.008.
31 Mehmet Balcilar et al., “Do Terror Attacks Affect the Dollar-Pound Exchange Rate? A Nonparametric Causality-In-Quantiles Analysis,” The North American Journal of Economics and Finance 41 (July 2017):
44–56, https://doi.org/10.1016/j.najef.2017.03.010.
32 Matthew W. Clance, Rangan Gupta, and Mark E. Wohar, “Geopolitical Risks and Recessions in a Panel of Advanced Economies: Evidence from over a Century of Data,” Applied Economics Letters 26, no. 16 (December 15, 2018): 1317–21, https://doi.org/10.1080/13504851.2018.1558332.
33 Heejoon Han, Oliver Linton, Tasushi Oka, & Yoon-Jae Whang, “The Cross-quantilogram: Measuring Quantile Dependence and Testing Directional Predictability Between Time Series,” Journal of Econometrics 193, no. 1 (2016): 251-270, https://doi.org/10.1016/j.jeconom.2016.03.001.
The CQ method can be used to calculate the size and duration of the impact of a particular variable on the dependent variable. The CQ method does not rely on any parametric assumptions, making it useful for analysing data with non-standard distributions. The CQ method employs quantile matching, which does not require moment conditions, making it suitable for analysing data with fat-tailed distributions. The CQ method examines the direction of causation between two variables, including considering long-term lags during the estimation process. The CQ method can be applied across multiple time horizons, allowing for the analysis of short-term and long-term relationships between variables. The CQ method is flexible and can be used to study relationships between variables across different fields, including finance, economics, and environmental studies.
Equation (1) represents cross-quantilogram between two events and, where k signifies the lag length (k=±1,±2) for a pair of τ1 and τ2:
Where yit indicates the stationarity status of time series variables, I is equivalent to 1, 2, or 3, and illustrates liabilities, assets, or net assets and t is time (t=1,2,…T). Fi (⋅) and fi(⋅) show the functions of distribution and density measures of, yit I=1,2. denote the function of
the equivalent quantile for and, which is
the quantile-hit procedure.
Different quantiles’ serialized dependence among the variables is controlled within the CQ framework. Thus, both series belong to the monotonic conversion in the model. In the case of two events and,
indicate the absence of cross-sectional
dependency from event to event .
When assessing how differs with the kth lag span, we can determine the variational cross-quantile dependence among foreign liabilities, assets, and net assets at diverse time horizons. Thus, this lag differentiation measures the degree and extent of the dependence. We adopt k = ….. in this investigation.
Then, we check the statistical significance level of using a Ljung-Box test, in which we compute the t-statistics in the following way (2):
(1)
(2)
Where denotes the cross-quantilogram estimated below:
where shows the examined function of the quantile.
Now, we measure the cross-quantilograms’ (3) and the Q-statistic’s (2) null distribution using stationary bootstrap.
Then, we also compute fractional-cross-quantilograms (PCQ) between CPU and dependent variables (REP, SEC, WEC, BEC and GEC) (inquest of
the impact of volatiles. = [ ] is
a control variable ’ vector for . We can represent the quantile hit process with its correlation matrix and reverse matrix as follows:
(3)
Where are the
vectors of the quantile hit process. For , let and be the I-th component of and . Note that indicates the cross-quantilogram. We depict the partial cross-quantilogram below:
(4)
is assumed to be the cross-quantilogram between y1t and y2t conditional on the control variable z.
II.B. Data and Sources
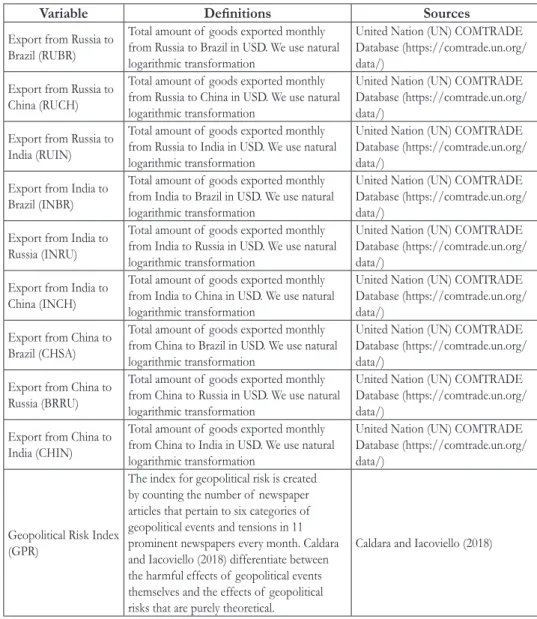
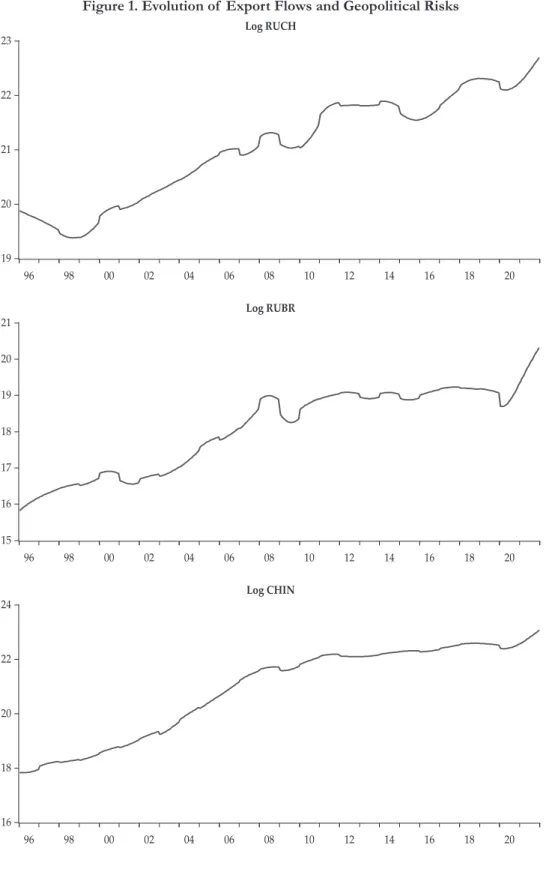
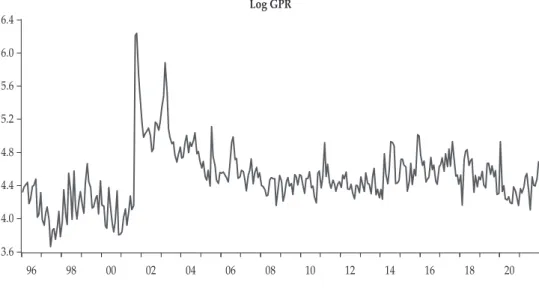
To measure the response of export flow between a BRICS member state and another member state to the geopolitical events, we mainly obtained data from the United Nations (UN) COMTRADE. Our data follows the monthly frequency from January 1996 to December 2021. Additionally, we collected the index for geopolitical risk (GPR) which is created by counting the number of newspaper articles that pertain to six categories of geopolitical events and tensions in 11 prominent newspapers every month. Figure 1 clearly exhibits the export flows from a BRICS member to another member increased sharply over time. Caldara and Iacoviello in 2018 differentiated between the harmful effects of geopolitical events themselves and the effects of geopolitical risks
that are purely theoretical.34 Figure 1 also shows the spikes of geopolitical risks are considerably high. We exclude export flows from Brazil and South Africa due to unavailability of monthly data.
34 Dario Caldara and Matteo Iacoviello, “Measuring Geopolitical Risk,” International Finance Discussion Paper 2018, no. 1222 (2018): 1–66, https://doi.org/10.17016/ifdp.2018.1222
Table 1.
Data, Definitions and Sources
Variable Definitions Sources
Export from Russia to Brazil (RUBR)
Total amount of goods exported monthly from Russia to Brazil in USD. We use natural logarithmic transformation
United Nation (UN) COMTRADE Database (https://comtrade.un.org/
data/) Export from Russia to
China (RUCH)
Total amount of goods exported monthly from Russia to China in USD. We use natural logarithmic transformation
United Nation (UN) COMTRADE Database (https://comtrade.un.org/
data/) Export from Russia to
India (RUIN)
Total amount of goods exported monthly from Russia to India in USD. We use natural logarithmic transformation
United Nation (UN) COMTRADE Database (https://comtrade.un.org/
data/) Export from India to
Brazil (INBR)
Total amount of goods exported monthly from India to Brazil in USD. We use natural logarithmic transformation
United Nation (UN) COMTRADE Database (https://comtrade.un.org/
data/) Export from India to
Russia (INRU)
Total amount of goods exported monthly from India to Russia in USD. We use natural logarithmic transformation
United Nation (UN) COMTRADE Database (https://comtrade.un.org/
data/) Export from India to
China (INCH)
Total amount of goods exported monthly from India to China in USD. We use natural logarithmic transformation
United Nation (UN) COMTRADE Database (https://comtrade.un.org/
data/) Export from China to
Brazil (CHSA)
Total amount of goods exported monthly from China to Brazil in USD. We use natural logarithmic transformation
United Nation (UN) COMTRADE Database (https://comtrade.un.org/
data/) Export from China to
Russia (BRRU)
Total amount of goods exported monthly from China to Russia in USD. We use natural logarithmic transformation
United Nation (UN) COMTRADE Database (https://comtrade.un.org/
data/) Export from China to
India (CHIN)
Total amount of goods exported monthly from China to India in USD. We use natural logarithmic transformation
United Nation (UN) COMTRADE Database (https://comtrade.un.org/
data/)
Geopolitical Risk Index (GPR)
The index for geopolitical risk is created by counting the number of newspaper articles that pertain to six categories of geopolitical events and tensions in 11 prominent newspapers every month. Caldara and Iacoviello (2018) differentiate between the harmful effects of geopolitical events themselves and the effects of geopolitical risks that are purely theoretical.
Caldara and Iacoviello (2018)
Figure 1. Evolution of Export Flows and Geopolitical Risks
19 20 21 22 23
96 98 00 02 04 06 08 10 12 14 16 18 20
Log RUCH
15 16 17 18 19 20 21
96 98 00 02 04 06 08 10 12 14 16 18 20
Log RUBR
16 18 20 22 24
96 98 00 02 04 06 08 10 12 14 16 18 20
Log CHIN
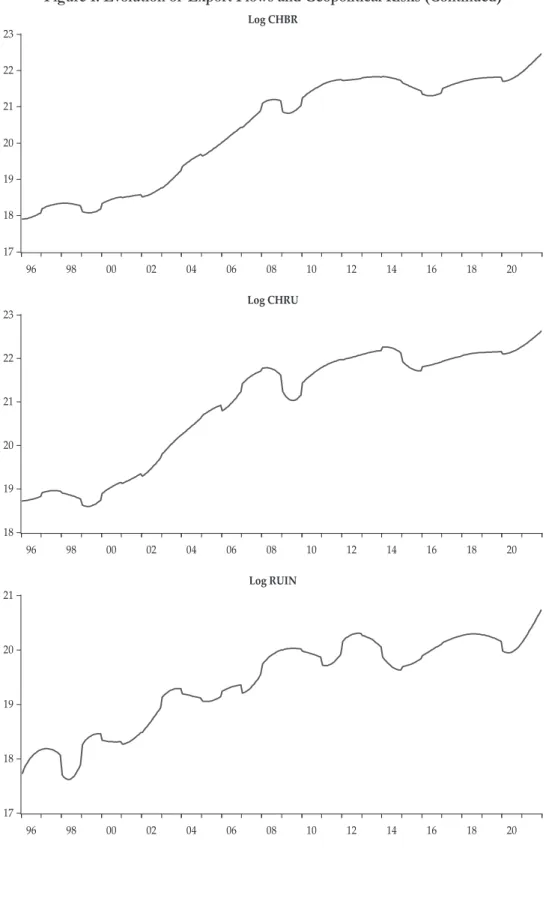
Figure 1. Evolution of Export Flows and Geopolitical Risks (Continued)
17 18 19 20 21 22 23
96 98 00 02 04 06 08 10 12 14 16 18 20
Log CHBR
18 19 20 21 22 23
96 98 00 02 04 06 08 10 12 14 16 18 20
Log CHRU
17 18 19 20 21
96 98 00 02 04 06 08 10 12 14 16 18 20
Log RUIN
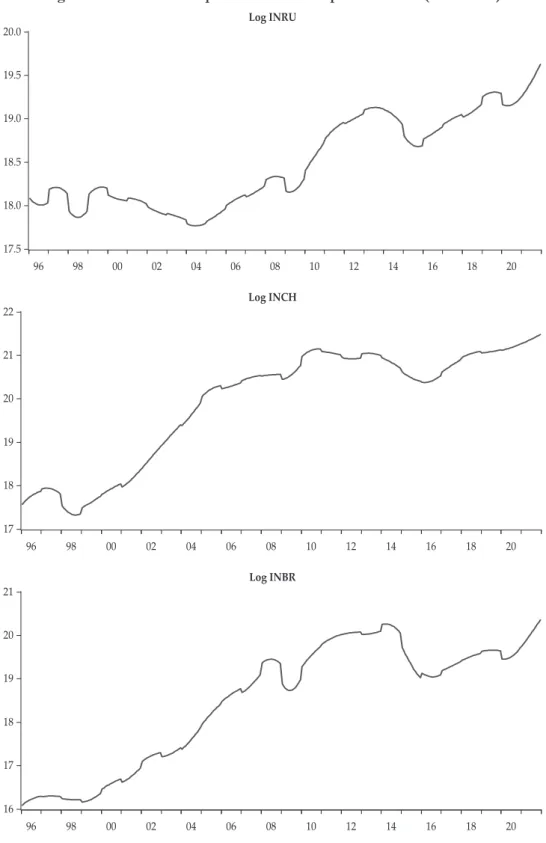
Figure 1. Evolution of Export Flows and Geopolitical Risks (Continued)
17.5 18.0 18.5 19.0 19.5 20.0
96 98 00 02 04 06 08 10 12 14 16 18 20
Log INRU
17 18 19 20 21 22
96 98 00 02 04 06 08 10 12 14 16 18 20
Log INCH
16 17 18 19 20 21
96 98 00 02 04 06 08 10 12 14 16 18 20
Log INBR
Figure 1. Evolution of Export Flows and Geopolitical Risks (Continued)
3.6 4.0 4.4 4.8 5.2 5.6 6.0 6.4
96 98 00 02 04 06 08 10 12 14 16 18 20
Log GPR
III. RESULTS AND DISCUSSION III.A. Descriptive Analysis
Our analysis commences with descriptive statistics. Table 2 reports the findings.
The logarithmic mean value of exports from Russia to China appears to be the highest while the lowest appears to be from Russia to Brazil. The standard deviation appears to be highest on the export value from China to India. The last column of Table 2 reports the descriptive statistics of geopolitical risks.
The Jarque-Bera normality test strongly rejects the top parties of normality assumption in our all variables. We further found considerable values of skewness and kurtosis. Therefore, non-normal distribution of our variables strongly supports the application of cross quantilogram analysis.
Table 2.
Descriptive Statistics
CHBR CHIN CHRU INBR INCH INRU RUBR RUCH RUIN GPR Mean 20.3872 20.8826 20.9252 18.4846 19.9083 18.4929 18.0825 21.0432 19.4003 4.5008 Median 21.0648 21.6691 21.6141 19.0448 20.4821 18.3022 18.6223 21.0722 19.7126 4.4703 Maximum 22.4549 23.0507 22.6220 20.3586 21.4792 19.6266 20.2989 22.6897 20.7292 6.2394 Minimum 17.9032 17.8256 18.5996 16.0931 17.3237 17.7689 15.8325 19.3795 17.6182 3.6647 Std. Dev. 1.4675 1.6658 1.3058 1.3981 1.3137 0.5196 1.1453 0.9430 0.8105 0.3525 Skewness -0.4451 -0.5685 -0.6115 -0.4852 -0.7753 0.2871 -0.3849 -0.2756 -0.6127 1.1634 Kurtosis 1.5402 1.7145 1.7632 1.7044 2.0042 1.5946 1.6711 1.7897 2.0997 7.0458 Jarque-Bera 38.0080 38.2906 39.3291 34.0620 44.1517 29.9623 30.6621 22.9931 30.0551 283.1766 Probability 0.0000 0.0000 0.0000 0.0000 0.0000 0.0000 0.0000 0.0000 0.0000 0.0000
Observations 312 312 312 312 312 312 312 312 312 312
III.B. Main Results
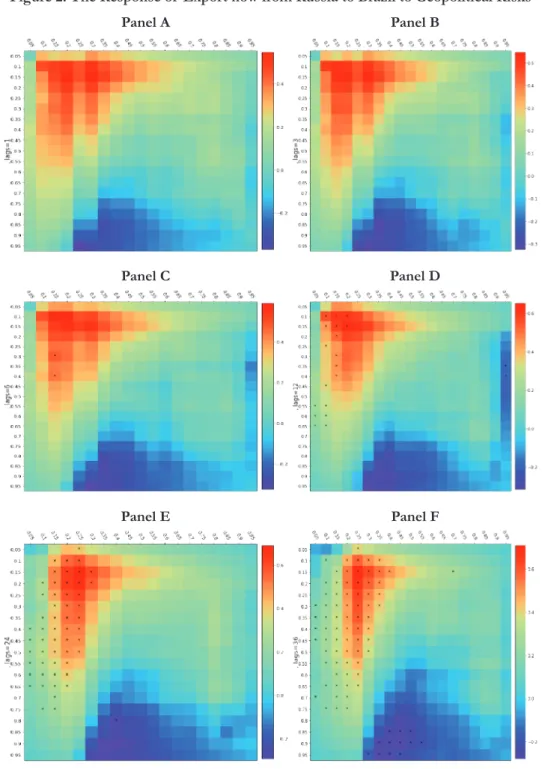
In this study, we analyse the bilateral export flow from one BRICS member country to another using a heat map diagram with 19 cells. The colour scale, ranging from reddish to bluish, indicates the degree of positive to negative response. The statistical significance at a 10% level is marked with a star.
We also examine different quantiles of geological risk from 5% to 95%, represented by the vertical line, and different quantiles of export response, indicated by the horizontal line in each diagram. To capture the effects of geopolitical events on trade, we consider various time horizons, monthly, quarterly, semi-annually, annually, biennially, and triennially lags. This approach is justified by the fact that trade agreements may take time to materialize after a significant geopolitical event. By examining different time horizons, we can better understand the extent and duration of the impact of such events on bilateral trade among BRICS countries.
In Figure 2, we present the response of export flow from Russia to Brazil to geopolitical risk, analysing different time horizons. Panels A and B of the figure reveal no significant correlation on the heatmap. This suggests that geopolitical events may not have a direct impact on the export flow from Russia to Brazil. Hence, it is reasonable to assume that trade agreements may not be affected immediately after such events. However, we argue that a period of one to three months may not be sufficient to reorient trade integration among BRICS countries.
Panel C of figure 2 shows the results of six-month lags, and interestingly, the response of export from Russia to Brazil shows a positive and significant correlation at lower quantiles of export and medium quantiles of geopolitical risks. The positive response is even more evident in panel D when we examine a 12-month lag. We found a positive correlation mainly at lower quantiles of export and geopolitical risk. Panel E and F reveal that export volume from Russia to Brazil positively respond to geopolitical risks from lower to medium quantile of export and lower to highest quantile of geopolitical risk considering two- and three-year legs. Nevertheless, examining three-year lags, we found some negative responses of export volume when geopolitical risks peak. These results suggest that geopolitical risks may have a delayed effect on the export flow from Russia to Brazil, and such effects may be more significant over longer periods.
Figure 2. The Response of Export flow from Russia to Brazil to Geopolitical Risks Panel A
Panel C
Panel E
Panel B
Panel D
Panel F
Notes: Cross-quantilogram in heatmaps. No predictable directionality is set to zero. The coloured squares are regions where the Box-Ljung test statistic is statistically significant at the 5% level. The horizontal axis represents the quantiles for bilateral trade, while the vertical axis corresponds to the quantiles of geopolitical risks.
Panel A
Panel C
Panel E
Panel B
Panel D
Panel F
Figure 3: The Response of Export flow from Russia to India to Geopolitical Risks
Notes: Cross-quantilogram in heatmaps. No predictable directionality is set to zero. The coloured squares are regions where the Box-Ljung test statistic is statistically significant at the 5% level. The horizontal axis represents the quantiles for bilateral trade, while the vertical axis corresponds to the quantiles of geopolitical risks.
Figure 3 illustrates the response of exports from Russia to India to geopolitical risks over different time trajectories. Geopolitical risks mostly increased export volume from Russia to India considering three- to twelve- month lags at the lower quantiles of export volume and lower-medium quantiles of geopolitical risk (Panels C&D). On the other hand, these risk phenomena encounter an adverse effect on the Russian trade flows to India mainly at the medium quantiles from 24 to 36-month lags. The lower time-horizon’s positive effects of geopolitical risks are due to the lower volumes of exported goods from Russia to India which was manageable and protected to be the nuisance consequence of the geopolitical risks. Notably, higher trade integration with bulky sizes of the export commodities can be somewhat unmanageable and exposed to be affected by the geopolitical turmoil as had occurred globally.
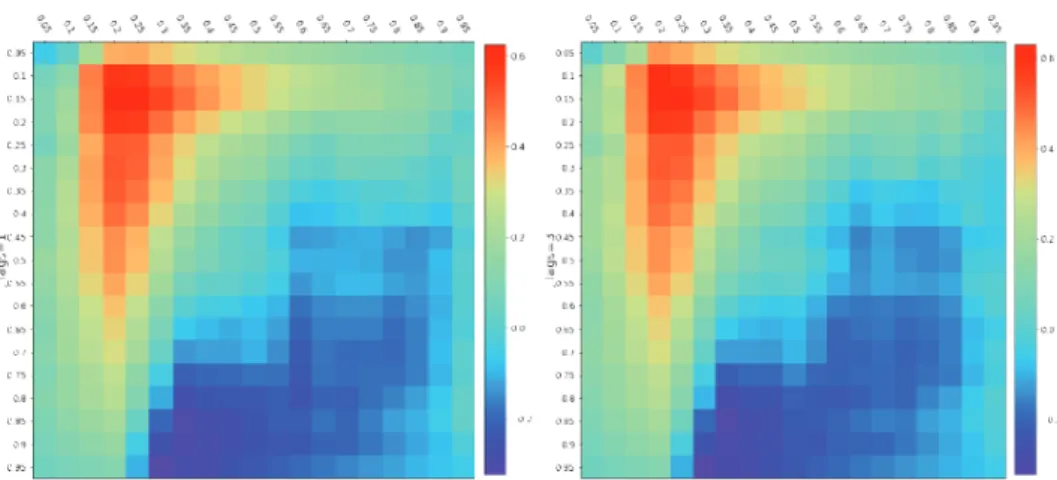
Figure 4. The Response of Export flow from Russia to China to Geopolitical Risks Panel A
Panel C
Panel B
Panel D
Figure 4 depicts the response of export flow from Russia to China to geopolitical risks in diverse time horizons. For the shorter periods (one- and three-month), there is no significant relationship between Russian export flows to China to geopolitical risks. However, in six- to 36-month lags, geopolitical risks positively influence Russian export flows to China. This positive consequence of the geopolitical risks emanates from prudent trade policy measures to control geopolitical risks and hence promote Russian export volumes to China. In addition, in the 36-month lags, this export flows’ negative response to geopolitical risks may hail from the country-specific geopolitical issues impacting Russian trade but not initial level of trade operations during the study period.
Our findings coincide with the anecdotal evidence. For Russia, the alliance with China has been especially significant, as the two countries have developed a strategic partnership that has expanded their trade and economic ties in recent years. Russia’s export dynamics to China have been shaped by several factors, including the growing demand for energy resources and the expansion of bilateral trade relations. China is now Russia’s largest trading partner, accounting for nearly 16% of its total trade in 2020. Energy exports, particularly oil and gas, have been a key driver of Russia’s exports to China.
In 2020, oil exports to China accounted for nearly 14% of Russia’s total oil exports, while natural gas exports to China reached a record high of 9.8 billion cubic meters, representing a 23% increase from the previous year. In addition
Figure 4. The Response of Export flow from Russia to China to Geopolitical Risks (Continued)
Panel E Panel F
Notes: Cross-quantilogram in heatmaps. No predictable directionality is set to zero. The coloured squares are regions where the Box-Ljung test statistic is statistically significant at the 5% level. The horizontal axis represents the quantiles for bilateral trade, while the vertical axis corresponds to the quantiles of geopolitical risks.
to energy resources, Russia has also been exporting other goods to China, such as metals, chemicals, and agricultural products. Agricultural exports have been on the rise in recent years, with China becoming a major market for Russian grain, soybeans, and other agricultural products. The COVID-19 pandemic also had an impact on Russia’s export dynamics to China.
While the pandemic initially disrupted trade flows between the two countries, the recovery of the Chinese economy in 2020 helped to boost demand for Russian goods. In fact, Russia’s exports to China increased by 3.3%
in 2020, despite the overall decline in global trade. Looking ahead, Russia’s export dynamics to China are likely to continue to be influenced by several factors, including the ongoing development of the Belt and Road Initiative (BRI), China’s massive infrastructure and trade project that aims to connect Asia, Europe, and Africa. Russia’s participation in the BRI, particularly in the areas of energy and transportation infrastructure, could lead to further growth in trade between the two countries. Overall, Russia’s export dynamics to China have been shaped by a range of factors, including the growing demand for energy resources, the expansion of bilateral trade relations, and the impact of the COVID-19 pandemic. As Russia and China continue to deepen their strategic partnership, their economic ties are likely to become even stronger, with opportunities for further trade and investment cooperation in a wide range of sectors.
Figure 5. The Response of Export flow from India to Brazil to Geopolitical Risks
Panel A Panel B
Figure 5. The Response of Export flow from India to Brazil to Geopolitical Risks (Continued)
Panel C
Panel E
Panel D
Panel F
Notes: Cross-quantilogram in heatmaps. No predictable directionality is set to zero. The coloured squares are regions where the Box-Ljung test statistic is statistically significant at the 5% level. The horizontal axis represents the quantiles for bilateral trade, while the vertical axis corresponds to the quantiles of geopolitical risks.
Figure 5 illustrates the response of export flows from India to Brazil to geopolitical risks in different time horizons. We find an insignificant role of geopolitical risks on Indian export goods to Russia in 1st and 3rd lags, whereas these risk issues are positively influential insix-, 12-,24-and 36-month lag periods. This favourable response of the Indian export flows to Brazil occurs due to these two economies’ keen realisation of the geopolitical issues and thereby have instituted remedial policies for addressing them. Besides, the negative reply of India’s export trade to geopolitical tensions at medium (24-month lags) and medium to upper (36-month lags) quantiles. This positive finding implies geopolitical risks’ functionality over the longer time trajectory reflecting the business operation between these two economies.
Figure 6. The Response of Export flow from India to Russia to Geopolitical Risks Panel A
Panel C
Panel E
Panel B
Panel D
Panel F
Notes: Cross-quantilogram in heatmaps. No predictable directionality is set to zero. The coloured squares are regions where the Box-Ljung test statistic is statistically significant at the 5% level. The horizontal axis represents the quantiles for bilateral trade, while the vertical axis corresponds to the quantiles of geopolitical risks.
Figure 6 illustrates that the response of Indian export flows to Russia to geopolitical risks are insignificant from one-month lags to 12-month lags, whereas the same reply of the Indian trade is negative in the lower quantiles from the 24-month to the 36-month lag periods. This insignificance was caused by the lack of news reports from the workers and businesspeople related to production and exporting activities. On the other hand, the negative effect of geopolitical risks to the Indian export flows to Russia took please because of the geopolitical risks in the resource country, hampering the production and business dealings with recipient countries.
Panel A
Panel C
Panel B
Panel D
Figure 7. The Response of Export flow from China to Brazil to Geopolitical Risks
Figure 7. The Response of Export flow from China to Brazil to Geopolitical Risks (Continued)
Panel E Panel F
Notes: Cross-quantilogram in heatmaps. No predictable directionality is set to zero. The coloured squares are regions where the Box-Ljung test statistic is statistically significant at the 5% level. The horizontal axis represents the quantiles for bilateral trade, while the vertical axis corresponds to the quantiles of geopolitical risks.
Figure 7 shows that the reply of the export flow from China to Brazil to geopolitical risks is dysfunction in the one- and 3-month lag periods, whereas in the six-, 12-, 24- and 36-month lag periods, the same export flows are positive from lower to medium quantities. However, these risk events negatively affect the export volumes from China to Brazil in 12-month lag (extreme quantile) and 36-mont lag periods (medium quantile). Levels of export trade’s positive response to geopolitical risks stems from governmental pre-emptive policy initiatives that monitor geopolitical risks and promote export flows. However, the longer period’s negative impact from geopolitical risks of export flows spans from the huge circulation of the risk issues in the media that created panic among the businesspeople, especially in export promotion.
Figure 8. The Response of Export flow from China to Russia to Geopolitical Risks Panel A
Panel C
Panel E
Panel B
Panel D
Panel F
Notes: Cross-quantilogram in heatmaps. No predictable directionality is set to zero. The coloured squares are regions where the Box-Ljung test statistic is statistically significant at the 5% level. The horizontal axis represents the quantiles for bilateral trade, while the vertical axis corresponds to the quantiles of geopolitical risks.
Figure 8 portrays the response of export flow from China to Russia to geopolitical risks in different time spectrums. Our analysis shows that export volume of China to Russia responds positively to global geopolitical risks considering six- to 36-month lag periods. The responses are more profound at the lower to medium quantile of export volume and lower to upper middle quantile of geopolitical risks. Apparently, a geopolitical event re-orients Chinese export volume to Russian within 24 months.
China’s exports to Russia have been a significant part of the economic relationship between the two countries. Over time, the nature and volume of this trade has evolved, reflecting changes in the political and economic circumstances of both countries. In the early years of the People’s Republic of China, trade between China and the Soviet Union, of which Russia was a part, was limited. However, with the beginning of economic reforms in China in the late 1970s, trade relations between the two countries began to thaw. China’s exports to Russia during this period were primarily raw materials, such as oil, gas, and timber, which were in high demand in Russia. In the 1990s, as Russia underwent a period of economic and political transition, China’s exports to Russia continued to grow. China began to export more manufactured goods, such as textiles, electronics, and machinery, to Russia. The early 2000s saw a further expansion of China’s exports to Russia. As China’s economy continued to grow rapidly, it became a major exporter of consumer goods to Russia, including clothing, shoes, and electronics. Overall, China’s exports to Russia have undergone significant changes over time, reflecting changes in the political and economic circumstances of both countries. Despite challenges, trade between the two countries remains an important aspect of their economic relationship.
Figure 9. The Response of Export flow from China to India to Geopolitical Risks Panel A
Panel C
Panel E
Panel B
Panel D
Panel F
Notes: Cross-quantilogram in heatmaps. No predictable directionality is set to zero. The coloured squares are regions where the Box-Ljung test statistic is statistically significant at the 5% level. The horizontal axis represents the quantiles for bilateral trade, while the vertical axis corresponds to the quantiles of geopolitical risks.
Figure 9 highlights the response of export volume of China to India. Panel C shows that exports from China to India respond positively to geopolitical risks considering a six-month lag. Interestingly, the correlation between China’s export to India and geopolitical risks is positively significant at lower export and medium geopolitical risk quantiles. In Panel D, the positive correlation is even more apparent when we analyse the 12-month time horizon. We detected a positive correlation mainly at lower quantiles of export and geopolitical risk.
Panels E and F demonstrate that the volume of China’s export to India has a positive response to geopolitical risks, ranging from lower to medium quantiles of export and from lower to highest quantiles of geopolitical risk, taking into account two- and three-year-time horizons. However, we also observed some negative responses in export volume when geopolitical risks reach their highest point, considering a three-year lag period. These findings imply that geopolitical risks could have a deferred effect on the export flows from China to India, and such effects could be more pronounced over longer periods.
The formation of the BRICS group in 2006 marked a new phase in China’s export dynamics to India. As members of the same emerging economic group, China and India have increasingly cooperated in trade and investment, as well as in regional and global economic governance. One significant development in China’s export dynamics to India after the formation of BRICS has been the growth of bilateral trade. China’s exports to India have grown steadily, with India becoming one of China’s top trading partners. China’s exports to India include a wide range of products, from electronics and machinery to chemicals and textiles. India’s demand for low-cost consumer goods has been a key driver of China’s export growth to India.
Another important aspect of China’s export dynamics to India after the formation of BRICS has been the increase in investment. Chinese companies have invested in a range of sectors in India, including infrastructure, telecommunications, and manufacturing. For example, Chinese smartphone manufacturers including Xiaomi and Oppo have become major players in the Indian market, leveraging their low-cost production capabilities and high- quality products to capture market share.
The BRICS group has also provided a platform for China and India to cooperate on issues of mutual interest. For example, the two countries have worked together to increase trade and investment, as well as to promote economic development in other developing countries. Moreover, China and India have been active in promoting regional economic integration, through initiatives such as the proposed Regional Comprehensive Economic Partnership (RCEP) and the China-India Plus One (CI+1) mechanism.
Despite the growth of bilateral trade, there have been some challenges in China’s export dynamics to India after the formation of BRICS. For example, India has sought to reduce its trade deficit with China by imposing tariffs and other trade barriers on Chinese goods. Moreover, India’s push for greater self-reliance in manufacturing has led to calls for restrictions on imports from China. These challenges, however, have not stopped the growth of bilateral trade and investment, and both countries continue to engage with each other to address mutual concerns.
Robustness Check: Rolling Window based Cross-Quantilogram
In this section, we present our findings on the cross-quantile response of biliteral trade to geopolitical risks. To achieve this, we used the Rolling-Window Cross-Quantilogram approach with a quantile set at 50%. Our analysis also includes the time-varying quantile response of the NWF to oil shocks, which we computed using a 24-month rolling window. The curves in the quantilogram plot represent the strength of the relationship between the variables at different quantiles. A steeper curve suggests a stronger dependence or predictability between the variables, while a flatter curve indicates a weaker relationship. The Rolling-Window Cross-Quantilogram approach often calculates significance levels to determine the statistical significance of the relationships. These levels indicate the probability that the observed relationship is due to chance.
We consider significance 10% levels. If a curve lies above the significance level, it suggests a statistically significant relationship. The BRICS alliance was formed in 2006. The formation of BRICS aimed to promote cooperation and collaboration among the emerging economies of these countries and enhance their influence in global economic and political issues. Our results suggest that trade relationships among BRICS intensified 2006 amid high due to Iraq invasion. Additionally, a dispute between Russia and Ukraine over gas prices and supply disrupted energy flows to several European countries in 2006. The conflict highlighted Russia’s influence over energy resources and its impact on geopolitical stability in the region.
Figure 10. The Response of Export flow from Russia to Brazil to Geopolitical Risks
0.5
-0.5
-1.0 0.0
2000 2005 2010 2015 2020
Figure 11. The Response of Export flow from Russia to China to Geopolitical Risks
1.0
0.2
-0.2 0.6
2000 2005 2010 2015 2020
Figure 12. The Response of Export flow from Russia to India to Geopolitical Risks
0.0
-0.5 0.5
2000 2005 2010 2015 2020
Figure 13. The Response of Export flow from India to Brazil to Geopolitical Risks
0.0
-1.0 1.0
0.5
-0.5
2000 2005 2010 2015 2020
Figure 14. The Response of Export flow from India to China to Geopolitical Risks
0.0 1.0
0.5
-0.5
2000 2005 2010 2015 2020
Figure 15. The Response of Export flow from India to Russia to Geopolitical Risks
-0.4 0.0
-0.8
2000 2005 2010 2015 2020
Figure 16. The Response of Export flow from China to Brazil to Geopolitical Risks
-0.5 0.0 0.5
-1.0
2000 2005 2010 2015 2020
Figure 17. The Response of Export flow from China to India to Geopolitical Risks
-0.5 0.0 0.5 1.0
2000 2005 2010 2015 2020
Figure 18. The Response of Export flow from China to Russia to Geopolitical Risks
-0.5 0.0 0.5 1.0
2000 2005 2010 2015 2020
III.C. Discussion
The finding that geopolitical risks promote trade integration in the BRICS bloc is a significant and interesting one. The BRICS group has become an increasingly important player in the global economy over the past decade.
These countries are not only among the largest emerging markets, but they also have significant geopolitical influence, and their economic and political ties are increasingly intertwined. One possible explanation for the finding that geopolitical risk promotes trade integration in the BRICS bloc is that external threats tend to promote cooperation and integration among countries. When faced with a common external threat, such as economic sanctions or trade restrictions from a powerful country or bloc, the BRICS countries feel compelled to cooperate and pool their resources to mitigate the impact of these threats. In such a scenario, trade integration may be seen as a way to increase resilience and reduce vulnerability to external shocks.
Another possible explanation is that geopolitical risks may create opportunities for trade integration by reducing the costs of trade. When countries face geopolitical risks such as political instability, conflict, or security threats, they may face higher costs of doing business and increased uncertainty.
In such circumstances, it may become more attractive for countries to reduce their dependence on traditional trading partners and seek out new markets and trading opportunities within the BRICS bloc. By doing so, countries can reduce their exposure to external risks and increase their economic and political ties with other members of the bloc. Besides, our findings coincide with the many theorical and empirical studies. For instance, Koval & Sutyrin observed that a BRICS country realizes its economic and political interests through membership, inventing new mechanisms to influence globalisation processes.35 In the current situation of geopolitical conflict, some BRICS members, particularly Russia and China, have encountered several economic sanctions, forcing them to re-orient their trade integration strategies.36 Additionally, there is increasing support for the idea that certain emerging economies and trade blocks such as BRICS are crucial to realigning the global trade structure and play significant roles in it.37
35 Alexandra G. Koval and Sergei F. Sutyrin, “Transformation of the Russian Trade Policy Facing the Geopolitical Challenges,” in Russian Trade Policy (Routledge, 2019), 26–42
36 Zongyuan Zoe Liu and Mihaela Papa, Can BRICS De-Dollarize the Global Financial System? (Cambridge University Press, 2022).
37 Çiğdem Akın and M. Ayhan Kose, “Changing Nature of North–South Linkages:
Stylized Facts and Explanations,” Journal of Asian Economics 19, no. 1 (2008): 1–28, https://doi.org/10.1016/j.asieco.2007.12.002; S. J. Evenett, “Five Hypotheses Concerning the Fate of the Singapore Issues in the Doha Round,” Oxford Review of Economic Policy 23, no. 3 (2007): 392–414, https://doi.org/10.1093/oxrep/grm025.