1
A Study of E-Banking Services in Public Sector Banks in India
Saraswati1 and Netra Pal Singh2*
1,2School of Business Management & Commerce, MVN University Palwal, Haryana, India
Abstract
Bankers in India provide ease of service by utilizing information technology for safe and appropriate transaction services. With this paradigm change in view, this research paper embodies the analysis of three dimensions/factors of e-banking:
accessibility, convenience, and security, and the impact of these factors on customer satisfaction. The study is based on the secondary and primary data collected with a structured questionnaire from 165 respondents in the vicinity of the district of Palwal, Haryana. The public sector banks and respondents were selected using the criteria of the convenience sampling method. The data was collected on 17 statements of inherent three dimensions on a 5-point Likert scale and three statements of customer satisfaction dimension. The collected data was subjected to inferential statistics and dimension reduction/factor analysis. The results indicate a positive contribution of three latent variables towards the overall satisfaction of customers of public sector banks in India.
Keywords: e-banking, ATM, public sector banks, customer satisfaction
JEL : G21
DOI : 10.24002/kinerja.v28i1.7505
Received : 06/22/2023 Reviewed: 09/26/2023 Final Version: 01/19/2024
1. INTRODUCTION
Banks in India are classified into four categories i.e., (i) commercial banks (PSU Banks, Private Banks, Payments Banks, and Foreign Banks), (ii) small finance banks, (iii) payments banks, and (iv) cooperative banks (rural cooperatives & Urban Cooperatives) (Singh, 2023). The public sector undertaking (PSU) banks, which have the confidence of customers across India and account for US$ 1602.65 billion out of US$2481.21 billion banking sector assets during 2020-21 (IBEF, 2022), initiated ease of service in the aspect of flexibility, efficiency, simplicity, accessibility, convenience/simplicity, and adequate security with the usage of information &
communication technologies (ICT) in line with the digital policy of Government of India. Public sector banks in India witnessed two major trends in the last two decades – (i) the merger of small & loss-making banks with their parent banks or other public sector banks to enhance financial performance and to have better control, (ii)
2
increasing use of information & communication technologies (ICT) in all customer- facing & internal operations of banks to achieve the mission “digital India, and to reduce, human errors, paperwork, and the cost of operations and extended banking services at the door of customers with ease (Dhananjay, 2015). The first trend is evident from the fact that during the year 1980. The number of PSU banks was 20, having 18,083 branches. In 2022, the number was reduced to 12 banks & 80,573 branches (Department of Financial Services, 2022). State Bank of India (SBI) has taken the lead with respect to the usage of ICT-based services. Today, all the PSU banks are using e-banking & other ICT-based services, which is evident from the Unified Payment Interface (UPI) transactions statistics. UPI processed 5.95 billion transactions worth over ₹10 trillion in May 2022, compared to 5.58 billion transactions amounting to ₹9.83 trillion in April 2022. UPI was launched in 2016 (Panda, 2022).
Many terms are used for ICT-based services in the banking industry. Jadhav (2022) reported that ten types of digital payment systems are available to Indian banks. These are (i) banking cards, (ii) Unstructured Supplementary Service Data (USSD), (iii) Aadhaar Enabled Payment System (AePS), (iv) Unified Payment Interface (UPI), (v) Mobile Wallets, (vi) Bank Pre-Paid Cards, (vii) Point of Sale (POS) Terminals, (viii) Internet Banking, (ix) Mobile Banking, and (x) Micro ATMs. However, this is not the universal classification even within India. Common term e-banking encompasses information-only systems, electronic information transfer systems, full information transfer systems, automatic teller machines, credit/debit cards, smart cards, bill payment systems, mobile banking, fund transfer systems, buying entry tickets, etc. The popularity of these systems and services is augmented by the Indian banking regulator, Reserve Bank of India (RBI), by creating/ developing or approving new categories of organization and products based on the application of ICT with an objective of achieving stated central government goals of inclusive growth across all sections of societies. Keeping this in view, the research paper attempts to analyze the awareness and satisfaction of e-banking services among customers of different demographics in tier-III cities and semi-urban areas of the National Capital Region (NCR), New Delhi.
This study has the following main objectives related to awareness of e-banking services and the impact of various dimensions of e-banking services on customer satisfaction, as listed below.
i. To study the awareness and usage of e-banking services among the customers of public sector banks.
ii. To study the relationship of e-banking on the customer satisfaction of public sector banks.
iii. To analyze the perception of e-banking services for different categories of respondents as per their age, gender, income, educational qualification, types of account, e-banking services of customers, and relation of the identified factors, namely accessibility, convenience, and security with customer satisfaction.
2. LITERATURE REVIEW
This section presents a review of the literature on e-banking services of Public Sector Banks in India with a view to finding gaps in the literature and preparing a questionnaire for data collection along with data analysis methods.
3 Doddaraju (2013) analyzed the banking services and customer satisfaction of public and private sector banks in the Anantapur District of Andhra Pradesh State, India. Based on analysis of variance (ANOVA) results, the researcher concluded that private-sector banks provide better services than public-sector banks. Therefore, the public sector needs to enhance its services to attract customers. Yadav and Ravindra (2017) studied the banking environment and customer satisfaction towards e- banking services among the customers of Rewari District in the State of Haryana in India. They concluded that the majority of customers were satisfied with ATM services, electronic clearance (EC), electronic Fund transfer (EFT), online banking, deposit services, card services, and credit services. However, the level of satisfaction was higher among female customers. Their conclusions are based on chi-square test. They suggested that public sector banks should increase ATM services in small towns and villages to achieve the objectives of financial inclusion and cashless transactions in rural India.
Singhal (2017) studied the factors influencing customers and their overall satisfaction with the services of public and private sector banks. Based on ANOVA analysis, the researcher concluded that rural customers differ significantly from urban customers in their awareness level and usage level of e-banking. It is observed that urban male youth have higher awareness and usage of e-banking. In contrast, rural women are noticeably aware of e-banking, but their use level is very low. Kant et al.
(2017) investigated service quality dimensions, customer satisfaction, and corporate image in Indian public sector banks using the Structural Equation Model (SEM).
Researchers found that tangibility and assurance dimensions were the most important customer satisfaction factors. Customers were satisfied with service quality and corporate image in the Indian banking sector. Researchers found a positive impact of responsiveness on customer satisfaction. They suggested improving service quality would increase corporate image through customer satisfaction in the Indian banking sector.
Reeta and Asht (2016) analyzed the various e-banking services and the challenges banks face in approving the technology. Researchers found that almost all e-banking services are provided by banks, but customers have concerns about the security of transactions. They suggested technical default needs the attention of bankers, and the government should enhance expenditure on infrastructure. Kadam and Yelikar (2013) evaluated the e-banking scenario involving public sector banks in India and concluded almost all PSU banks are offering similar traditional services via the e-banking route. However, a scope exists for public sector banks to distinguish themselves through their e-banking service. The international offering of e-banking services also provides another opportunity for them to increase their e-banking services. Thangapandi and Gobinath (2016) measured the degree of importance related to various service quality dimensions like reliability, responsiveness, empathy, tangibility, and assurance among the customers. They compared the public, private, and foreign banks based on customers’ expectations and perceptions of quality of services. The interval between the customers’ expectations and perceptions of the responsiveness dimension was higher for the three categories of banks. In foreign banks, reliability was higher, and in private-sector and public-sector banks, assurance dimensions were higher.
Saravanan and Leelavathi (2020) focused on exploring the impact of E-banking variables on Customer Attitude and customer satisfaction in the Chennai District of
4
Tamil Nadu, India. They concluded that dimensions such as efficiency, privacy, service quality, and website design contribute maximum towards customer satisfaction. Kundu and Datta (2015) analyzed the relationship between e-banking services and customer satisfaction. They observed a significant relationship between e-service quality, trust, and customer satisfaction. They also found that internet banking privacy and fulfillment were the key service quality factors that affected trust.
In all, they suggest that banks should enhance the features of privacy of operation of the customers. Karthikeyan and Krishnan (2021) focused on the awareness level of Axis Bank customers regarding e-banking services and problems. Researchers concluded that the majority of the respondents were aware of ATM services, and ATM services are the leading e-banking services used by the customers, followed by POS, Mobile Banking, EFT, and internet banking.
Madhavan and Vethirajan (2020) analyzed customer satisfaction and perception of e-banking services and the interrelationships among the various dimensions of e-banking service quality of public sector and private sector banks in Puducherry, India. They found a significant difference between perceptions of services among different demographic segments. Kaur and Kiran (2015) examined how e-banking consumers perceive the e-banking services of public, private, and foreign sector banks operating in India. The results revealed that customers perceive that foreign banks' quality of services is better than private and public sector banks.
Differences are analyzed for testing differences using ANOVA.
Priyanka (2017) examined that e-banking helps overcome the drawbacks of the manual system as it provides the facility of storing, consolidating, analyzing, and presenting data as the customer wants with speed and accuracy. This research paper focused on technologies used in e-banking, their advantages and challenges, and legal issues-IT Act 2000. Singh and Bassi (2017) evaluated customer satisfaction with internet banking in public and private sector banks. Researchers found that banks should provide attractive, secure, and easy-to-use services.
Tadesse (2018) examined the impact of 25 ATM attributes related to ATM services and identified key attributes and factors that influence customers’ satisfaction with ATM banking. Kant et al. (2017) investigated service quality dimensions, customer satisfaction, and corporate image in Indian public sector banks using the Structural Equation Model (SEM). Researchers found that tangibility and assurance dimensions were the most important customer satisfaction factors. Customers were satisfied with service quality and corporate image in the Indian banking sector. There was a positive impact of responsiveness on customer satisfaction. Bishnoi (2013) measured customers' perceptions regarding Automated Teller Machine (ATM) /Debit Card. The researcher concluded that ATMs were very convenient during travel, reduced cash requirements, and had no extra cost from the bank side.
Further, the perception of customers between public and private sector banks' ATM services did not differ significantly. Kothari (2018) found no significant difference between private and public bank employees adopting internet banking. He further concluded that internet banking is efficient, enhances the performance and quality of services, and is easy to use, which leads to better productivity and customer satisfaction.
Rengarajan et al. (2018) interpreted the customer perception of digital payments comparatively between the private sector and public sector banks with
5 regard to the usage and awareness of digital payments. Researchers found a positive correlation between awareness and use of digital payments between the Private and Public sector Banks. Public sector banks were weaker in introducing and implementing digitalization than private sector banks. Kumar (2017) compared the public and private sector banks in the context of customer relationship marketing strategies and customer loyalty impact. He found that banks in the City of Hyderabad, India, were driven to adopt Customer Relationship Marketing Strategies (CRMSs) to increase customer loyalty. Public sector banks need to be more concerned about devising CRMSs.
Banker et al. (2020) observed that e-banking consumers were classified into
three clusters, and their behavior for each cluster differed. One cluster’s behavior was positive, and they accepted the changes. The behavior of cluster two was negative, and they were not ready to accept changes, and the behavior of cluster three was a mixture of both clusters. Insan and Kumari (2015) investigated customers' satisfaction with internet banking. Researchers found that the customers of Sirsa (Noth-west, India) were using internet banking services like loans and credit cards. People were aware of and satisfied with the internet banking services provided by their banks. Researchers suggest banks should deal politely with customers, providing extra benefits to internet banking users. Ray (2018) studied various factors and the impact of the banks' service attributes on customers’ satisfaction with private and public sector banks in Dinajpur, Bangladesh. Researchers found that customers are highly satisfied with the tangibility dimension for both private and public sector banks. The customers were more satisfied with private banks than with public sector banks. He found the lowest satisfaction with empathy in public and private sector banks and suggested that focusing on customers’ intended services is key to achieving business success.
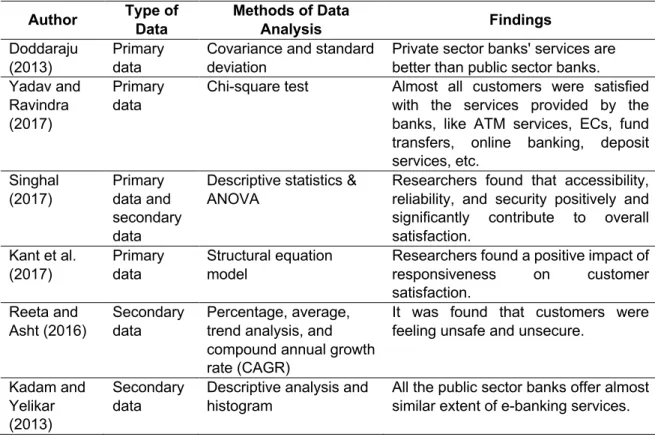
Table 1. Summary of Reviewed Research Papers
Author Type of Data
Methods of Data
Analysis Findings
Doddaraju (2013)
Primary data
Covariance and standard deviation
Private sector banks' services are better than public sector banks.
Yadav and Ravindra (2017)
Primary data
Chi-square test Almost all customers were satisfied with the services provided by the banks, like ATM services, ECs, fund transfers, online banking, deposit services, etc.
Singhal (2017)
Primary data and secondary data
Descriptive statistics &
ANOVA
Researchers found that accessibility, reliability, and security positively and significantly contribute to overall satisfaction.
Kant et al.
(2017)
Primary data
Structural equation model
Researchers found a positive impact of responsiveness on customer satisfaction.
Reeta and Asht (2016)
Secondary data
Percentage, average, trend analysis, and compound annual growth rate (CAGR)
It was found that customers were feeling unsafe and unsecure.
Kadam and Yelikar (2013)
Secondary data
Descriptive analysis and histogram
All the public sector banks offer almost similar extent of e-banking services.
6
Author Type of Data
Methods of Data
Analysis Findings
Thangapandi and
Gobinath (2016)
Primary and secondary data
Credit/Deposit ratio analysis
Compare private and public sector banks with SERVQUAL analysis for responsiveness, reliability, empathy, assurance, and tangibility.
Saravanan and Leelavathi (2020)
Primary and secondary data
Correlation & regression analysis
They determined that the dimensions such as efficiency, privacy and website design contribute maximum towards customer satisfaction.
Kundu and Datta (2015)
Primary and secondary data
Factor analysis,
Reliability test, ANOVA, etc.
There was a significant relationship between e-service quality, trust, and customer satisfaction
Karthikeyan and
Krishnan (2021)
Primary and secondary data
Percentage and Garrett ranking
Most respondents were aware of the ATM services followed by POS, Mobile Banking, EFT, and internet banking.
Madhavan and Vethirajan (2020)
Primary data
Descriptive analysis, ANOVA, t-test, correlation.
The significant difference between the perception of services among different demographic segments was concluded.
Kaur and Kiran (2015)
Primary data
Factor analysis,
regression analysis, and ANOVA
The customers perceive that foreign banks' quality of services is better than private and public sector banks Priyanka
(2017)
Secondary data
Review of literature Focused on technologies used in e- banking, advantages and challenges, and legal issues-IT Act 2000.
Singh and Bassi (2017)
Secondary data
Review of literature Researchers found that banks should provide attractive, secure, and easy-to- use services.
Tadesse (2018)
Secondary data
Review of literature ATM is the key factor for influencing customer satisfaction.
Bishnoi (2013)
Primary data
Mean, SD, ANOVA The researcher concluded that ATMs were very convenient during travel, reduced cash requirements, and had no extra cost from the bank side Kothari
(2018)
Secondary data
Review of literature Internet banking is efficient, enhances the performance and quality of services, and is easy to use, which leads to better productivity and customer satisfaction.
Rengarajan et al. (2018)
Primary data
Correlation, Regression, cross tabulation, Anova
A positive correlation exists between awareness and usage of digital payments in the case of the private and public sector Banks
Ray (2018) Primary &
Secondary Data
Descriptive analysis and inferential analysis
The customers were more satisfied with private banks than with public sector banks. The lowest satisfaction was for empathy in both public and private sector banks.
Banker (2020)
Primary data
Reliability analysis, Factor analysis, Cluster
observed that e-banking consumers were classified into three clusters, and
7 Author Type of
Data
Methods of Data
Analysis Findings
analysis, KMO, Bartlett, ANOVA
their behavior for each cluster was different
Insan and Kumari (2015)
Primary &
Secondary Data
Descriptive analysis Customers were aware and satisfied with the internet banking services provided by their banks
Kumar (2017)
Primary data
Discriminant validity, Confirmatory factor analysis
Customer relation parameters were highly correlated with customer loyalty.
Source: Compiled by authors.
Research Problem
It is evident from the literature review and its summary in Table 1 that most of the studies of e-banking services in India are based on yes and no types of responses and analyses limited to frequency analysis and ANOVA or t-test. The present study, though based on a relatively small sample size, is based on mainly Likert-type data and consists of all possible statistical analyses as per the nature of data.
3. METHODOLOGY
This section presents the research methodology, including the target population, sampling framework, sample size, instrument of data collection, research hypothesis, methods of data collection, and methods of data analysis & presentation of results.
3.1. Sample Size
It is an exploratory study with a sample size of 272, considered adequate for an error margin of 5%, population proportion of 50%, and 90% confidence level.
Accordingly, 280 respondents from the target population were approached to complete the questionnaire. Out of 280 responses, only 165 respondent’s data were valid and used in this study. The reasons for the rejection of the filled-in questionnaire were large missing values, inconsistent recorded observations, and lack of respondents' knowledge about the meaning of statements. The response would have been better if the questionnaire had been converted to local language.
3.2. Data Collection
This study is based on the primary data as well as secondary data. Primary data was collected with the help of a well-structured questionnaire by using different methods of contacting respondents. Secondary data was collected from the reports, magazines, and research papers/ articles. Primary data was collected from respondents who were customers of public sector banks via emails, monkey surveys, direct interviews, and oral telephonic interviews.
3.3. Methods of Data Analysis
Data were subjected to descriptive and frequency analysis for categorized data.
For scaled-ordered data, reliability analysis is applied before subjecting the data to
8
testing various hypotheses using ANOVA, t-test, and factor analysis. New variables resulting from factor analysis were further subjected to regression analysis. To carry out factor analysis, the reliability coefficient values, KMO and Bartlett test are also calculated.
4. RESULT AND DISCUSSION
This section presents the analysis of primary data collected via a structured questionnaire in the following subsections. The first section 4.1. presents descriptive statistics of demographics followed by descriptive statistics analysis of types of accounts and e-banking services availed by respondents. The following section, 4.2., embodies the results of testing various hypotheses with respect to demographics, followed by factor analysis and testing of hypotheses of latent factors accessibility, convenience, security, and customer satisfaction and regression analysis in the last section 4.3.
4.1. Descriptive Statistics of Demographics
This section presents the descriptive statistics of demographics, namely gender, age, monthly income, e-banking services & duration of using e-banking services, educational qualification, and type of accounts and awareness of e-banking services. The results are presented as the frequency distribution of respondents per demographic in tables and the percentage of values. Table 2 presents frequencies of awareness and gender. It can be seen from the data that 91.5% of respondents are aware of the e-banking services of public sector banks, and male and female respondents are evenly distributed (55.8% male and 44.2% female).
Table 2. Frequency Distribution of Respondents as per Awareness of E-Banking Services and Gender
Awareness of E-Banking Frequency Gender Frequency
Yes 151 (91.5) Male 92 (55.8)
No 14 (8.5) Female 73 (44.2)
Total 165 (100) Total 165(100)
Note: Figures in brackets are percentages of the total. Source: Compiled by authors.
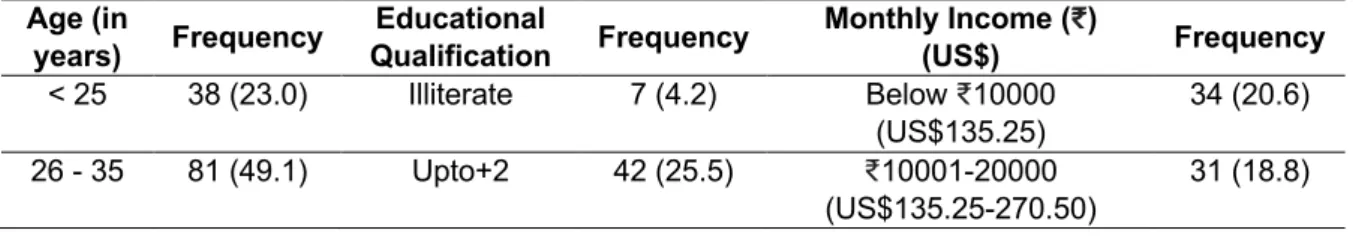
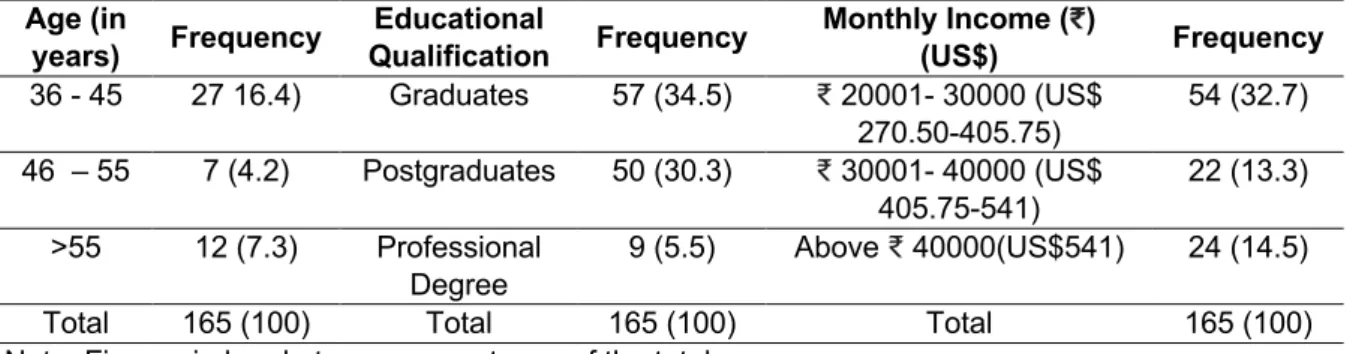
Table 3 embodies the distribution of the respondents as per age, educational qualification, and monthly income. The majority of the respondents (49.1%) are of the age group 26 years to 35 years and are either graduates (34.5%) or postgraduates (30.3%). The most prominent monthly income category is 20,000 to 30,000.
Table 3. Frequency Distribution of Respondents as per Age, Educational Qualification, and Monthly Income
Age (in
years) Frequency Educational
Qualification Frequency Monthly Income (₹)
(US$) Frequency
< 25 38 (23.0) Illiterate 7 (4.2) Below ₹10000 (US$135.25)
34 (20.6) 26 - 35 81 (49.1) Upto+2 42 (25.5) ₹10001-20000
(US$135.25-270.50)
31 (18.8)
9 Age (in
years) Frequency Educational
Qualification Frequency Monthly Income (₹)
(US$) Frequency
36 - 45 27 16.4) Graduates 57 (34.5) ₹ 20001- 30000 (US$
270.50-405.75)
54 (32.7) 46 – 55 7 (4.2) Postgraduates 50 (30.3) ₹ 30001- 40000 (US$
405.75-541)
22 (13.3)
>55 12 (7.3) Professional Degree
9 (5.5) Above ₹ 40000(US$541) 24 (14.5)
Total 165 (100) Total 165 (100) Total 165 (100)
Note: Figures in brackets are percentages of the total.
Source: Analysis of primary data collected by authors.
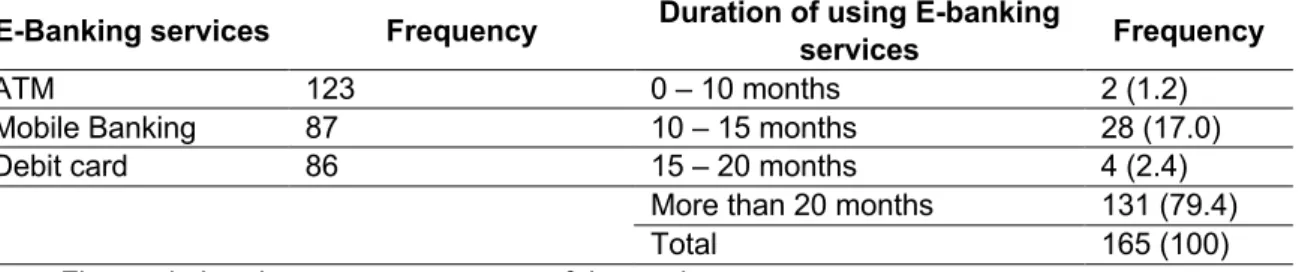
Table 4 shows the frequency distribution of the respondents as per most used e-banking services (ATM, mobile banking, Debit cards) and duration of using e- banking services. ATM users are the highest among respondents, followed by mobile banking and debit cards (Aderonke and Ayo, 2010). Most respondents have been using e-banking services for over 20 months, while only two have used them for less than ten months.
Table 4. Frequency Distribution of Respondents as per Kind of Major E-Banking Services and Duration of Using E-Banking Services
E-Banking services Frequency Duration of using E-banking
services Frequency
ATM 123 0 – 10 months 2 (1.2)
Mobile Banking 87 10 – 15 months 28 (17.0)
Debit card 86 15 – 20 months 4 (2.4)
More than 20 months 131 (79.4)
Total 165 (100)
Note: Figures in brackets are percentages of the total.
Source: Analysis of primary data colected by authors.
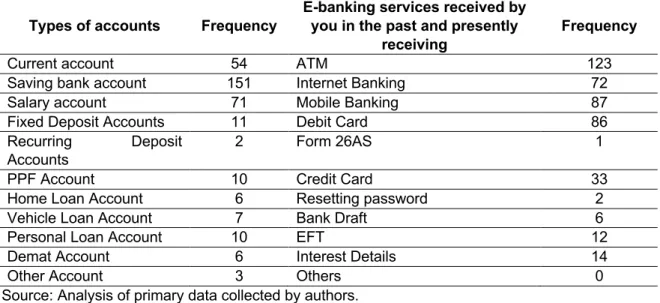
The frequency distributions of the respondents/customers/users for types of accounts and e-banking services received in the past and presently receiving are given in Table 5.
Table 5. Frequency Distribution of Respondents as per Types of Accounts and E- Banking Services Received by You in the Past and Present
Types of accounts Frequency
E-banking services received by you in the past and presently
receiving
Frequency
Current account 54 ATM 123
Saving bank account 151 Internet Banking 72
Salary account 71 Mobile Banking 87
Fixed Deposit Accounts 11 Debit Card 86
Recurring Deposit Accounts
2 Form 26AS 1
PPF Account 10 Credit Card 33
Home Loan Account 6 Resetting password 2
Vehicle Loan Account 7 Bank Draft 6
Personal Loan Account 10 EFT 12
Demat Account 6 Interest Details 14
Other Account 3 Others 0
Source: Analysis of primary data collected by authors.
10
It is evident from the data that almost all customers have savings bank accounts (151) and salary accounts (71), while very few have recurring deposit accounts (2).
On the other hand, 123 respondents used ATM services in the past and present, followed by mobile banking (87) and debit cards (86), while Form 26AS usage is much less in the past and present.
4.2. Inferential Statistics of Demographics
This section presents the mean perception score of 17 statements (details of the statement are given in the appendix) for different demographics along with p- values for testing the difference mean perception score and standard error of the mean for different categories of demographics.
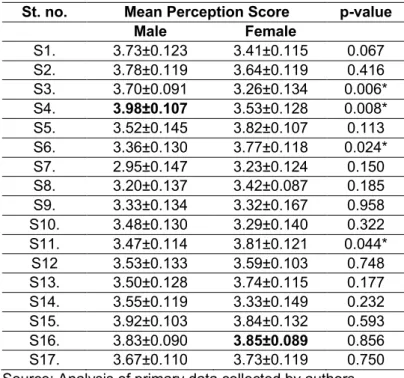
The mean perception score of 17 statements, standard error, and median values for gender (male and female) are calculated and presented in Table 6. The mean perception score of the male respondent is the maximum for statement S4 (3.98) and minimum for statement S7 (2.95). The mean perception score of female respondents is maximum for statement S16 (3.85), followed by S15 (3.84) and minimum for statement S7 (3.23). The mean perception score for all statements, except four, is not statistically different for males and females. It can be seen from the table that the mean score for both males and females is more than 2.95.
Table 6. Mean Perception Score of the Respondents as per Gender
St. no. Mean Perception Score p-value
Male Female
S1. 3.73±0.123 3.41±0.115 0.067 S2. 3.78±0.119 3.64±0.119 0.416 S3. 3.70±0.091 3.26±0.134 0.006*
S4. 3.98±0.107 3.53±0.128 0.008*
S5. 3.52±0.145 3.82±0.107 0.113 S6. 3.36±0.130 3.77±0.118 0.024*
S7. 2.95±0.147 3.23±0.124 0.150 S8. 3.20±0.137 3.42±0.087 0.185 S9. 3.33±0.134 3.32±0.167 0.958 S10. 3.48±0.130 3.29±0.140 0.322 S11. 3.47±0.114 3.81±0.121 0.044*
S12 3.53±0.133 3.59±0.103 0.748 S13. 3.50±0.128 3.74±0.115 0.177 S14. 3.55±0.119 3.33±0.149 0.232 S15. 3.92±0.103 3.84±0.132 0.593 S16. 3.83±0.090 3.85±0.089 0.856 S17. 3.67±0.110 3.73±0.119 0.750 Source: Analysis of primary data collected by authors.
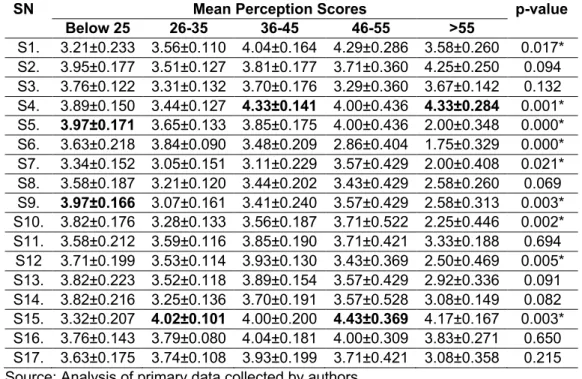
Mean perception scores for five age categories are presented in Table 7. It can be inferred from Table 7 that the null hypothesis (H0: There is no difference between mean perception score of 17 statements for five age categories) is rejected for 9 statements, and for the remaining 8 statements, there was no evidence against the null hypothesis.
The mean perception score of the statement for the respondents under 25 years of age is maximum for statements S5 & S9 and minimum for statement S1. The mean
11 perception score of 26–35-year-old respondents is maximum for statement S15 and minimum for statement S7. For the next category of respondents, i.e., 36–45 years, the mean perception score is maximum for statement S4 and minimum for statement S7. The mean perception score of 46-55 years respondents is maximum for statement S15 and minimum for statement S6. The mean perception score of respondents of 55 years and above is maximum for statement S4 and minimum for statement S6.
Table 7. Mean Perception Score of the Respondents as per Age (in Years)
SN Mean Perception Scores p-value
Below 25 26-35 36-45 46-55 >55
S1. 3.21±0.233 3.56±0.110 4.04±0.164 4.29±0.286 3.58±0.260 0.017*
S2. 3.95±0.177 3.51±0.127 3.81±0.177 3.71±0.360 4.25±0.250 0.094 S3. 3.76±0.122 3.31±0.132 3.70±0.176 3.29±0.360 3.67±0.142 0.132 S4. 3.89±0.150 3.44±0.127 4.33±0.141 4.00±0.436 4.33±0.284 0.001*
S5. 3.97±0.171 3.65±0.133 3.85±0.175 4.00±0.436 2.00±0.348 0.000*
S6. 3.63±0.218 3.84±0.090 3.48±0.209 2.86±0.404 1.75±0.329 0.000*
S7. 3.34±0.152 3.05±0.151 3.11±0.229 3.57±0.429 2.00±0.408 0.021*
S8. 3.58±0.187 3.21±0.120 3.44±0.202 3.43±0.429 2.58±0.260 0.069 S9. 3.97±0.166 3.07±0.161 3.41±0.240 3.57±0.429 2.58±0.313 0.003*
S10. 3.82±0.176 3.28±0.133 3.56±0.187 3.71±0.522 2.25±0.446 0.002*
S11. 3.58±0.212 3.59±0.116 3.85±0.190 3.71±0.421 3.33±0.188 0.694 S12 3.71±0.199 3.53±0.114 3.93±0.130 3.43±0.369 2.50±0.469 0.005*
S13. 3.82±0.223 3.52±0.118 3.89±0.154 3.57±0.429 2.92±0.336 0.091 S14. 3.82±0.216 3.25±0.136 3.70±0.191 3.57±0.528 3.08±0.149 0.082 S15. 3.32±0.207 4.02±0.101 4.00±0.200 4.43±0.369 4.17±0.167 0.003*
S16. 3.76±0.143 3.79±0.080 4.04±0.181 4.00±0.309 3.83±0.271 0.650 S17. 3.63±0.175 3.74±0.108 3.93±0.199 3.71±0.421 3.08±0.358 0.215 Source: Analysis of primary data collected by authors.
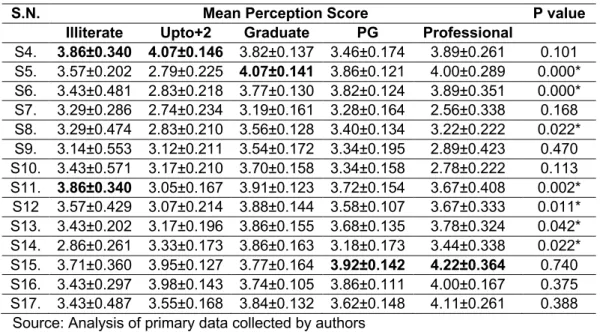
The mean perception scores for five educational qualification categories of the respondents for 17 statements of the study are compiled in Table 8. It can be inferred from Table 8 that null hypotheses (H0: There is no significant difference between mean perception score for 17 statements with respect to five categories of educational qualification) are rejected for 7 statements, and no evidence is found for the remaining 10 statements. The mean perception score of illiterate respondents is maximum for statements S4 & S11 and minimum for statements S14. The mean score of upto+2 qualified respondents is maximum for statement S4 and minimum for statement S5. For the graduate category, mean perception is maximum for statement 5 and minimum for S7. For the postgraduate (PG) category, the mean perception score is maximum for statement S15 and minimum for statement 14. The maximum mean perception score for the professional category is for statement 15, and the minimum is for statement S7.
Table 8. Mean Perception Score of the Respondents as per Educational Qualification
S.N. Mean Perception Score P value
Illiterate Upto+2 Graduate PG Professional
S1. 3.00±0.436 3.55±0.193 3.77±0.150 3.40±0.131 4.11±0.261 0.130 S2. 3.43±0.528 3.95±0.152 3.61±0.150 3.76±0.147 3.33±0.408 0.385 S3. 3.43±0.297 3.62±0.113 3.70±0.135 3.20±0.171 3.44±0.338 0.126
12
S.N. Mean Perception Score P value
Illiterate Upto+2 Graduate PG Professional
S4. 3.86±0.340 4.07±0.146 3.82±0.137 3.46±0.174 3.89±0.261 0.101 S5. 3.57±0.202 2.79±0.225 4.07±0.141 3.86±0.121 4.00±0.289 0.000*
S6. 3.43±0.481 2.83±0.218 3.77±0.130 3.82±0.124 3.89±0.351 0.000*
S7. 3.29±0.286 2.74±0.234 3.19±0.161 3.28±0.164 2.56±0.338 0.168 S8. 3.29±0.474 2.83±0.210 3.56±0.128 3.40±0.134 3.22±0.222 0.022*
S9. 3.14±0.553 3.12±0.211 3.54±0.172 3.34±0.195 2.89±0.423 0.470 S10. 3.43±0.571 3.17±0.210 3.70±0.158 3.34±0.158 2.78±0.222 0.113 S11. 3.86±0.340 3.05±0.167 3.91±0.123 3.72±0.154 3.67±0.408 0.002*
S12 3.57±0.429 3.07±0.214 3.88±0.144 3.58±0.107 3.67±0.333 0.011*
S13. 3.43±0.202 3.17±0.196 3.86±0.155 3.68±0.135 3.78±0.324 0.042*
S14. 2.86±0.261 3.33±0.173 3.86±0.163 3.18±0.173 3.44±0.338 0.022*
S15. 3.71±0.360 3.95±0.127 3.77±0.164 3.92±0.142 4.22±0.364 0.740 S16. 3.43±0.297 3.98±0.143 3.74±0.105 3.86±0.111 4.00±0.167 0.375 S17. 3.43±0.487 3.55±0.168 3.84±0.132 3.62±0.148 4.11±0.261 0.388
Source: Analysis of primary data collected by authors
The mean perception scores of the 17 statements in the context of five categories of monthly income (₹/US$) of respondents are presented in Table 9. It is evident from the p-values that the null hypothesis (H0: There is no significant difference between mean perception score for 17 statements with respect to five categories of monthly income) is rejected for 15 statements, and for the remaining 2 statements, there was no evidence against the null hypothesis. It is evident from the analysis presented in Table 9 that respondents’ perception scores are not the same for the majority of statements of accessibility, convenience, and security. Secondly variation in the values of statements is more visible in the context of income categories compared to categories of other demographics.
Table 9. Mean Perception Score of the Respondents as per Monthly Income (₹/US$)
S. N. Mean Perception Scores p-value
Below ₹ 10,000 (US$135.25)
₹ 10,001-20,000 (US$135.25-
270.50)
₹20,001-30,000 (US$ 270.50-
405.75)
₹30,001- 40,000 (US$
405.75-541)
> ₹ 40,000 (US$541)
S1. 2.85±0.243 3.45±0.196 3.89±0.094 3.86±0.221 3.87±0.202 0.000*
S2. 3.47±0.220 3.94±0.153 3.87±0.121 3.14±0.257 4.00±0.233 0.016*
S3. 2.91±0.233 3.55±0.112 3.78±0.108 3.45±0.235 3.71±0.204 0.002*
S4. 3.03±0.241 4.06±0.113 3.96±0.109 3.50±0.244 4.33±0.187 0.000*
S5. 3.53±0.180 4.06±0.167 3.57±0.173 4.05±0.203 3.12±0.320 0.024*
S6. 3.21±0.223 4.00±0.185 3.78±0.101 3.64±0.214 2.79±0.318 0.000*
S7. 3.47±0.204 3.48±0.190 2.96±0.175 2.64±0.259 2.63±0.287 0.012*
S8. 3.21±0.192 3.68±0.156 3.11±0.169 3.27±0.199 3.38±0.224 0.230 S9. 2.62±0.203 4.32±0.149 3.17±0.194 3.59±0.225 3.13±0.291 0.000*
S10. 2.85±0.212 4.16±0.168 3.48±0.144 3.41±0.225 2.96±0.310 0.000*
S11. 2.94±0.174 3.87±0.184 3.65±0.157 4.00±0.147 3.83±0.206 0.001*
S12 3.09±0.181 4.03±0.182 3.65±0.124 3.91±0.217 3.08±0.294 0.028*
S13. 3.44±0.228 4.19±0.182 3.54±0.134 3.36±0.214 3.46±0.248 0.000*
S14. 2.82±0.255 4.10±0.188 3.28±0.141 3.68±0.241 3.71±0.175 0.000*
S15. 3.79±0.210 3.32±0.199 3.87±0.130 4.41±0.142 4.29±0.175 0.001*
S16. 3.65±0.173 3.81±0.142 3.83±0.102 3.77±0.160 4.21±0.134 0.133 S17. 2.97±0.200 4.00±0.174 3.83±0.102 3.86±0.178 3.88±0.258 0.000*
13 Source: Analysis of primary data collected by authors.
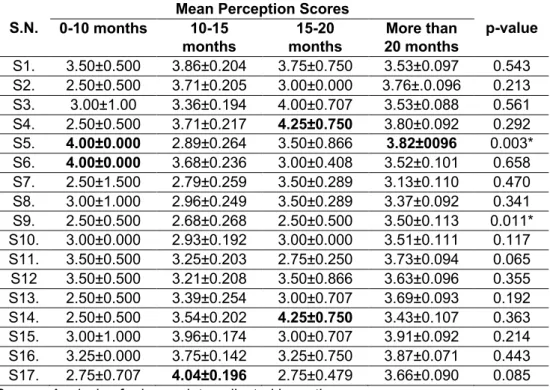
The mean perceptions cores, along with standard errors of duration of using e- banking services, are given in Table 10. It can be inferred from the table that the null hypothesis (H0: There is no significant difference between mean perception score for 17 statements with respect to four categories of duration of the usage of e-banking services) is rejected only for 2 statements. For the remaining 15 statements, there was no evidence against the null hypothesis. Therefore, it can be inferred that statements of accessibility, convenience, and security are perceived by the respondents in the same way, irrespective of their duration of usage of e-banking services.
Table 10. Mean Perception Score of the Respondents as per Duration of Using E- Banking Services
S.N.
Mean Perception Scores
p-value 0-10 months 10-15
months
15-20 months
More than 20 months
S1. 3.50±0.500 3.86±0.204 3.75±0.750 3.53±0.097 0.543 S2. 2.50±0.500 3.71±0.205 3.00±0.000 3.76±.0.096 0.213 S3. 3.00±1.00 3.36±0.194 4.00±0.707 3.53±0.088 0.561 S4. 2.50±0.500 3.71±0.217 4.25±0.750 3.80±0.092 0.292 S5. 4.00±0.000 2.89±0.264 3.50±0.866 3.82±0096 0.003*
S6. 4.00±0.000 3.68±0.236 3.00±0.408 3.52±0.101 0.658 S7. 2.50±1.500 2.79±0.259 3.50±0.289 3.13±0.110 0.470 S8. 3.00±1.000 2.96±0.249 3.50±0.289 3.37±0.092 0.341 S9. 2.50±0.500 2.68±0.268 2.50±0.500 3.50±0.113 0.011*
S10. 3.00±0.000 2.93±0.192 3.00±0.000 3.51±0.111 0.117 S11. 3.50±0.500 3.25±0.203 2.75±0.250 3.73±0.094 0.065 S12 3.50±0.500 3.21±0.208 3.50±0.866 3.63±0.096 0.355 S13. 2.50±0.500 3.39±0.254 3.00±0.707 3.69±0.093 0.192 S14. 2.50±0.500 3.54±0.202 4.25±0.750 3.43±0.107 0.363 S15. 3.00±1.000 3.96±0.174 3.00±0.707 3.91±0.092 0.214 S16. 3.25±0.000 3.75±0.142 3.25±0.750 3.87±0.071 0.443 S17. 2.75±0.707 4.04±0.196 2.75±0.479 3.66±0.090 0.085 Source: Analysis of primary data collected by authors.
4.3. Data Reduction/Factor Analysis & Regression Analysis
This section presents the results of factor analysis of 17 statements along with reliability coefficient, KMO, Bartlett test of sphericity, descriptive analysis of factors, regression analysis between customer satisfaction (dependent variable) and accessibility, convince, and security.
4.3.1. Factor Analysis
In all, 17 statements are used for factor analysis to extract factors designated as independent variables, and 3 statements relating to customer satisfaction are analyzed to extract factors designated as dependent variables. The identified factors, the rotational component matrix, and communality are given in Tables 11, 12, and 13. As evident from the results given in Table 11, the criteria for deriving latent factors was the number of fixed factors (3 in this case), not the eigenvalues (>=1). For the
14
three statements of customer satisfaction dimension, the criterion of extracting factors was eigenvalue greater than one. Since there is only one factor, the computation of rotational components matrix and communalities is not feasible. The details of variation explained by different factors are presented in Table 11 (for three factors) and Table 12 (for one factor).
Table 11. Factor Analysis-Total Variance Explained (17 Statements)
CT Initial Eigenvalues Extraction Sums of Squared
Loadings Rotation Sums of Squared Loadings
Total % of
Variance Cumulative
% Total % of
Variance Cumulative
% Total % of
Variance Cumulative
%
1 5.85 34.41 34.410 5.85 34.41 34.410 4.42 26.01 26.01
2 2.42 14.23 48.643 2.42 14.23 48.643 3.61 21.22 47.228
3 1.79 10.50 59.144 1.79 10.50 59.144 2.03 11.92 59.144
4 1.18 6.959 66.102 5 0.92 5.390 71.492 6 0.84 4.964 76.457 7 0.58 3.432 79.888 8 0.55 3.237 83.125 9 0.50 2.914 86.039 10 0.49 2.883 88.922 11 0.41 2.384 91.306 12 0.33 1.938 93.244 13 0.31 1.811 95.055 14 0.29 1.732 96.787 15 0.23 1.334 98.121 16 0.18 1.077 99.199 17 0.14 0.801 100.000
Note: Extraction Method: Principal Component Analysis., CT = Components.
Source: Analysis of primary data collected by authors.
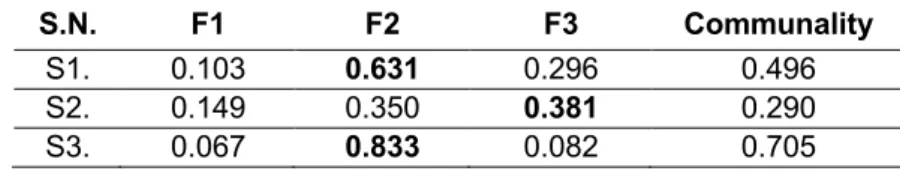
Based on VARIMAX rotation analysis and factor loading, as given in Table 13, three factors are identified. They were used to extract the factors, and the rotated component matrix was used for factor loadings and deciding on factors. These three factors are named as Accessibility, convenience, and security. The values of communalities are above the threshold level except for statement 2.
Table 12. Factor Analysis-Total Variance Explained (3 Statements)
Component Initial Eigenvalues Extraction Sums of Squared Loadings Total % of
Variance
Cumulative
% Total % of
Variance
Cumulative
%
1 1.950 65.000 65.000 1.950 65.000 65.000
2 0.624 20.801 85.801
3 0.426 14.199 100.000
Note: Extraction Method: Principal Component Analysis., CT = Components.
Source: Analysis of primary data collected by authors.
Table 13. Factor Analysis–Rotational Component Matrix and Communality
S.N. F1 F2 F3 Communality
S1. 0.103 0.631 0.296 0.496
S2. 0.149 0.350 0.381 0.290
S3. 0.067 0.833 0.082 0.705
15
S.N. F1 F2 F3 Communality
S4. -0.111 0.837 0.211 0.757
S5. 0.785 0.218 0.063 0.668
S6. 0.657 -0.117 0.123 0.460
S7. 0.624 -0.307 0.317 0.580
S8. 0.791 0.040 0.174 0.658
S9. 0.573 0.505 -0.223 0.634
S10. 0.584 0.612 -0.133 0.734
S11. 0.601 0.338 0.258 0.542
S12. 0.739 0.350 -0.011 0.668
S13. 0.732 0.178 0.110 0.579
S14. 0.285 0.684 -0.121 0.564
S15. 0.065 -0.178 0.762 0.617
S16. 0.071 0.199 0.759 0.621
S17. 0.326 0.318 0.523 0.481
Source: Analysis of primary data colelcted by authors.
4.3.2. Reliability Coefficient, KMO, Bartlett Test of Sphericity
Before beginning the process of extracting factors, several tests need to be done to determine the suitability of the sample data for exploratory factor analysis.
These are the Kaiser-Meyer-Olkin (KMO), Bartlett's Test of sphericity, and Cronbach’s alpha (reliability coefficient). Kaiser-Meyer-Olkin (KMO) is conducted to measure the suitability of sample data. At the same time, Bartlett's Test of sphericity is executed prior to extraction or factor formation to ensure the suitability of data for exploratory factor analysis. For the data set used in this study, the value of Kaiser- Meyer-Olkin (KMO) is 0.795, and Bartlett's test of Sphericity was also significant. The values of Cronbach’s alpha are greater than 0.70 for combined and individual factors.
The value of Cronbach’s alpha (reliability coefficient), Kaiser-Mayor-Olkin (KMO), the measure of sampling adequacy & chi-square value of Bartlett’s test of sphericity, and the number of statements for each factor are given in Table 14. The value of KMO suggests that the degree of common variance is middling. Bartlett’s test indicates that the sample inter-correlation matrix did not come from a population in which the inter-correlation matrix is an identity matrix. That is to say, all indexes are adequate for conducting the factor analysis.
Table 14. Reliability Coefficient, KMO, and Bartlett Test Output
Reliability Coefficient – Cronbach’s
Alpha KMO Bartlett test
0.869 (All three factors)-17 0.795 Chi-square -1417.53, DF= 136, p-value= 0.000 0.798 (Accessibility)-8 (Cause) 0.773 Chi-square – 674.11, DF = 45, p-value = 0.000 0.757(Convenience)-5 (Cause) 0.689 Chi-square - 118.880, DF =3, p-value = 0.000
0.528 (Security)-4 (Cause) 0.577 Chi-square – 95.221, DF = 6, p-value = 0.000 0.728 (Customer Satisfaction)-3 (Effect) 0.656 Chi-square – 106.56, DF = 3, p-value =0.000
Source: Analysis of primary data collected by authors.
4.3.3. Descriptive Analysis of Factors Designated as Independent and Dependent Variables
This section presents a descriptive analysis of four factors extracted as a result of factor analyses with respect to different demographics, along with p-values of testing of hypotheses. P-values are calculated using a t-test and Analysis of Variance
16
(ANOVA) depending on the number of categories of the demographic variables. The analysis is presented in Table 14.
Demographic Gender: It can be inferred from the p-values given in Table 14 that accessibility and convenience are perceived significantly different by male and female respondents. On the other hand, security and satisfaction are perceived equally important by male and female respondents.
Demographic Age: It is evident from the p-values given in Table 14 that accessibility, convenience, and security features are perceived significantly different by the respondents of five age groups, but for satisfaction level, all five groups are at par, and data did not exhibit a statistically significant difference.
Demographic Educational Qualification: It is evident from the p-values given in Table 14 that accessibility and customer satisfaction features are perceived significantly different by the respondents of five educational qualifications, but for convenience and security for all five educational qualification groups are at par, and data did not exhibit a statistically significant difference. This means respondents with higher educational levels need more improvement in e-banking services. This is also evident from the mean score values.
Demographic Monthly Income: It can be seen from the p-values given in Table 14 that accessibility, convenience, and security features are perceived significantly different by the respondents of five monthly income groups, but for the customer satisfaction factor, all five monthly income groups are at par, and data did not exhibit a statistically significant difference. It means respondents with all monthly income groups are equally satisfied and need improvement in the e-banking services for all the independent/cause factors. This is also evident from the variations in mean score values.
Demographic Duration of Using e-banking Services: It can be seen from the p-values given in Table 14 that all four dimensions, i.e., accessibility, convenience, security, and customer satisfaction, are perceived as equal by the respondents of four groups based on the duration of using the e-banking services.
The reason could be the ease of use of e-banking services during the COVID-19 era and compulsion due to lockouts, which also coincides with the data collection period.
Table 14. Mean Perception Score Values of the Respondent as per Age, Educational Qualification, Monthly Income, and Duration of Using E-Banking
Services
Demographic: Gender
Factors Female Male p-value
Accessibility 0.21±0.09 -0.16±0.11 0.017*
Convenience -0.24±0.13 0.19±0.08 0.005*
Security -0.01±0.11 0.01±0.10 0.899
Customer satisfaction
-0.07±0.11 0.06±0.11 0.414
Demographic: Age
< 25 years 26-35 years
36-45 years
46-55
years > 55 years p-value Accessibility 0.30±0.15 0.04±0.10 0.07±0.14 -0.00±0.35 -1.41±0.39 0.000*
Convenience 0.18±0.14 -0.26±0.13 0.35±0.13 0.14±0.31 0.29±0.12 0.022*
17 Security -0.43±0.18 0.04±0.10 0.24±0.20 0.36±0.37 0.34±0.29 0.024*
Customer satisfaction
0.07±0.19 0.08±0.11 -0.03±0.20 -0.61±0.39 -.036±0.17 0.304 Demographic: Educational qualification
Illiterate Upto+2 Graduate PG Prof.
degree p-value Accessibility 0.05±0.34 -0.69±0.20 0.32±0.11 0.22±0.08 -0.07±0.26 0.000*
Convenience -0.25±0.28 0.18±0.10 0.17±0.13 -0.31±0.17 -0.00±0.22 0.078 Security -0.32±0.38 0.16±0.15 -0.15±0.15 0.16±0.13 0.38±0.26 0.364 Customer
satisfaction
-0.84 ±0.56 -0.14±0.16 0.35±0.11 -0.16±0.13 -0.01±0.43 0.006*
Demographic: Monthly Income (₹/US$)
< ₹ 10,000 (US$135.25)
₹ 10,001- 20,000 (US$135.2
5-270.50)
₹20,001- 30,000
(US$
270.50- 405.75)
₹30,001- 40,000
(US$
405.75- 541)
> ₹ 40,000
(US$541) p-value
Accessibility -0.12±0.12 0.61±0.15 -0.91±0.14 0.13±0.14 -0.53±0.28 0.000*
Convenience -0.80±0.23 0.29±0.11 0.17±0.09 0.01±0.23 0.36±0.17 0.000*
Security -0.25±0.22 -0.38±0.17 0.12±0.12 0.01±0.18 0.58±0.11 0.003*
Customer satisfaction
-0.39±0.15 0.04±0.20 0.11±0.13 0.31±0.18 -0.04±0.23 0.088 Demographic: Duration of Using E-Banking Services
<10 months 10-15 months
15-20 months
>20
months p-value
Accessibility -0.07±0.32 -0.41±0.21 -0.34±0.34 0.10±0.09 0.092 Convenience -0.70±0.18 -0.06±0.17 0.21±0.61 0.02±0.09 0.738 Security -0.45±0.90 0.22±.016 -.082±0.70 -0.01±0.09 0.214 Customer
satisfaction
-0.70±0.27 0.17±0.18 -0.33±0.96 -0.01±0.09 0.533 Source:Analysis of primary data collected by authors.
4.3.3. Regression Analysis
The outputs of multiple linear regression analysis between accessibility, convenience, & security (independent variable) and customer satisfaction (dependent variable) are presented in Table 16 for three different linear regression algorithms. The result includes the regression equation, t-value, p-value of regression coefficient, coefficient of determination (Adjusted R2), and p-value of coefficient of determination.
It is evident from the values of the standardized regression coefficient that all the independent factors have a positive relation with the dependent variable. Based on the t-value and p-value, it can be inferred that all regression coefficients are statistically significantly different from zero at a 5% level of significanc