Spatial Visualization Ability Assessment for Analyzing Differences and Exploring Influencing Factors: Literature
Review with Bibliometrics and Experiment
Weizhi Yang, Chowwalit Chookhampaeng*, Jiraporn Chano**
Faculty of Education, Mahasarakham University, Thailand
*Correspondence: E-mail: [email protected]; [email protected]
A B S T R A C T A R T I C L E I N F O
Spatial ability, an essential skill in modern education, is on par with language and computing abilities. However, the definition and categorization of spatial ability are still unclear, requiring further development in assessment practices and research. The factors influencing spatial ability are still being explored, and assessments across different cultures and backgrounds need refinement. Results show a significant correlation between spatial visualization ability, gender, and major, with males and STEM majors scoring higher. Other factors, like students' prior spatial experience, did not show a significant correlation. These findings help identify and evaluate students' spatial visualization ability levels, guiding the design of spatial thinking courses and supporting differentiated teaching. The assessment also serves as a measure to track changes in students' spatial visualization ability before and after the course.
© 2024 Tim Pengembang Jurnal UPI
Article History:
Submitted/Received 12 Oct 2023 First Revised 01 Dec 2023 Accepted 22 Jan 2024
First Available online 23 Jan 2024 Publication Date 01 Apr 2024
____________________
Keyword:
Ability assessment, Analyzing differences, Exploring influencing factors, Spatial ability,
Spatial visualization ability.
Indonesian Journal of Science & Technology
Journal homepage: http://ejournal.upi.edu/index.php/ijost/
1. INTRODUCTION
The definition of spatial ability can vary in different fields and research contexts, but it typically involves the capacity to understand and process information related to space, location, and direction, as well as the ability to apply this information within specific domains.
In the field of education, spatial ability is often defined as a student's ability to understand and process information related to space(Uttal et al., 2013).
Spatial visualization ability is a cognitive skill that involves the ability to mentally manipulate and transform visual images or objects in three-dimensional space. It enables individuals to visualize and understand the spatial relationships between objects, their positions, orientations, and how they change when manipulated. In essence, spatial visualization is the mental ability to see, understand, and work with objects and spatial relationships in one's mind, without the need for physical manipulation. Although the definition and classification of spatial ability are not very clear, and the various subfactors of spatial ability are interrelated, researchers generally agree that spatial visualization ability is one of the main components of spatial ability (McGee, 1979).
Spatial ability has received widespread attention since the early 20th century because of its link to academic and professional success. Spatial ability is important for various aspects of life and cognitive functioning. The structure of human intellect can be conceptualized as consisting of three broad but correlated domains: verbal ability, numerical ability, and spatial ability (Wai et al., 2009). Eight different types of intelligence, one of which is visual-spatial intelligence, the ability to accurately perceive and represent visual space. From the perspective of the theory of multiple intelligences, a person has multiple intelligences, and each person's combination of multiple intelligences has its characteristics, showing different learning styles in human daily life.
Spatial ability plays a crucial role in creative design and scientific research. Just as Tesla described in his autobiography, he demonstrated powerful spatial ability when designing and improving engines. Einstein also mentioned that he used visual-spatial imagery, rather than verbal descriptions, in his thought processes when developing the Theory of Relativity (Newcombe, 2010). Watson and Crick's discovery of the double helix structure of DNA was also facilitated by the use of visual representations. Other examples include Kekulé proposing the structure of the benzene ring and Feynman developing quantum field theory. These instances all emphasize the critical role of spatial ability in creative work and research.
Spatial visualization ability is one of the important components of spatial ability, which has been widely considered by researchers in the fields of engineering, mathematics, chemistry, art, and design. Spatial visualization is a very important component in engineering as it is directly related to design and graphical communication (Devon et al., 1994). This ability to create mental imagery of objects and be able to manipulate them mentally is of great significance for the learning of mathematics, geometry, physics, and chemistry. Also, it is needed in the performance of professional skills such as medicine, architecture, mechanics, engineering, and design. In architectural design performance, spatial visualization ability is correlated with the acquisition, understanding, and development of three-dimensional representations of architectural graphic information (Gobert & Buckley, 2000). Moreover, spatial visualization ability and spatial orientation ability also have an impact on the extraction of high-level architectural knowledge. In the field of human-computer interaction, the difference in spatial visualization ability enables some users to query and retrieve information more effectively. This difference does not mean that users with low spatial-visual ability cannot find information, but the query speed is slower. Therefore, spatial visualization ability
is considered to be the vane of future career success for students engaged in these fields and has good predictive validity for individual growth and future achievement.
Spatial ability is important for academic, professional, and personal development. It enhances problem-solving, creativity, and adaptability in a wide range of contexts. Developing and honing spatial ability can have a positive impact on an individual's ability to navigate the world and excel in various pursuits. Francis Galton's work in the late 19th century and the subsequent development of intelligence tests (e.g., Stanford-Binet IQ test) included spatial reasoning as a component of intelligence. During World War II, aviation and military applications drove research into spatial ability, as pilots needed strong spatial skills for navigation and combat. The development of spatial aptitude tests, such as the Purdue Spatial Visualization Test, is a result of this era. The space race between the United States and the Soviet Union in the mid-20th century emphasized the importance of spatial thinking in fields like astronautics and rocket science. The development of computer graphics and video games in the late 20th century further advanced spatial thinking as players navigated and interacted with virtual three-dimensional environments.
Spatial ability tests play a significant role in education, particularly in fields that require strong spatial reasoning skills. Many STEM programs use spatial ability tests as part of their admissions process. This is because spatial skills are crucial in fields such as engineering, architecture, physics, and computer science. Educational institutions, especially at the high school and college levels, may use spatial ability tests as part of career counseling services.
Identifying students' spatial strengths and weaknesses can help guide them toward fields that align with their aptitudes and interests. Incorporating spatial ability assessments in education helps ensure that individuals entering specific fields have the cognitive skills necessary for success in their chosen professions. It also allows educators and institutions to tailor their teaching methods to support students in developing strong spatial reasoning skills. Spatial ability became a necessary component of intelligence to be measured in intelligence tests (e.g., Stanford Binet Intelligence Scale, Wechsler Intelligence Scale for Children [WISC]). Seven higher education institutions, including MTU, Penn State Behrend, Purdue University, University of Iowa, Virginia State University, Virginia Tech University, and Arizona State University launched the Enhancing Visualization Skills-Improving Options and Success (ENVISIONS) project, in which the evaluation of spatial visualization ability is one of the important contents (Veurink et al., 2009).
Even though spatial ability has been considered one critical dimension of successful performance in education, like other academic abilities, such as verbal and mathematical abilities (Shea et al., 2001; Webb et al., 2007), it has not been a focus of traditional education.
Therefore, the test of spatial ability is not as common and frequent as other tests. Spatial ability is multidimensional, and it spans across various disciplines. Defining and measuring these abilities accurately is a challenge since there are no universally accepted standards and measurement tools. Therefore, researchers and educators may choose different definitions and measurement tools based on their research objectives and backgrounds, making it crucial to select appropriate tools and measurement methods for assessing spatial ability. Existing studies have conducted spatial ability tests mainly for STEM majors. However, students' spatial ability can be influenced by cultural, social, and educational backgrounds. Individuals from different cultural backgrounds may exhibit varying levels of spatial ability. Hence, research needs to consider differences among students from different cultures and backgrounds, which may affect students' spatial ability levels and cause different differences.
The purpose of this study is to evaluate the spatial visualization ability of Chinese college students, analyze differences in spatial visualization ability, and explore the factors related to the level of spatial visualization ability.
Researchers recognize the necessity of assessing spatial ability as an identification procedure (Lohman, 2005; Naglieri & Ford, 2003) to reduce biases from differences in culture, language, and socioeconomic status. The assessment used the Revised Purdue Spatial Visualization Test: Visualization of Rotations (Revised PSVT: R) as a testing tool for students' spatial visualization ability. Due to modifications to the appropriateness of the tool, it is necessary to further evaluate whether the tool can be effectively used to identify students' spatial visualization ability levels. This study explored gender and professional differences in students' spatial visualization ability and further investigated the relationship between other factors and spatial visualization ability. Each participant's test completion time was measured to explore the association between accuracy and speed of solving spatial problems on the test.
The following research questions guided this study:
(i) Research Question 1: Does the Revised PSVT: R effectively assess students' spatial visualization ability level?
(ii) Research Question 2: How does spatial visualization ability differ by gender?
(iii) Research Question 3: What is the relationship between spatial visualization ability and students' choice of major?
(iv) Research Question 4: How do other potential factors relate to spatial visualization ability?
(v) Research Question 5: How does the speed of spatial problem-solving relate to students’
spatial performance?
Incorporating spatial ability assessments in education helps ensure that individuals entering specific fields have the cognitive skills necessary for success in their chosen professions. It also allows educators and institutions to tailor their teaching methods to support students in developing strong spatial reasoning skills. Therefore, through this study, we can understand the status quo of spatial visualization ability of Chinese college students.
Given that the study focuses on Chinese college students, it can provide insights into potential cultural influences on spatial visualization ability. Understanding these cultural factors may contribute to the development of more culturally sensitive educational interventions.
Findings from the study may have implications for educational policies, including curriculum development and resource allocation. Policy decisions informed by an understanding of spatial visualization ability can contribute to more effective and inclusive educational systems. On a concrete level, understanding the spatial visualization ability of college students can inform educators about potential challenges in teaching subjects that require strong spatial skills, such as engineering, architecture, and certain branches of science.
Tailoring instructional methods and materials to enhance spatial visualization skills may improve learning outcomes in relevant academic disciplines. In addition, the assessment of spatial visualization ability is the benchmark to measure the change in students' ability before and after.
2. LITERATURE REVIEW
2.1. Development History and Definition of Spatial Ability
The concept of spatial ability and its development can be traced through various historical periods and fields of study. Spatial ability has likely been a part of human cognition since early Homo sapiens. The historical development of spatial ability has been influenced by a wide range of factors, including technological advancements, educational needs, and shifts in
cognitive psychology and neuroscience research. In essence, research into spatial ability is multidisciplinary and has broad applications, influencing fields ranging from education and technology to design and neuroscience. Understanding its historical development provides context for its ongoing significance in contemporary research. By sorting out the historical development of spatial ability, we can better understand the importance of spatial ability to human development and explore the possible direction of spatial ability development research. Since the end of the 20th century, with the growing recognition of the importance of STEM education, spatial ability has become increasingly important in educational research (Wai et al., 2009). Spatial ability is considered to be an important part of human intelligence structure. Like speech cognition, it is a relatively independent cognitive ability in human higher cognitive activities (Mohler, 2008). Galton's research on visual representation in the 1880s is considered to be the origin of modern spatial competence research. In the past hundred years, a lot of research has been devoted to the definition of space ability and the analysis of space ability structure, but there is still no consensus on the definition of space ability. Some scholars have defined the concept of spatial ability from different disciplines or research perspectives.
Spatial ability can be defined in several ways depending on the context, such as spatial intelligence, spatial aptitude, spatial skills, spatial awareness, spatial cognition, spatial perception, spatial problem-solving, and spatial memory. Spatial ability is considered to be an important part of human intelligence structure. Like speech cognition, it is a relatively independent cognitive ability in human higher cognitive activities (Mohler, 2008). Galton's research on visual representation in the 1880s is considered to be the origin of modern spatial competence research. In the past hundred years, a lot of research has been devoted to the definition of space ability and the analysis of space ability structure, but there is still no consensus on the definition of space ability. Some scholars have defined the concept of spatial ability from different disciplines or research perspectives. The study of spatial ability has a broad interdisciplinary nature, and modern spatial ability research has been extended to various fields, including psychology, education, neuroscience, computer science, and engineering, and it has important significance in cognitive science and practical applications.
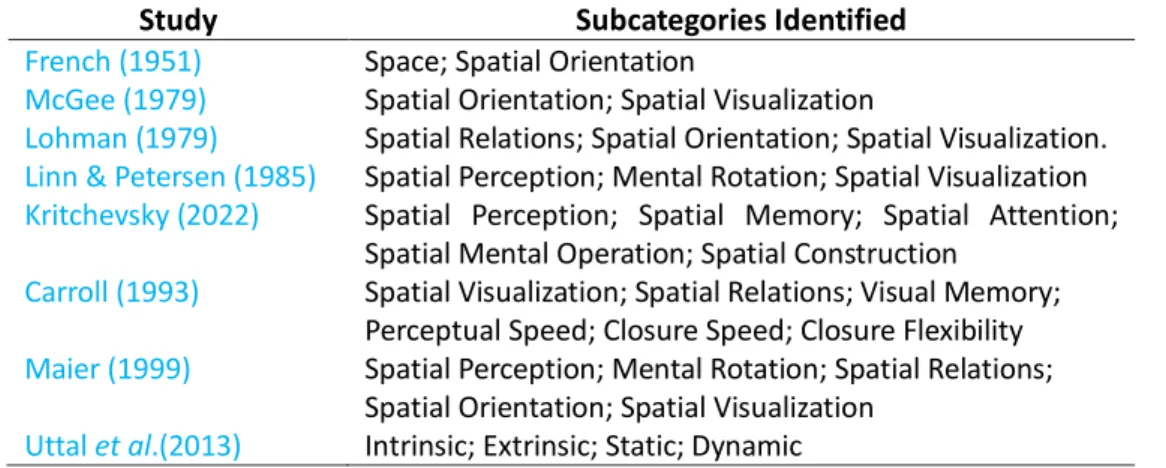
Spatial ability, as a basic cognitive ability, includes a series of basic cognitive processing processes, such as recognition, encoding, storage, representation, decomposition/combination, and abstraction/generalization of visual objects or images in the mind. In education, spatial ability is seen as a critical skill for success in STEM fields. It involves the ability to grasp and work with spatial concepts and representations. Table 1 shows typical spatial factors’ definitions by researchers frequently cited in the literature.
Table 1. Summary of spatial ability factors.
Study Subcategories Identified
French (1951) Space; Spatial Orientation
McGee (1979) Spatial Orientation; Spatial Visualization
Lohman (1979) Spatial Relations; Spatial Orientation; Spatial Visualization.
Linn & Petersen (1985) Spatial Perception; Mental Rotation; Spatial Visualization Kritchevsky (2022) Spatial Perception; Spatial Memory; Spatial Attention;
Spatial Mental Operation; Spatial Construction
Carroll (1993) Spatial Visualization; Spatial Relations; Visual Memory;
Perceptual Speed; Closure Speed; Closure Flexibility Maier (1999) Spatial Perception; Mental Rotation; Spatial Relations;
Spatial Orientation; Spatial Visualization Uttal et al.(2013) Intrinsic; Extrinsic; Static; Dynamic
2.2. Spatial Visualization Ability and Spatial Ability
Based on the definition of spatial ability, many researchers believe that spatial ability is composed of multiple elements rather than a single ability. Subsequent studies have found the diversity of spatial cognitive processing ability and have attempted to decompose spatial ability into a series of meaningful spatial factors (Guilford, 1956; Heyden et al., 2017;
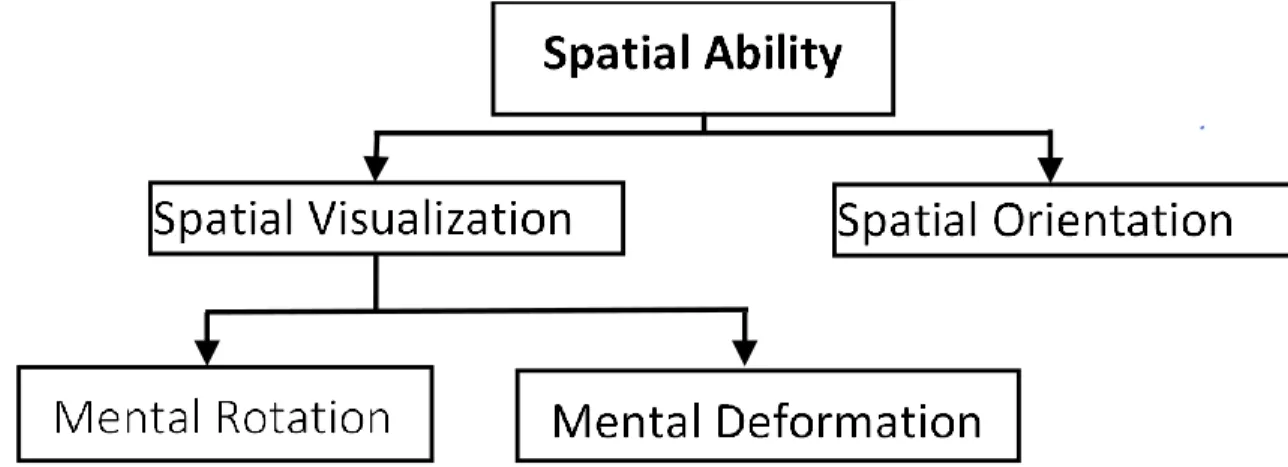
Lehmann et al., 2014; Linn & Petersen, 1985; Wang & Carr, 2014). Based on the research of McGee (1979) and based on the perspective of mental processes, Tartre (1990) proposed a classification structure of spatial ability, as shown in Figure 1. This mental processing is considered to be used when performing specified tasks. Tartre believed that spatial ability contains two clear components: spatial visualization and spatial orientation. The spatial visualization component involves mentally moving objects, and the spatial orientation component involves the individual's ability to mentally move one's perspective while the object remains fixed in space. Tartre also pointed out that the spatial visualization component can be subdivided into mental rotation and mental distortion. Mental rotation means that an object is completely rotated and deformed in space; while mental deformation means that only part of the object is deformed in some way. Many researchers classify the mental rotation of two-dimensional and three-dimensional stimuli as spatial orientation or spatial relationship, while Tartre regards mental rotation as a component of spatial vision, which is because the stimulus is moved mentally.
Figure 1. Tartre’s spatial capability classification structure (Tartre, 1990).
2.3. Difference of Spatial Visualization Ability and Related Factors
There are differences in spatial ability among people, and there are also differences in spatial ability among individuals in different situations (such as at different ages). The difference in spatial ability in people or individuals is caused by many reasons, influenced by many factors, and is the result of the interaction of many factors. Exploring the factors and manifestations of differences in spatial ability can better understand the true level of a person's spatial ability, and further explore possible countermeasures and means to improve spatial ability, such as optimizing training and education methods.
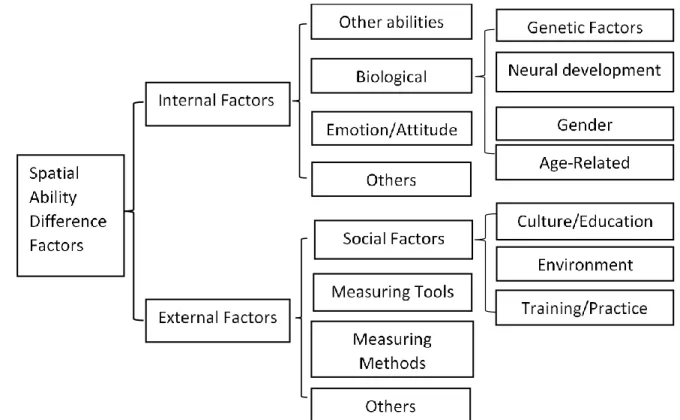
Based on literature research, the factors that cause differences in spatial ability are divided into two categories: internal factors and external factors as shown in Figure 2. The two types of factors separate or interact to cause the difference in spatial ability. Internal factors are caused by the different characteristics of the individual itself. External factors are differences in spatial ability caused or manifested by external factors. Internal differences include biological factors, other abilities (Froiland & Davison, 2020), emotion/attitude (Cooke- Simpson & Voyer, 2007; Lennon-Maslin et al., 2023; Moè, 2009). External factors include
social factors, measuring tools, and measuring methods (Maeda & Yoon, 2012; Peters, 2005).
“Others” is used in the figure because there may be other factors that influence spatial ability that are not explored or understood. Biological factors include genetic factors (Hausmann et al., 2000; Thomas & Kail, 1991), neurological development (Hao et al., 2016; Li et al., 2019), gender differences, and age differences (Yan et al., 2023). Social factors include environmental factors (Quaiser-Pohl et al., 2006; Sharobeam, 2016), culture and education (Tian et al., 2022), training and practice.
Gender differences are a well-studied area of psychology, with gender differences in spatial ability receiving much attention, and most research supports greater spatial ability in males (Lauer et al., 2019; Lee et al.,2019; Patkin & Dayan, 2013). Multiple meta-analyses of various tests of spatial ability have found that mental rotation is widely recognized as the cognitive ability with the greatest gender differences (Hyde & Linn, 1989; Linn & Petersen, 1985; Voyer et al., 1995). However, Bartlett & Camba (2023) argue that the construct of ‘spatial ability’
itself has been co-constructed with gender, and thus has not been devised in a neutral way, but in a manner that is influenced by gender beliefs. Spatial ability has been emphasized in masculinized disciplines, while the role that spatial ability plays in feminized disciplines like garment construction, sewing, ceramics, interior design, domestic jobs, nursing, sonography, etc. has been largely ignored. However, due to the uncertainty of the definition and classification of spatial ability, there is still no better tool to accurately measure individual spatial ability. Therefore, gender difference is still introduced in this study, but more attention is paid to social factors, such as the background and experience of the research subjects in the pre-test and demographic survey.
Figure 2. Factors of difference in spatial ability.
2.4. Measurement of Spatial Visualization Ability
The development of spatial ability measurement has been paralleled by the development of spatial ability research. The measurement of spatial ability is to assess an individual's ability in spatial cognition and processing through a series of psychometric tools and tasks. These
measurement tools are commonly used by psychologists, cognitive scientists, and educational researchers to understand an individual's level of spatial ability. Some common spatial ability measurement methods and tools include spatial ability tests, map reading tasks, three- dimensional puzzle tasks, plane geometry tasks, visual-spatial working memory tasks, task questionnaires and self-reports, neuroimaging studies, etc. Tests of spatial ability are tools used to assess an individual's ability to process spatial information, spatial perception, and spatial reasoning. Some common spatial ability tests include the Mental Rotations Test (MRT);
Vandenberg MRT; Raven's Progressive Matrices; Block Design Test; Water Level Task; Virtual Reality Tests; Map Reading Tests; and Plane Geometry Tests. These measurement methods or testing tools can be used individually or in combination to assess an individual's spatial ability level according to the purpose of the study and the needs of the researcher.
Visualization tests included more complex, multi-step components, and several correct answers. These test methods included the Heinrich Spatial Visualization Test (HSVT), Purdue Spatial Visualization Test (PSVT), Purdue Spatial Visualization Test-Visualization of Rotation (PSVT-R), Purdue Visualization of Rotations Test (ROT). Abbreviated versions of these tests were also available (Muffato et al., 2017).
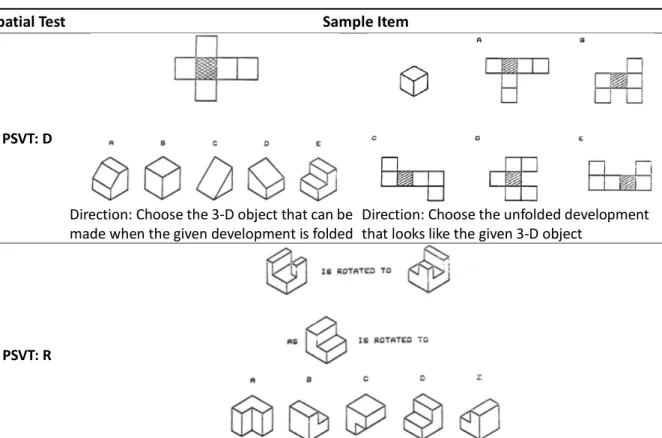
Guay originally developed the Purdue Spatial Visualization Test, consisting of three different subtests entitled “Developments,” “Rotations,” and “Views,” which contains a total of 36 items, 12 from each subtest (as shown in Table 2)
). Each subtest of the PSVT also had an independent extended version of 30 items entitled the Purdue Spatial Visualization Tests: Visualization of Developments (PSVT: D), Visualization of Rotations (PSVT: R), and Visualization of Views (PSVT: V). Among the three extended versions of the PSVT, the PSVT: R is a 20-minute test for individuals aged 13 or older used to measure spatial visualization ability in 3-D mental rotation.
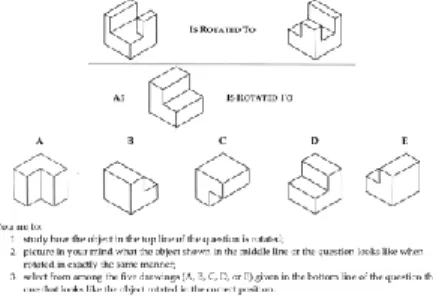
The PSVT: R has 2 practice items followed by 30 test items which consist of 13 symmetrical and 17 asymmetrical figures of 3-D objects, which are drawn in a 2-D isometric format. All the figures contain shapes of cubes or cylinders with varied truncated slots. (see Figure 3 for an example) The items are ordered to be progressively more difficult, based on the rotated angles and axes. In each item, respondents are shown a figure and its rotated figure for an example of rotation and asked to find another figure’s match as rotated in the same way as the example. The five given choices are rotated in different directions and shown at different angles.
Since its development by Guay at 1976, the PSVT: R has been used primarily in the research of educational settings in the science, technology, engineering, and mathematics (STEM) disciplines. The PSVT: R has been one of the most popular tests in engineering education to measure students’ spatial visualization ability of mental rotation (Contero et al., 2005). This is because, compared to other popular spatial tests including the Mental Cutting Test (MCT), Mental Rotations Test (MRT), Revised Minnesota Paper Form Board Test (RMPFBT), and Differential Aptitude Tests: Spatial Relations (DAT:SR), for research in engineering education, the PSVT: R is unique in that 3-D objects in the test have inclined, oblique, and curved surfaces, which are more demanding to visualize than simple surfaces consisting of cubes as used in other tests.
Due to concerns about inconsistent usage of PSVT: R and the discovery of bugs in PSVT: R, and team members modified PSVT: R and formed the Revised PSVT: R. The Revised PSVT: R is the spatial ability testing tool used in this study.
Table 2. Sample items from the purdue spatial visualization tests.
Spatial Test Sample Item
PSVT: D
Direction: Choose the 3-D object that can be made when the given development is folded
Direction: Choose the unfolded development that looks like the given 3-D object
PSVT: R
Direction: Choose the object that has the same rotation as shown in the topline
PSVT: V
Direction: Choose the object as seen from the viewing position
Figure 3. Time trend of the publications on PSVT: R.
2.5. Bibliometrics Analysis of PSVT: R
Discovering and analyzing a significant amount of scientific data is an accurate technique known as bibliometric analysis (Donthu et al., 2021). Previous studies on bibliometrics are shown in Table 3. Detailed information for the use of bibliometric is explained elsewhere (Azizah et al., 2021; Al Husaeni & Nandiyanto, 2022).
The study encompassed 126 articles from Scopus (the deadline is 2023), originating from 26 countries and involving 254 authors from 230 organizations. The number of papers has steadily increased, peaking in 2019. Despite a slight decline in the following years, there is evidence of a rebound, indicating sustained interest and application of PSVT: R. Keyword co- occurrence analysis indicates that prominent clusters in the research focus on keywords such as "Spatial Visualization," "STEM," and "Engineering Graphics," reflecting sustained interest in spatial abilities in STEM education. The increasing emphasis on "Virtual Reality" and
"Training Programs" suggests a shift towards immersive technology and innovative training methods.
The analysis provides a comprehensive understanding of the global landscape, collaborative networks, influential authors, and key research themes in the field of applied research using PSVT. Table 4 shows some previous studies on PSVT: R.. Through the bibliometric analysis of literature on the application of PSVT: R, it can effectively guide the subsequent development and implementation of this study.
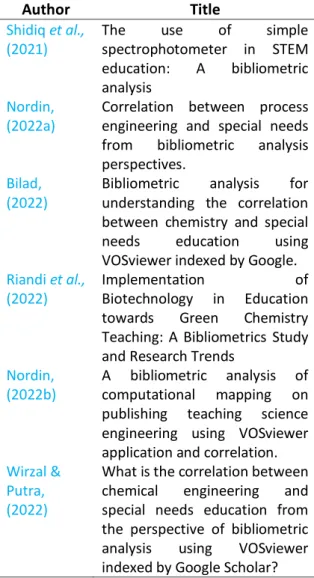
Table 3. Previous studies on bibliometric.
Author Title Result
Shidiq et al., (2021)
The use of simple
spectrophotometer in STEM education: A bibliometric analysis
The study, which made use of the VOSviewer program, found that modified spectrophotometers are frequently used in chemistry and STEM teaching, providing prospects for future research.
Nordin, (2022a)
Correlation between process engineering and special needs from bibliometric analysis perspectives.
VOSviewer, a process engineering tool for mapping analysis, experienced a decrease in publications on
"process engineering special demands" between 2017 and 2021.
Bilad, (2022)
Bibliometric analysis for understanding the correlation between chemistry and special needs education using VOSviewer indexed by Google.
An analysis of articles on chemistry and special education using VOSviewer and Publish or Perish showed a decline in publications in 2017 and a rise in 2021.
Riandi et al., (2022)
Implementation of
Biotechnology in Education towards Green Chemistry Teaching: A Bibliometrics Study and Research Trends
With journals being the most prevalent source, the study bibliometric analysis of research trends on biotechnology in education revealed four study concept potentials, underscoring the significance of teaching green chemistry in schools.
Nordin, (2022b)
A bibliometric analysis of computational mapping on publishing teaching science engineering using VOSviewer application and correlation.
A study that examined teaching, science, and engineering research using the VOSviewer and Perish applications found a significant drop because of pandemic conditions.
Wirzal &
Putra, (2022)
What is the correlation between chemical engineering and special needs education from the perspective of bibliometric analysis using VOSviewer indexed by Google Scholar?
Utilizing the VOSviewer software, a research study on the relationship between chemical engineering and special needs examined 800 pertinent papers between 2018 and 2022.
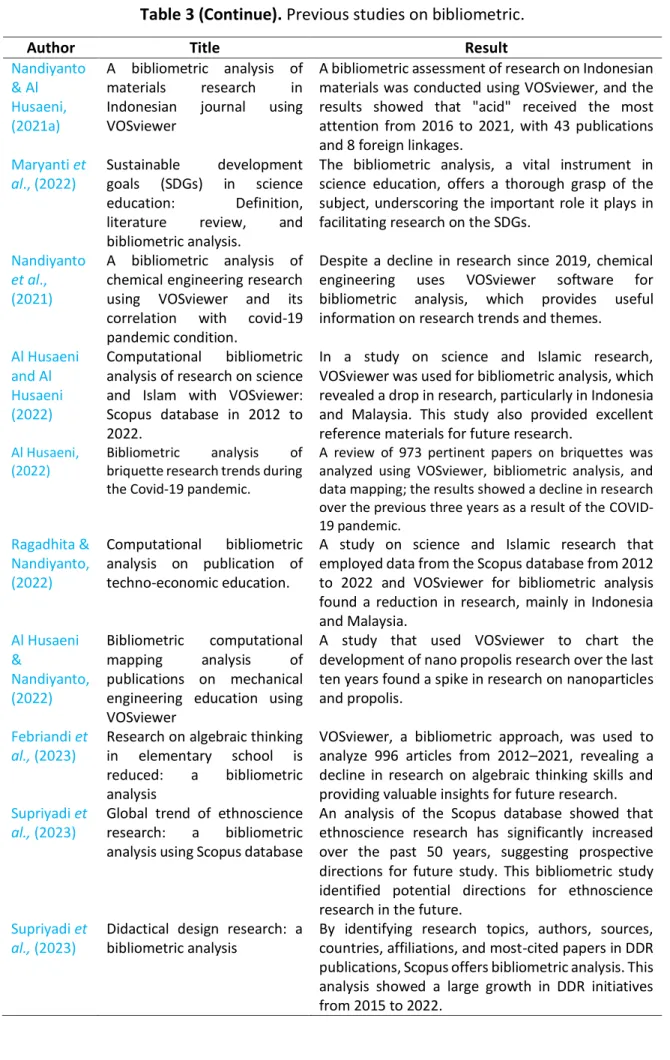
Table 3 (Continue). Previous studies on bibliometric.
Author Title Result
Nandiyanto
& Al Husaeni, (2021a)
A bibliometric analysis of materials research in Indonesian journal using VOSviewer
A bibliometric assessment of research on Indonesian materials was conducted using VOSviewer, and the results showed that "acid" received the most attention from 2016 to 2021, with 43 publications and 8 foreign linkages.
Maryanti et al., (2022)
Sustainable development goals (SDGs) in science education: Definition, literature review, and bibliometric analysis.
The bibliometric analysis, a vital instrument in science education, offers a thorough grasp of the subject, underscoring the important role it plays in facilitating research on the SDGs.
Nandiyanto et al., (2021)
A bibliometric analysis of chemical engineering research using VOSviewer and its correlation with covid-19 pandemic condition.
Despite a decline in research since 2019, chemical engineering uses VOSviewer software for bibliometric analysis, which provides useful information on research trends and themes.
Al Husaeni and Al Husaeni (2022)
Computational bibliometric analysis of research on science and Islam with VOSviewer:
Scopus database in 2012 to 2022.
In a study on science and Islamic research, VOSviewer was used for bibliometric analysis, which revealed a drop in research, particularly in Indonesia and Malaysia. This study also provided excellent reference materials for future research.
Al Husaeni, (2022)
Bibliometric analysis of briquette research trends during the Covid-19 pandemic.
A review of 973 pertinent papers on briquettes was analyzed using VOSviewer, bibliometric analysis, and data mapping; the results showed a decline in research over the previous three years as a result of the COVID- 19 pandemic.
Ragadhita &
Nandiyanto, (2022)
Computational bibliometric analysis on publication of techno-economic education.
A study on science and Islamic research that employed data from the Scopus database from 2012 to 2022 and VOSviewer for bibliometric analysis found a reduction in research, mainly in Indonesia and Malaysia.
Al Husaeni
&
Nandiyanto, (2022)
Bibliometric computational mapping analysis of publications on mechanical engineering education using VOSviewer
A study that used VOSviewer to chart the development of nano propolis research over the last ten years found a spike in research on nanoparticles and propolis.
Febriandi et al., (2023)
Research on algebraic thinking in elementary school is reduced: a bibliometric analysis
VOSviewer, a bibliometric approach, was used to analyze 996 articles from 2012–2021, revealing a decline in research on algebraic thinking skills and providing valuable insights for future research.
Supriyadi et al., (2023)
Global trend of ethnoscience research: a bibliometric analysis using Scopus database
An analysis of the Scopus database showed that ethnoscience research has significantly increased over the past 50 years, suggesting prospective directions for future study. This bibliometric study identified potential directions for ethnoscience research in the future.
Supriyadi et al., (2023)
Didactical design research: a bibliometric analysis
By identifying research topics, authors, sources, countries, affiliations, and most-cited papers in DDR publications, Scopus offers bibliometric analysis. This analysis showed a large growth in DDR initiatives from 2015 to 2022.
Table 3 (Continue). Previous studies on bibliometric.
Author Title Result
Nandiyanto et al., (2023a)
Particulate matter emission from combustion and non- combustion automotive engine process: review and computational bibliometric analysis on its source, sizes, and health and lung impact
This study discusses the growth trend of scientific publications on the topic of particulate matter identified based on several categories such as the most cited, publisher, author, country, and affiliation.
Kolakoti et al., (2023)
Enhancing heat transfer performance of automotive car radiator using camphor nanoparticles: experimental study with bibliometric analysis
In this study, an attempt was made to investigate the heat transfer performance of a four-wheeler automotive radiator using a novel coolant system.
Nandiyanto et al., (2023b)
Involving Particle Technology in Computational Fluid Dynamics Research: A Bibliometric Analysis
This research was conducted to determine (i) the growth in the number of scientific publications in the field of particle technology in computational fluid dynamics (CFD), (ii) top citations based on the number of citations, publisher, and country, (iii) visualization of the most productive author, and (iv) publication development map based on keywords.
Ramdhani et al., (2023)
A comprehensive study on biochar production, bibliometric analysis, and collaborative teaching practicum for sustainable development goals (SDGs) in Islamic schools
This research endeavors to assess the impact of additional practicum sessions and experimental demonstrations through video presentations on students' comprehension in an Islamic boarding school. The study focuses on enhancing students' understanding of the biochar concept, particularly its role as an adsorbent, aligning with contemporary issues related to the Sustainable Development Goals (SDGs) and environmental problem-solving.
Suherman et al., (2023)
How to Improve Student Understanding in Learning Science by Regulating Strategy in Language Education? Definition, Factors for Enhancing Students
Comprehension, and
Computational Bibliometric Review Analysis
This study aims to explain language education development research for improving student comprehension in learning science. This study also reviews the definition of these strategies, identifies factors that contribute to improving students' comprehension, and conducts a computational bibliometric review analysis.
Al Husaeni et al., (2022)
How Language and Technology Can Improve Student Learning Quality in Engineering?
Definition, Factors for Enhancing Students Comprehension, and Computational Bibliometric Analysis
The research aims to review developments in language and technology research that can improve the quality of teaching and learning in engineering.
Several factors that can influence the teaching and learning process are explained, supported by a bibliometric analysis (with keywords “Language”
AND “Engineering Learning” from Google Scholar from 2020 to 2022).
Fauziah et al., (2022)
Strategies in Language Education to Improve Science Student Understanding during Practicum in Laboratory: Review and Computational Bibliometric Analysis
This study aims to explain the development of language research in science learning which can improve students' understanding during practicums in the laboratory. This research also explores the factors that contribute to increasing student understanding and bibliometric analysis using the keywords "language", "practicum", "laboratory" and
"science" from 2015 to 2021.
Table 3 (Continue). Previous studies on bibliometric.
Author Title Result
Nandiyanto et al., (2023c)
Bibliometric data analysis of research on resin-based brakepads from 2012 to 2021 using VOSviewer mapping analysis computations
This study aims to analyze and demonstrate step-by- step bibliometric data analysis using VOSViewer completely and systematically. The analysis was carried out with the number of publications obtained, relating to the predetermined topics totaling 88 documents in 2017-2021.
Ruzmetov &
Ibragimov, (2023)
Past, current and future trends of salicylic acid and its derivatives: A bibliometric review of papers from the Scopus database published from 2000 to 2021
Theoretical and practical interest in salicylic acid and its derivatives has increased over the last two decades, and with it, academic study in the field has been burgeoning. Most scientometric studies have only focused on a specific property of the topic compounds. None, however, are discussed in the origination progress and prospects of SA and its derivatives. The present study makes a bibliometric review of 2010 papers published during 2000-2021 which were indexed by Scopus in the sub-discipline of salicylic and salicylates.
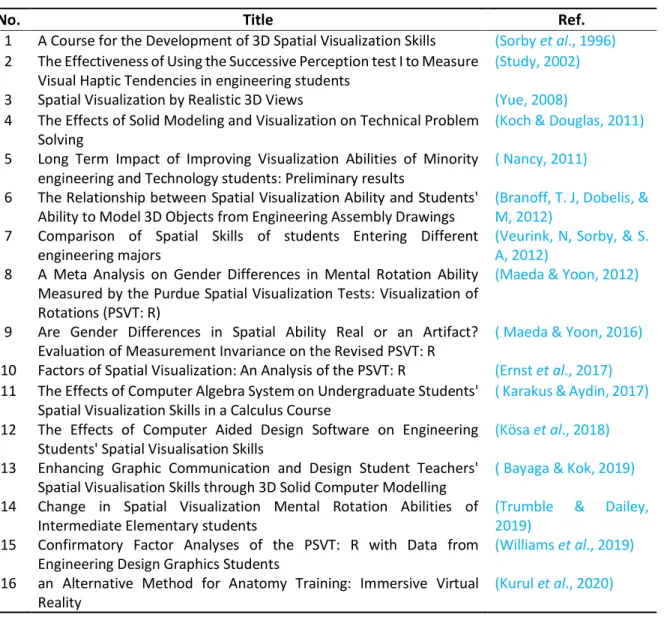
Table 4. Previous studies on PSVT: R.
No. Title Ref.
1 A Course for the Development of 3D Spatial Visualization Skills (Sorby et al., 1996) 2 The Effectiveness of Using the Successive Perception test I to Measure
Visual Haptic Tendencies in engineering students
(Study, 2002)
3 Spatial Visualization by Realistic 3D Views (Yue, 2008) 4 The Effects of Solid Modeling and Visualization on Technical Problem
Solving
(Koch & Douglas, 2011) 5 Long Term Impact of Improving Visualization Abilities of Minority
engineering and Technology students: Preliminary results
( Nancy, 2011) 6 The Relationship between Spatial Visualization Ability and Students'
Ability to Model 3D Objects from Engineering Assembly Drawings
(Branoff, T. J, Dobelis, &
M, 2012) 7 Comparison of Spatial Skills of students Entering Different
engineering majors
(Veurink, N, Sorby, & S.
A, 2012) 8 A Meta Analysis on Gender Differences in Mental Rotation Ability
Measured by the Purdue Spatial Visualization Tests: Visualization of Rotations (PSVT: R)
(Maeda & Yoon, 2012)
9 Are Gender Differences in Spatial Ability Real or an Artifact?
Evaluation of Measurement Invariance on the Revised PSVT: R
( Maeda & Yoon, 2016)
10 Factors of Spatial Visualization: An Analysis of the PSVT: R (Ernst et al., 2017) 11 The Effects of Computer Algebra System on Undergraduate Students'
Spatial Visualization Skills in a Calculus Course
( Karakus & Aydin, 2017) 12 The Effects of Computer Aided Design Software on Engineering
Students' Spatial Visualisation Skills
(Kösa et al., 2018) 13 Enhancing Graphic Communication and Design Student Teachers'
Spatial Visualisation Skills through 3D Solid Computer Modelling
( Bayaga & Kok, 2019) 14 Change in Spatial Visualization Mental Rotation Abilities of
Intermediate Elementary students
(Trumble & Dailey, 2019)
15 Confirmatory Factor Analyses of the PSVT: R with Data from Engineering Design Graphics Students
(Williams et al., 2019) 16 an Alternative Method for Anatomy Training: Immersive Virtual
Reality
(Kurul et al., 2020)
Table 4 (Continue). Previous studies on PSVT: R.
No. Title Ref.
17 Assessing the Impact of Dynamic Software Environments (MATLAB) on Rural Based Pre-Service Teachers' Spatial Visualisation Skills
(Amevor et al., 2021) 18 Neural Efficiency and Spatial Task Difficulty: A Road Forward to
Mapping Students' Neural Engagement in Spatial Cognition
(Snowden et al., 2021) 19 An Exploration of Augmented Reality in an Introductory engineering
graphics Course
(Thornton et al., 2021)
3. TOOLS AND METHODS 3.1. Instrument
Students’ spatial visualization ability was measured by the Revised PSVT: R. The Revised PSVT: R showed good internal consistency reliability, Cronbach’s α = .84 with data from approximately 2,400 first-year engineering students and construct validity of one- dimensional factor structure (Maeda & Yoon, 2012) and measurement invariance across gender (Maeda & Yoon, 2016). It is an instrument to measure spatial visualization ability in the 3D mental rotation of individuals aged 13 and over. The psychometric instrument has 2 practice items followed by 30 test items that consist of 13 symmetrical and 17 asymmetrical figures of 3-D objects, which are drawn in a 2-D isometric format. In the revised version, figures are rescaled and items are reordered from easy to difficult under the framework of item response theory (IRT). All the figures contain shapes of cubes or cylinders with varied truncated slots (e.g., see Figure 4). In each item, respondents need to find a figure with the same rotation of the question figure as shown in a given pair of example figures, among five choices, which are rotated in different directions and shown at different angles.
Figure 4. A sample item from the Revised PSVT: R.
3.2. Sample
The target population for this study was undergraduate students from Jiaying University.
Jiaying University is a full-time public undergraduate university in Guangdong Province with a history of one hundred years of normal education. The university now has nearly 30,000 full- time students, covering 11 disciplines including literature, science, engineering, law, and medicine.
The course "3D Modelling and Printing" is a public elective course at the university. The public elective courses of the whole school are offered by teachers themselves and uploaded to the teaching system of the school after being approved by the school. Students can choose corresponding courses on the network to complete the credit requirements of their studies.
If the number of students for elective courses is reached (generally at least 30), the public elective courses of the whole school can start. The course is worth 2 credits. This course starts once a week, with 2 class hours and a total of 1.5 hours. Each course lasts for one semester, with a total of 16 weeks and a total of 24 hours.
Between the Fall 2022 and Spring 2023 semesters, A total of 108 students chose this course. They and some of their classmates participated in the test. This study received a total of 186 tests. However, data from students whose tests were invalid and students with missing key demographic information used for the exclusion criteria of this study were excluded. In total, 181 students were included in the data analysis.
3.3. Procedures
The data were collected using an online survey (Chinese Version) by ‘WenJuanXing’. It was used to collect demographic information (such as gender, major, and ranking in the class during the comprehensive test last semester or academic year). At the same time, students were asked to identify the following:
(i) Leader: During your university years, did you often serve as a student cadre?
(ii) Sport: How often have you played sports?
(iii) Drafting: How often have you engaged in drafting, design, and design sketching, engineering graphics, or other manual (by hand) technical drawing activities?
(iv) E-game: How often have you played electronic games?
(v) Art: How often have you engaged in creating artwork (drawing, graphic design, painting, 3D art, photography, etc.)?
(vi) Handwork: How often have you fixed things, such as working on a car, home improvements, construction, carpentry, electronics, or other similar activities?
These questions were arranged using Likert scales for data collection (Yosef S. Allam, 2009).
The responses to these questions were quantified into a continuous rather than categorical Experience score, where each of the ten questions represents an integer value of 1 through 5, ranging from “Never” to “Always”, respectively.
After completing the initial survey, the participants were asked to complete the Revised PSVT: R. In each question, an object was pictured in one position, then shown in a second image, rotated to a different position. Participants were shown a second object and given five choices, one matching the rotation of the example object. They were asked to select the object that showed the same rotation as the example for that question.
Participants were informed that they had as much time as they wanted to complete the test. After the entire test is completed, the system will automatically record and display the time spent by each participant.
3.4. Data Analysis
IBM-SPSS Statistics (version 26) was used for data analysis. During descriptive data analysis, the demographic information was used to check sample characteristics and reviewed for outlier identification. Although previous literature has shown that Revised PSVT: R has good reliability and validity, it is necessary to reanalyze the test due to differences in language and cultural backgrounds. The test results must conform to the normal distribution, which is the basis for subsequent analysis. The statistical methods for this study included independent samples t-tests and analyses of variance (ANOVA, MANVOA) to test mean differences between/among groups for research questions. If the difference is significant, the effect size will be calculated. For independent sample t-tests, calculate the value of Cohen's d here.
4. RESULTS
4.1. Descriptive Statistics
First, data from all subjects were considered for the reliability analysis. The Revised PSVT:
R appeared to have good internal consistency (Cronbach’s α= 0.909, N= 181). KMO and
Bartlett's Test showed good construct validity (Kaiser-Meyer-Olkin Measure of Sampling Adequacy=0.880, Bartlett's Test of Sphericity Sig.=0.000).
Descriptive statistics of score and time are presented in Table 5. The mean score of the 181 participants on the Revised PSVT: R was 18.98 with a standard deviation of 7.32. A total of 61.9% of participants scored above mean. The students’ scores ranged from 3 to 30 and 4 students (2.21% of participants) achieved a perfect score of 30. The test time reported by 181 participants ranged from 45 to 8325 seconds with a mean of 1292. The test completion times of 4 perfect scorers ranged between 1177 and 3307 seconds with a mean of 2096 seconds.
Although the values of skewness and kurtosis show that the distribution of time and score does not conform to normality, the histograms (as shown in Figures 5 and 6) that show a normal curve show that they conform to the distribution of a “bell-shaped curve “. Therefore, in many cases, it can still be detected by a normal distribution function.
Participants’ demographic profiles are presented in Table 6. Descriptive statistics, such as means and standard deviations on the Revised PSVT: R and the test completion time, are presented by participants’ characteristics, such as gender, academic major, etc.
Table 5. Descriptive statistics of score and time.
Figure 5. Histograms of time with the normal curve.
Figure 6. Histograms of the score with a normal curve.
DV N Min Max Mean Std. D Skewness (Std. E) Kurtosis (Std. E) Time 181 45 8325 1292.14 983.82 2.58 0.18 14.75 0.36 Score 181 3 30 18.98 7.32 -0.51 0.18 -0.82 0.36
Table 6. Students’ performance by score and completion time on the revised PSVT: R.
Variables Grouping Count Time Score
Mean Std.D Mean Std.D
Gender Male 111 1117.71 600.33 20.11 7.25
Female 70 1568.73 1350.51 17.20 7.13
Major STEM 127 1258.96 741.07 19.95 7.06
Non-STEM 54 1370.17 1404.56 16.70 7.49
Ranking Last20% 18 1104.11 710.60 18.50 8.49
60%-80% 28 1175.61 819.22 18.46 7.24
40%-60% 41 1382.98 1285.60 19.07 6.87
20%-40% 42 1481.36 1030.26 19.64 6.06
Top20% 52 1195.52 823.01 18.83 8.38
Leader Never 57 1102.56 610.86 20.02 7.47
Rarely 33 1789.97 1601.56 18.67 6.88
Occasionally 53 1323.74 857.85 19.04 7.33
Frequently 21 962.29 784.31 15.43 7.54
Always 17 1270.35 711.69 20.35 6.72
Sport Never 2 781.50 378.30 18.00 0.00
Rarely 20 1299.40 1197.45 19.00 7.20
Occasionally 84 1352.33 1132.88 19.12 7.58
Frequently 47 1171.09 588.91 19.45 6.71
Always 28 1346.04 918.17 17.86 8.09
Drafting Never 34 1068.76 636.59 18.18 7.84
Rarely 46 1270.26 862.00 19.24 7.38
Occasionally 66 1360.86 1147.59 19.27 6.78
Frequently 20 1590.95 1176.59 21.05 7.28
Always 15 1164.73 904.26 16.00 8.11
E-game Never 9 1817.00 838.75 18.56 5.77
Rarely 26 1151.04 933.69 16.62 7.63
Occasionally 63 1235.13 760.88 19.90 6.96
Frequently 54 1449.76 1307.46 19.94 7.05
Always 29 1086.10 720.40 17.45 8.39
Art Never 35 1041.77 680.80 17.97 7.76
Rarely 52 1264.56 877.59 19.00 7.41
Occasionally 57 1433.35 1187.68 19.25 6.74
Frequently 22 1376.95 1077.61 21.55 7.96
Always 15 1310.93 936.32 16.53 6.81
Handwork Never 35 1079.57 716.96 18.17 8.08
Rarely 63 1227.27 794.07 18.79 7.17
Occasionally 66 1521.14 1247.95 20.61 6.60
Frequently 9 1333.22 895.91 16.89 8.42
Always 8 797.50 623.52 13.00 6.78
4.2. Correlation Analysis
Table 7 shows intercorrelations among the measures: The Revised PSVT: R score, test completion time, gender, major, leader, rank, sport, drafting, e-game, art, and handwork.
Here the correlation coefficients were Spearman. Overall, the correlations among the observed variables ranged from -0.32 to 0.69 and variance inflation factors as collinearity diagnostics ranged from 1.06 to 2.52, indicating no concerns about multicollinearity. The correlations of the Revised PSVT: R score with test completion time, gender, and major were statistically significant at the p<0.01 level (2-tailed), with Spearman rho correlation coefficient, ρr=0.57, -0.21, and -0.20 respectively. The correlations between time and gender
were statistically significant at p<0.05 level (2-tailed), with Spearman rho correlation coefficient, ρr=0.16.
Table 7. Correlations among the Revised PSVT: R and other demographic information.
Variables 1 2 3 4 5 6 7 8 9 10 11
1. Time -- 0.57a 0.16b -0.04 0.01 0.04 0.03 0.08 -0.05 0.12 0.08 2. Score -- -0.21a -0.20a -0.10 0.04 -0.03 0.01 0.05 0.05 0.00 3. Gender -- 0.13 0.25a 0.26a -0.03 0.26a -0.32a 0.18b 0.13
4. Major -- 0.13 -0.08 0.04 0.10 0.06 0.22a 0.09
5. Leader -- 0.28a 0.09 0.24a -0.16b 0.29a 0.22a
6. Rank -- 0.12 0.13 -0.30a 0.01 -0.02
7. Sport -- 0.13 -0.05 0.01 0.07
8. Drafting -- -0.17b 0.69a 0.56a
9. E-game -- -0.04 -0.05
10. Art -- 0.62a
11. Handwork --
Note: a. Correlation is significant at the 0.01 level (2-tailed); b. Correlation is significant at the 0.05 level (2-tailed).
4.3. MANOVA Analysis
Because of the correlation matrix (see Table 7) among the four variables (Time and Score, Gender, and Major), a two-way MANOVA was conducted to examine the unique effect of each variable by partially out the effect of the other variables. In Box's Test of Equality of Covariance Matrices for output results, p<0.001, indicates that the variance covariance matrix is not equal, so Pillai's Trace is used here. The interaction of gender and major had no statistically significant effect on the dependent variables (score and time), with F=1.525, p=0.22, Pillai’s Trace=0.017, partial η2=0.017. The tests of between-subjects effects are shown in Table 8. Multivariate analysis of variance shows gender was statistically significant for both score and time; Major was statistically significant for scores, but not for time.
Through the independent sample t-test after grouping, it was found that only among STEM major students, the gender difference in time is statistically significant, with t (61.37) =-2.03, p=0.046. In terms of time, male students (M=1149.40, SD=588.47) outperformed female students (M=1465.64, SD=939.13) with a mean difference of -316.24, and the Levene’s test F=19.46, p<0.01.
Table 8. Results of two-way MANOVA.
IV DV Multivariate Testsa Tests of Between-Subjects Effects
Value F Sig. df F Sig.
Gender Time
0.17 17.907b 0.00 1.00 10.63 0.00
Score 1.00 5.19 0.02
Major Time
0.06 5.799b 0.00 1.00 0.23 0.63
Score 1.00 6.27 0.01
Gender * Major Time
0.02 1.525b 0.22 1.00 1.61 0.21
Score 1.00 0.07 0.79
a. Design: Intercept + Gender + Major + Gender * Major b. Exact statistic
4.4. Gender and Major Difference
For gender and academic major, they belong to two categorical variables. The score and time were compared by independent sample t-tests. The results are shown in Table 9.
In terms of score, male students (M=20.11, SD=7.25) outperformed female students (M=17.20, SD=7.13) with the mean difference of 2.91 on the Revised PSVT: R, with t (179)