of the GABA transporter, GAT1
Thesis by
Princess Izevbua Ikhianosen Uerenikhosen Imoukhuede
In Partial Fulfillment of the Requirements for the Degree of
Doctor of Philosophy
California Institute of Technology Pasadena, California
2008
(Defended February 8, 2008)
©2008
Princess Izevbua Ikhianosen Uerenikhosen Imoukhuede All Rights Reserved
ACKNOWLEDGEMENTS
I would like to thank Henry Lester for being a great mentor and scientific advisor.
I’ve learned so much from you. I appreciate the intellectual freedom you’ve given me over my work. I would also like to thank you for fostering a collaborative, diverse, and intellectually stirring lab environment through which I have learned and grown
tremendously as a scientist. As I move forward in my career, I can only hope to live up the example you have set of scientific rigor, ethical leadership and compassionate mentoring.
I would like to thank my committee. First, my collaborator Robert Chow; it has been an honor to work with you at USC, and to learn from both you and Darren Michael.
Our collaboration opened a new area of science to me, which I have been able to share with others. Your thoughtful comments on my work have given focus of my studies and have helped to mold me into an excellent scientist.
I’d like to thank Professor Fraser, from whom I first learned optical principles.
Through him I met the microscopy czars Mary Dickinson and Chris Waters both of whom I must thank for helping me troubleshoot experiments. In addition to serving on my committee, I’d like to thank Professor Fraser for being an advocate for social progress.
I’d like to thank Professor Yang who helped to unify my understanding of microscopy. Through his courses, I learned the mathematical principles governing optics. I appreciate greatly your taking the time to explain concepts to me, discuss topics in microscopy, offer scientific and career advice, and serve on my committee.
I would like to thank ALL the members of the Lester lab. EACH of you has had a significant impact on my graduate training! I would especially like to thank the
members of the 10AM, sometimes 9AM, fluorescence and transporter clubs. You folks have kept me on my toes with challenging questions and rousing scientific discussions. I would especially like to thank Fraser Moss and Joanna Jankowsky. Everything I know about experimental biology, I’ve learned from you! Thanks for your patience, thanks for your advice, and thanks for your support! I am also grateful to Raad Nashmi and Rigo Pantoja for your help and guidance. I’d like to offer lots of thanks to Purnima
Deshpande, Eloisa Imel, and Kathleen Hamilton; you’ve each been so kind to me and you’ve looked out for me throughout my time here. Finally, I’d like to thank Bruce Cohen, Ryan Drenan, Herwig Just, Cagdas Son, and Sheri McKinney for your support.
I must thank my church communities: All Saints Episcopal Church in Pasadena, CA and the Church of the Holy Family in Park Forest, IL. First, I’ll give a special shout- out to the clergy, who despite ministering to thousands, still send prayers my way. I’d like to thank my Indaba peeps for stimulating theological discussion, for being so
accepting and culturally sensitive, and for being true friends when I’ve really needed you!
I’d also like to offer thanksgiving to the Canterbury Choir and music director. I’ll forever remember my time with you, lifting our voices in joyous praise to God.
I would also like to thank Andrew Medina-Marino, Holly Beale, Dennice Gayme, Tara Gomez, Tosin Otitoju, and Tashica Williams for your support throughout grad school. When I think back to the fun times and positive interactions, you’re the folks that come to mind. Your sincerity, kindness, and good naturedness have made Caltech a more welcoming environment for me and others.
I truly appreciate the encouragement and advice of my mentors, Dr. Paula Hammond, Dr. Linda Griffith, Dr. Erica O’Neal, Dr. Elaine Bearer, Dr. Heather Pinkett, and Dean Blanche Staton.
I would especially like to express my gratitude to Brandi Jones, Janice Black, Candice Rypsi, C.L., and Milton Mitchell. From my first day on campus until now, you have each made me feel welcome, offered much needed advice, provided resources, and done so much to help me negotiate a very demanding environment. Thank you.
Finally, I would like thank my family. It’s absolutely impossible to list everything they’ve done. If I did, this section would be longer than the body of my thesis. But I will mention a few highlights. Since leaving for boarding school at 15, my dad has had an open door policy. Anytime I felt like coming home, day or night he’d pick me up, no questions asked. Similarly, anytime I’ve needed to call him: 2AM, 4AM, 6AM….he’s always answered. Good news, bad news, he’s the first to hear. Having my dad’s unconditional love and support has been a tremendous comfort and blessing in every step of my journey. Therefore, I want to thank him so much for always being there for me.
Next, I’d like to thank my mom. Her patient words and guidance have calmed my fears. She has infused me with hope and optimism when things have seemed to go
horribly wrong. She has inspired me in countless ways. I am immensely grateful for all that she’s done for me. It would be no less fitting than to thank my mom’s clone:
Mommy Odion (thanks to one is thanks to both). You’ve supported me when I’ve been home-sick, nervous, tired, hungry, happy, excited, joyful, and even when I couldn’t
walk. I sincerely thank you for your prayers, I thank you for your love, and I thank you for your support.
And of course, I reserve a heap of thanks to my most learned and esteemed comrade, Big Brother Chief! Yours is by far the hardest acknowledgement to write, because you’ve encouraged me in so many ways! When I think to how you’ve supported me through Caltech, I remember all the emails and essays you proofread, pep-talks you’ve given me, the non-billable legal/academic/social/political advice you’ve offered.
I also remember the times you’ve encouraged me to sleep in, relax, or just have fun. All your advice and support has made me better off today than I was two days ago. So I must say that, I’m much obliged, much obliged!
Altogether, I thank God for such a loving family, and it is with great humility that I dedicate this thesis to you. Without your support, I would not be one of the first
African-American women to earn an engineering doctorate from Caltech.
ABSTRACT
Transporter trafficking regulators can play an important role in maintaining the transporter density necessary for effective function. I determine interactions that confine GAT1 at the membrane by
investigating GAT1 lateral mobility through fluorescence recovery after photobleaching (FRAP). I find that the mobility of GAT1 can be increased by depolymerizing actin or by blocking the GAT1 PDZ interacting domain. I also identify ezrin as the GAT1 adaptor to actin. Through fluorescence resonance energy transfer (FRET), the distance between GAT1-YFP and Ezrin-CFP is calculated as 64--68 Å, and it can be significantly increased by disrupting the actin cytoskeleton. Altogether, my data reveals that actin confines GAT1 to the plasma membrane via ezrin, an interaction mediated through the GAT1-PDZ interaction domain.
Discoveries in the field of vesicle fusion provide direct ties to translational research. While the study of vesicle fusion classically has been applied to neurotransmitter and neuropeptide containing vesicles; there is evidence that secretory vesicles physiologically differ from vesicles trafficking membrane protein. For instance, GAT1 resides on a vesicle lacking neurotransmitter but containing some v-SNARE proteins. These differences in the vesicle composition suggest inherent differences in trafficking
mechanisms, which can only be confirmed through further study of membrane protein trafficking. To this end, I apply total internal reflection fluorescence microscopy (TIRFM) to quantify the number of GAT1 molecules on vesicles and to observe the movement of vesicles containing fluorescently tagged GAT1 into the plasma membrane. I determine that these vesicles contain 3--7 molecules of GAT1 and uncover a population of GAT1 vesicles with ATP-dependent lateral displacement.
The protein-protein interactions, trafficking, and oligomerization of mouse GAT1 were studied using fourteen different fusions of mGAT1 with fluorescent protein. We determine that a natural PDZ- interacting motif is minimally required for wild-type GAT1 behavior. Fusions with wild-type function yielded up to 21% FRET efficiency, indicating efficient GAT1 oligomerization. Additionally, 45% FRET was observed between a GAT1 construct and YFP-syntaxin-1A. Inserting XFP between R565 and L566, resulted in 33% FRET but impaired function, which indicated the “RL” motif in the proximal C-terminus governs export from the endoplasmic reticulum but not transporter oligomerization.
TABLE OF CONTENTS
Chapter 1: Introduction ... 1
Background ... 2
Applying Fluorescence Microscopy to the Study of GAT1 ... 14
Summary of Thesis ... 22
References ... 24
Chapter 2: Ezrin mediates tethering of the γ-aminobutyric acid transporter, GAT1, to actin filaments via a C-terminal PDZ domain ... 31
Results ... 33
Discussion ... 35
Materials and Methods ... 37
Acknowledgements ... 39
References ... 39
Figure Legends... 43
Chapter 3: Total internal reflection fluorescence microscopy and single molecule analysis reveal GAT1 vesicle kinematics and number of GAT1s per vesicle ... 57
Introduction ... 58
Materials and Methods ... 59
Results ... 63
Discussion ... 67
References ... 70
Figure Legends... 75
Chapter 4: Fluorescent mGAT1 constructs reveal motifs important for correct trafficking and dimerization... 85
Abstract ... 87
Introduction ... 88
Experimental Procedures ... 90
Results ... 96
Discussion ... 107
References ... 116
Figure Legends... 141
Table ... 144
Appendix I: GABA transporters: Structure, oligomerization, trafficking, and pharmacology determine neuronal excitability ... 150
Synopsis ... 152
Physiological Roles of the GABA transporters ... 153
Classification and Differential CNS Expression of GABA Transporters ... 154
Structure, Function and Regulation of GABA Transporters ... 157
Pharmacology --- Modulation of the GABA Transporter by Antiepileptics ... 166
Further readings ... 168
Figure Legends... 170
Suggested Cross-References ... 173
Appendix II: Biophysical properties of neuronal nicotinic acetylcholine receptors ... 177
Chapter 1: Introduction
This chapter contains three sections. The first section gives an overview of what is known about GAT1 function, subtypes in the brain, structure, trafficking, and ties to epilepsy. The second section describes the optical approaches used to study the GABA transporter. The chapter concludes with a summary of the subsequent chapters of the thesis.
Background
GAT1 Function
Synapses help translate information in order for us to learn, recall, think, and exhibit emotion. Every action is governed by synaptic networks. Many neurological and psychiatric disorders stem from problems with chemical and/or electrical signal
transmission at the synapse. Hence several drugs used to treat these conditions target synaptic transporters and receptors. For example, the antiseizure drug, carbamazapine, binds to the postsynaptic GABAA receptor, resulting in modulations in chloride
conduction. Even drugs prescribed for treatment of depression, anxiety, and attention deficit hyperactivity disorder (also known as “ADHD”) block synaptic transporters---the serotonin and norepinephrine transporters to be exact. Therefore any insight gained into the structure of synapses can result in significant improvements in clinical medicine and human health.
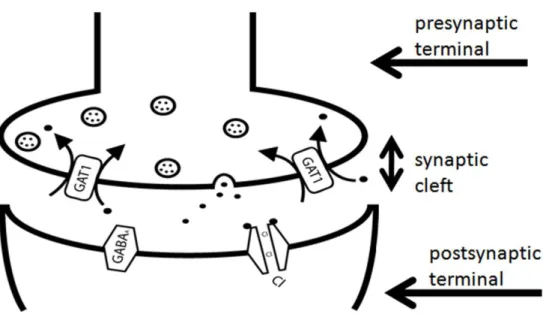
A study of the synapse typically focuses on the proteins that facilitate and regulate synaptic transmission. Figure 1 displays a representative synapse. Synaptic transmission occurs when vesicles containing neurotransmitter fuse with the presynaptic membrane, thereby releasing neurotransmitter into the synaptic cleft. The neurotransmitter diffuses throughout the synapse and binds to a postsynaptic ion channel, resulting in channel opening. The opening of an ion channel allows ions to move through the channel pore.
Hence, synaptic transmission involves the conversion of a chemical signal into an electrical signal. Synaptic transmission is terminated by the action of neurotransmitter transporters which pump neurotransmitter from the synaptic cleft back into the
presynaptic neuron. Figure 2 displays the process of synaptic transmission, where the
neurotransmitter is GABA; the postsynaptic ion channel is the GABAA receptor; the ion permeating the channel pore is chloride; and the neurotransmitter transporter is the GABA transporter, GAT1.
Figure 1. The image shows fusion of GABA-containing vesicles with the plasma
membrane. The binding of GABA to a GABAA receptor results in the opening of receptor and the movement of chloride ions through the pore of the receptor. This process of inhibitory synaptic transmission is terminated by the transport of GABA from the synaptic cleft into the presynaptic terminal via the action of GAT1. This process is considered inhibitory, because chloride ions are negatively charged, and upon entering the postsynaptic terminalmthey decrease in the membrane voltage (hyperpolarization), thereby inhibiting neuronal excitation.
The GABA transporter, GAT1 is the focus of the studies in this thesis. It is a member of the solute carrier 6 (SLC6) family of transporters. Included in this family are the norepinephrine transporter (NE), serotonin transporter (SERT), dopamine transporter (DAT), and GABA transporters (GAT) (1). In addition to terminating synaptic
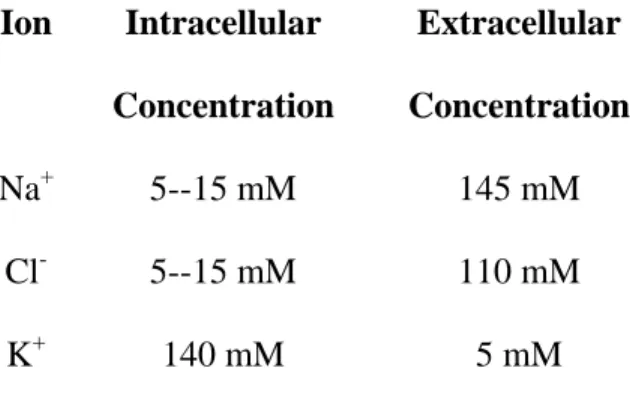
transmission, these transporters are also involved in maintaininga low neurotransmitter concentration throughout the brain and preventing excessive activation of synaptic receptors (2, 3). The removal of neurotransmitter from the synapse requires energy, which is harnessed from the difference in intracellular and extracellular ion
concentrations. Table 1 specifies the intracellular and extracellular concentrations of Na+, Cl-, and K+.
Table 1. Intracellular and extracellular ion concentrations adapted from Alberts (4) Ion Intracellular
Concentration
Extracellular Concentration
Na+ 5--15 mM 145 mM
Cl- 5--15 mM 110 mM
K+ 140 mM 5 mM
Since ions move from regions of high concentration to low concentration, the difference in ion concentration (concentration gradient) can be used to drive the movement of molecules that cannot diffuse across the plasma membrane into the neuron. GAT1 applies this principle by transporting GABA into the neuron through co-transport of 2 Na+ and 1 Cl- down their concentration gradients.
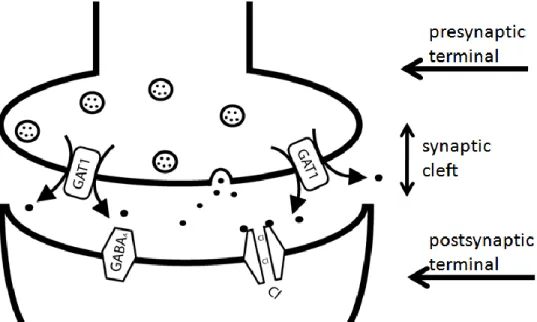
It must be noted that GAT1 can also reverse, transporting GABA out of the neuron either under depolarizing conditions (increased plasma membrane voltage) or due to a significant increase in intracellular Na+ or Cl- concentrations. Figure 3 displays GAT1 transport reversal. Drugs that raise the intracellular concentration of Na+ (for
example, glutamate) can also cause transport reversal. Studies of GAT reversal have been performed in a range of model systems including: toad and catfish retina, human hippocampus, rat brain synaptosomes, mouse cerebral cortex, human embryonic kidney cells, and Xenopus oocytes (frog eggs) (5, 6). Wu and Richerson have found that physiologically relevant increases in extracellular K+ concentration (11--17 mM) can induce transport reversal in rat hippocampus (7). Transport reversal is believed to have great importance during high-frequency neuronal excitation. It is thought that transporter reversal and vesicular release of GABA work in tandem to inhibit neuronal firing.
Figure 2. GAT1 can reverse transport under certain conditions, including: depolarizing conditions or upon significant increase in the sodium or chloride concentrations in the presynaptic terminal. Therefore, rather than transporting GABA into the presynaptic terminal, GAT1 can transport GABA into the synapse.
GABA Transporter Subtypes and Distribution
There are four known subtypes of the GABA transporter: GAT1, GAT2, GAT3, and BGT1. GAT1 is the predominant GAT in the central nervous system (CNS).
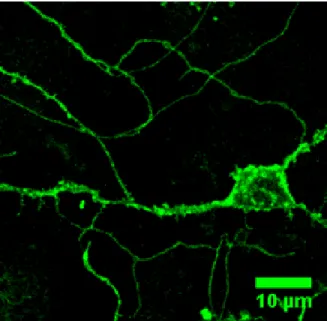
Through in situ hybridization, immunocytochemistry, and fluorescence microscopy it has been found that GAT1 is found in high concentration in the cerebellum, hippocampus, and thalamic reticular nucleus (8). GAT1 is expressed in astrocytes but primarily on axons and presynaptic terminals (boutons) of GABAergic inhibitory neurons. Figure 3 displays the localization of GAT1 in such a neuron. This image was acquired from the cerebellum of a pre-natal mouse (E18) expressing a fusion of GAT1 to the green fluorescent protein (GFP).
Figure 3.GAT1 localization in a neuron. This image shows the localization of the GABA transporter, GAT1, in a neuron and its processes. The localization of GAT1 is visualized through emission of a green fluorescent protein (GFP) molecule fused to GAT1. The image represents primary cultures from the cerebellum of pre-natal (E18) mice expressing GAT1-GFP after 14 days of culture.
GAT3 is also specific to the central nervous system, being preferentially located on astrocytes and found in the olfactory bulb, cerebral cortex, thalamus, hippocampus, superior and inferior colliculus, substantia nigra, cerebellum, and brain stem (9-11).
GAT3 is believed to be developmentally regulated, being found in higher concentrations in the brains of post-natal mice versus adult animals (12). Both GAT2 and BGT1 are preferentially found on astrocytes (non-neuronal support cells) in the CNS, and they are also found in the liver and the kidney (10, 11). BGT1 is distinct from the other
transporters, because it can transport sodium, chloride, and GABA in ratios of 3:2:1 or 3:1:1 (13), in contrast to the previously described GAT ratio of 2 Na+ to 1 Cl- to 1 GABA. BGT1 is also distinct because its role in the kidney and liver is to maintain the intracellular osmotic balance under hypertonic conditions (under increased extracellular solute concentrations), by transporting the osmolyte, betaine (13, 14). Despite the fact that it can also transport betaine, BGT1 actually has a higher affinity for GABA than for betaine. Given the role that BGT1 plays in maintaining osmolarity in peripheral tissues, it is believed that both BGT1 and GAT2 play a similar role of maintaining the osmotic balance within the CNS (1, 9).
GAT1 Structure
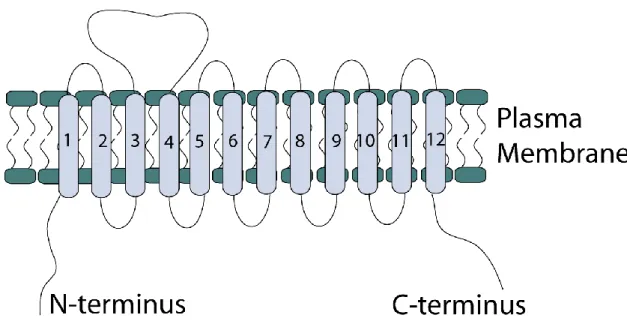
GAT1 contains twelve transmembrane (TM) domains with both the amino and carboxy termini located intracellularly (15). Figure 4 displays a schematic of the transporter. The membrane topology of GAT1 had been predicted through hydropathy plots and N-linked glycosylation scanning mutagenesis (16). Another distinguishing characteristic of GAT1 is a large extracellular loop between TM 3--4 that contains three N-glycosylation sites. Structurally, the SLC6 transporters form oligomers. This
hypothesis has been supported by fluorescence resonance energy transfer (FRET) studies with GAT, SERT, and DAT (17-19).
Figure 4. Schematic diagram of GAT1 membrane topology. GAT1 contains 12
transmembrane domains numbered from left to right with both the N-terminus and the C- terminus found in the cytosol. Although the figure is not drawn to scale, the transporter does contain a large second extracellular loop.
In 2005, the crystal structure of the leucine transporter was solved to a 1.65 Å resolution (20). The leucine transporter is bacterial in origin and shares 20--25%
sequence identity to the transporters of the SLC6 family; hence, it is considered a homologue of SLC6 transporters. The X-ray crystal structure showed 12 TM domains;
thereby confirming the predicted membrane topology. The structure also confirmed that the transporter formed homodimers and determined that the dimerization interface was just following TM12. Prior to the crystal structure it was believed that transporter oligomerization was driven by a series of four repeated leucines (leucine heptad repeat) found within the TM2 (17-19). Although the dimerization interface has now been confirmed to follow TM12, the previous work points to TM2 as a region significant to transporter structure and trafficking.
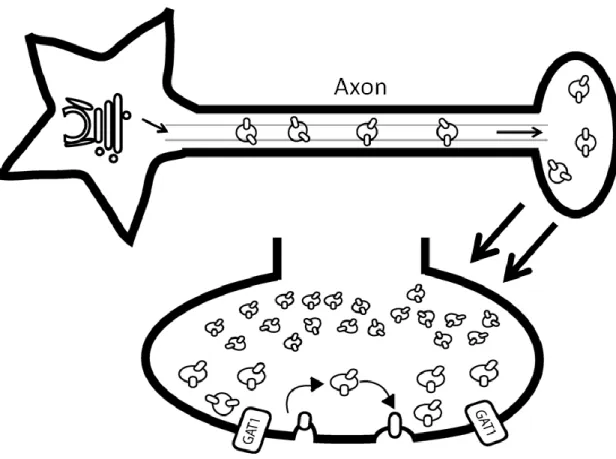
Figure 5. Schematic of GAT1 vesicle trafficking. GAT1 trafficking involves the movement of vesicles containing GAT1 from the Golgi along the axon and into the presynaptic terminal. Although there is no change in GAT1 vesicle size at the presynaptic terminal, the size difference seen in the schematic is used to differentiate the two different GAT1 vesicle populations. The first pool of vesicles, represented by the larger vesicles, is termed the readily releasable pool. These vesicles actively insert GAT1 into the plasma membrane through the process of exocytosis and remove GAT1 from the plasma
membrane through the process of endocytosis, as indicated by the arrows. The second pool is termed the reserve pool; they are represented by the smaller vesicles in the schematic. As the name suggests, these vesicles are not actively involved in vesicle fusion, and they comprise a majority of the GAT1vesicle population, accounting for 70%
of GAT1 vesicles.
GAT1 Trafficking
GAT1 trafficking refers to the steps from GAT1 translation and processing in the endoplasmic reticulum (ER) and Golgi apparatus to GAT1 arrival on the plasma
membrane. It also includes the retrieval of GAT1 from the membrane through the process of endocytosis and the recycling of GAT1 back to the membrane. Figure 5 displays the movement of vesicles containing the transporter from the Golgi, along the axon, and finally arriving at the presynaptic terminal where the GAT1 vesicles fuse to place GAT1 on the plasma membrane. Many of the steps depicted in the schematic are regulated; therefore, what follows describes the protein interactions and GAT1 structural elements that control GAT1 trafficking.
The first steps in GAT1 trafficking involves export from the ER. This step requires oligomerization of GAT1. GAT1 mutants that are unable to oligomerize are therefore retained in the ER. Additionally, GAT1 ER export and subsequent movement through the Golgi occurs through the action of COPII-coated vesicles, requiring the interaction between the RL motif on the GAT1 C-terminus (amino acids 566 & 567) and the COPII vesicle component, Sec24D (21, 22). In contrast, a transporter with a mutated RL sequence is retained in the ER.
Once the transporter has met the necessary conditions for ER and Golgi export, the vesicle containing GAT1 is translocated to the plasma membrane by traversing microtubules along the axon to finally arrive at the presynaptic plasma membrane (Figure 5). Here, it is stationed either in a readily releasable pool (RRP) of vesicles, which actively inserts the transporter into the plasma membrane at a rate of 1.1 min-1, or it is part of the reserve pool of vesicles, which represents 70% of the total GAT1 pool (23).
As the name implies, this pool does not actively traffic GAT1 onto the membrane;
however, if its role mirrors that the role of the synaptic vesicle reserve pool, then it can be recruited for vesicle fusion upon depletion of the RRP.
Vesicle fusion involves the interaction of vesicle SNARES (V-SNARES) with tethering SNARES (T-SNARES) on the plasma membrane. The vesicle that traffics the transporter to the plasma membrane contains the V-SNARE, VAMP. Additionally, it contains rab3A, a G-protein that aids exocytosis; rab11, a GTPase involved in vesicle recycling; and Syntaxin 1A, a T-SNARE that mediates vesicle fusion when on the plasma membrane (24). This vesicle does not contain vGAT; therefore it is distinct from the synaptic vesicle that contains GABA. It also does not contain synaptotagmin, which is the calcium sensor on neurotransmitter-containing vesicles (synaptic vesicles) that prompts vesicle fusion, nor does it contain synaptophysin, which is another marker of synaptic vesicles (24, 25).
The fusion of the GAT1 vesicle to the plasma membrane requires the interaction of the last 3 amino acids of GAT1 (alanine, tyrosine, and isoleucine) termed the
postsynaptic density 95/Discs large/Zona occludens1 (PDZ) interacting motif, with a PDZ protein. The mutation, truncation, or disruption of this motif results in impaired GAT1 trafficking, with 70% of the GAT1 that should be on the plasma membrane remaining in GAT1 vesicles (8). Other proteins that increase GAT1 membrane
localization include protein kinase C (PKC) (26-28), syntaxin 1A (29, 30), and tyrosine kinases (31, 32).
Once GAT1 has been delivered to the plasma membrane, it can also be retrieved from the plasma membrane through the process of endocytosis. The average GAT1 internalization rate is 0.7 min-1 (23). As previously mentioned, tyrosine kinases increase
the exocytosis of GAT1; likewise, reduced phosphorylation of GAT1 by tyrosine phosphatases or by the inhibition of tyrosine kinase activity increases the GAT1
internalization rate (31, 32). This increase in GAT1 internalization by extension reduces the number of GAT1s that can transport GABA (33), thereby reducing GAT1 transport activity (31).
GAT1 and Epilepsy: Current Therapeutic Approaches
GABA is the main inhibitory neurotransmitter in the CNS and when released into the synaptic cleft, it binds to GABAA, GABAB, and GABAC receptors (GABA binding to GABAA receptors is shown in Figure 1). The binding of GABA to GABAA receptors in mature neurons results in the opening of the receptor and the movement of chloride ions through the receptor pore. This movement of negative charge is defined as an inhibitory postsynaptic current, and it hyperpolarizes the cell; thereby reducing the ability of the neuron to fire excitatory currents (34). Therefore, when GAT1 removes GABA from the synaptic cleft it terminates inhibitory signaling. Since epilepsy is defined by abnormal neuronal excitation, drugs that target and inhibit GAT1 function should prolong neuron inhibition, thus serving as potent antiepileptics.
Tiagabine is currently the only FDA-approved drug that blocks GAT1. Its side effects include: tremor, ataxia, dizziness, nervousness, sedation, and asthemia (3). In order to determine whether these side effects are related to the block of GAT1 and not due to non-specific tiagabine interactions, complete knockout of the GAT1 gene was studied in a mouse. The GAT1 knockout mouse neither changes the expression pattern of the major proteins involved in GABA transmission in the cerebellum nor in the hippocampus. However, rotorad behavioral tests show that the mice exhibit loss of
muscular coordination (ataxia). Additionally, open-field and exploratory cage tests reveal mouse anxiety and nervousness. Tremor measurements show that the knockout mice exhibit constant 25--32 Hz tremor in their limbs and tails. Electrophysiology performed on brain slices from the knockout mice, show an increased GABAA receptor- mediated tonic conductance in both cerebellar granule and Purkinje cells, a slower decay of spontaneous inhibitory postsynaptic currents in cerebellar granule cells. These results all indicate that knockout of GAT1 increases the extracellular GABA concentration.
GAT1 knockout also produces behavioral and physiological effects that are similar to the side effects of tiagabine treatment. This indicates that the tiagabine side effects are actually due to the blocking of the transporter, rather than from interactions with
unintended targets. In turn, this shows that a drug that exclusively blocks GAT1 may not be the most advantageous therapeutic agent, if tremor, ataxia, nervousness, and anxiety are to be avoided.
Since the GAT1 knockout resulted in pronounced behavioral and physiological effects, an alternative treatment approach is necessary, which can confer fewer adverse drug effects. One such approach would target one or more of the less predominant neuronal GABA transporters such as BGT1 (11, 35). This has been tested with the anticonvulsant EF1502, which non-competitively blocks both GAT1 and BGT1. EF1502 blocks GAT1 at lower levels than tiagabine with IC50s for EF1502 and tiagabine of 4 µM and 0.8 µM, respectively, and it blocks BGT1 at higher levels than tiagabine with IC50s for EF1502 and tiagabine of 22 µM and 300 µM, respectively (36). Additionally, EF1502 has a significant effect on partial seizures as probed with animal seizure models (35). These promising findings represent a new approach to the treatment of epilepsy.
In addition to the insight gained from the knockout mouse and EF,1502, research into transport reversal has gained a spotlight into the treatment of epilepsy. The
importance of transport reversal in the treatment of epilepsy is supported by recent work which finds that two anticonvulsants, gabapentin and vigabatrin enhance GAT transport reversal (6). Additionally, in temporal lobe epilepsy (TLE) there is a decrease in
transporter number (probed by 3H-nipecotic acid binding in rat hippocampus); such a decrease would reduce the contribution of transporter reversal on seizure inhibition. TLE is also characterized by a decrease in glutamate-induced transport reversal (probed by human microdialysis probes of GABA concentration); since seizures are marked by elevated glutamate concentrations, a reduction in GAT ability to reverse in this state would again reduce the contribution of transporter reversal on seizure inhibition (6).
Altogether, the drugs that target and treat epilepsy can function on a number of GAT1 processes. Consequently, continued research into GAT1 protein interactions and structure may lead to the discovery of additional therapeutics targeting GAT1 function.
Applying Fluorescence Microscopy to the Study of GAT1
Studying GAT1 Vesicle Trafficking with Total Internal Reflection Fluorescence Microscopy
Discoveries in the field of vesicle fusion provide direct ties to translational research. Studies of exocytosis have led to an understanding of the role of insulin secretion in type 2 diabetes (37) and to determining the mechanism of action of the antiepileptic drug levetiracetam (Keppra), which binds to the synaptic vesicle protein SV2A (38). The foci of exocytosis studies have been to sensitively measure the time- scale, protein recruitment, and regulation of each step in vesicle trafficking. Vesicle fusion events have been visualized using the vesicular stomatitis virusglycoprotein (39).
The kinetics of docking and fusion has been established through the use of
proteoliposomes containing vesicle fusion proteins (SNARES) (40). Although the
SNARE proteins are well studied, only recently has fluorescence imaging been applied to understand the formation of the SNARE complex in fusion events (41).
To this end, I use total internal reflection fluorescence microscopy (TIRF) to study the dynamics of the GAT1 vesicle. TIRF is a powerful technique, because it offers a better optical slice than confocal microscopy (~100 nm vs. ~500 nm). The fiber optic cables used by the telecommunications industry also apply the principle of TIRF. The laws of reflection and refraction establish that when light travels from one medium into another, a portion may be reflected back into the starting medium and a portion may be transmitted into the second medium. The index of refraction, (n), gives the ratio of the speed of light in a vacuum to the speed of light in a medium. Snell’s law gives the relationship between indices of refraction of the mediums through which light travels (n1, n2), the angle of incidence of the light (1), and the angle of refraction of the light (2) (42):
2 2 1
1sin n sin
n .
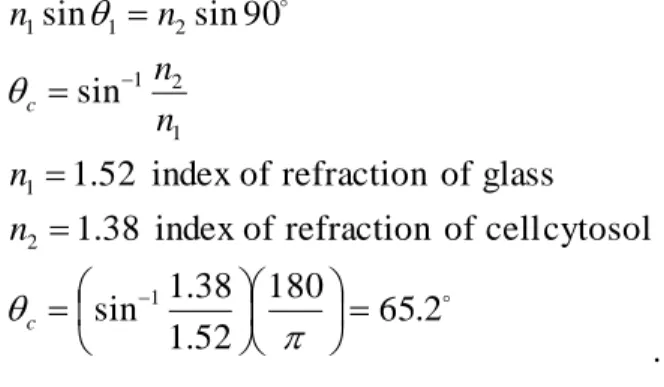
Furthermore, when a ray of light passes from a medium of high refractive index (for instance a glass coverslip) to one of lower refractive index (such as a neuron) a critical angle of incidence exists where no light is transmitted through the sample and 100% of the light is reflected with no loss in intensity or frequency of the reflected light.
This phenomenon is termed total internal reflection, and the critical angle (c) is given by:
2 . 180 65
52 . 1
38 . sin 1
cytosol cell
of refraction of
index 38
. 1
glass of refraction of
index 52
. 1
sin
90 sin sin
1 2
1
1 1 2
2 1 1
c c
n n
n n n n
. Figure 6 displays the phenomenon of total internal reflection.
Figure 6. Total internal reflection. Point P is the light source with the light traveling from the high refractive index medium (glass) to the lower refractive index medium, (water). With increasing angle of incidence, less refraction is seen until a critical angle, θcritical, where there is total internal reflection of the light.
In TIRF, energy is transmitted across the reflection plane via an evanescent wave.
As the name suggests, this wave decays exponentially and allows for imaging within approximately 100 nm of the incident plane (43). The advantage of this technique is the ability to excite fluorescent molecules near the coverslip. In the case of cell cultures, TIRF would excite molecules on or near cell membranes adhering to the coverslip.
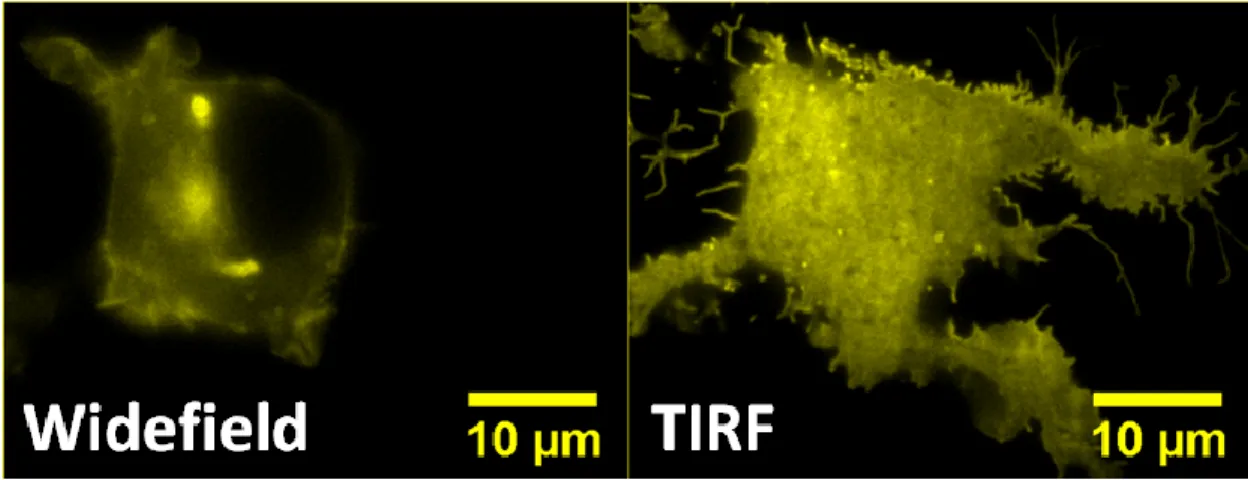
Figure 7 displays a cell illuminated such that the laser illuminates the entire sample (widefield fluorescence), and the same cell illuminated by a laser that is introduced at the TIR critical angle (TIRF). The montage clearly shows that changing the laser angle reveals details on the cell membrane that were not visible under widefield fluorescence.
Figure 7. Comparison of widefield fluorescence to TIRF. The left panel shows a cell that has been illuminated with a laser that is introduced normal to the coverslip, resulting in illumination of the entire cell. In contrast, the right panel shows the same cell,
illuminated by a laser that is introduced at the TIRF critical angle. Because the plasma membrane of the cell is adhered to the coverslip, the TIRF view reveals the cellular details at the plasma membrane more clearly.
Achieving TIRF through a microscope objective lens requires that the maximal half-angle that the objective can collect photons is greater than the TIRF critical angle.
This property of the lens is termed the numerical aperture (NA), and is defined by the relation:NAnsin. A 1.45 NA objective is the minimum acceptable NA used in TIRF illumination, because it can obtain a maximal illumination and collection half angle of 68.4º, a value that allows achievement of the TIRF critical angle of 65.2º. In contrast, a standard 100X 1.4 NA objective can only obtain a maximum illumination half angle of 63.8º; this value falls below the TIRF critical angle condition.
8 . 180 63
56 . 1
4 . 1 1 sin
4 . 180 68
56 . 1
45 . 1 1 sin
objective TIRF
100X acceptable minimum
1.45,
= NA
objective) immersion
(oil medium lens
of refraction of
index 1.56,
= n
4 . 1
45 . 1
NA NA
Studying GAT1 Structure through Fluorescence Resonance Energy Transfer
As previously mentioned, the GAT1 exists as an oligomer on the plasma membrane. Fluorescence resonance energy transfer (FRET) is typically employed to probe the oligomerization state of a protein. This technique allows for the determination of distances between neighboring molecules, essentially serving as a molecular ruler.
There are certain conditions required for FRET to occur, which include the following:
the absorption spectrum of an acceptor fluorophore must overlap the emission spectrum of a donor fluorophore,
the donor and the acceptor molecules must be located within a distance of 10-- 100 Å of one another, and
the dipole moments of both fluorophores must be parallel.
There are four primary methods of studying FRET. These include: the three-cube method, donor photobleaching, fluorescence lifetime imaging, and donor recovery after acceptor photobleaching (DRAP). In the DRAP method, the donor is excited, a
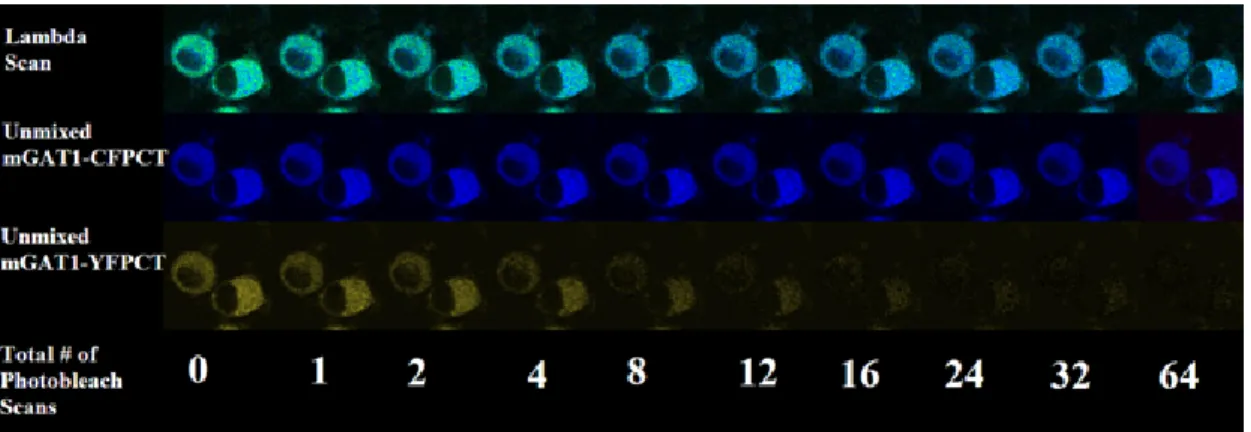
wavelength stack of x-y images is collected and the acceptor is photobleached (44). This iteration of image acquisition and photobleaching continues until complete photobleach of the acceptor is reached. Figure 8 displays a representative DRAP FRET experiment.
In this figure, cyan fluorescent protein (CFP) is the donor fluorophore and yellow
fluorescent protein (YFP) is the acceptor fluorophore; therefore, CFP is dequenched with YFP photobleach.
Figure 8. Donor recovery after acceptor photobleach (DRAP) protocol for measuring FRET. In this FRET approach, YFP is fully photobleached after 64 scans by the laser.
The image also shows that as YFP is photobleached, there is an increase in CFP fluorescence, indicating FRET occurs between the two molecules. (Explanation: When CFP is within 10--100 Å of a YFP molecule, it donates its energy to YFP, rather than emitting photons; however, when YFP is photobleached, CFP can emit photons, as indicated by the increase in CFP fluorescence.) Please note: The increase in CFP fluorescence is hard to discern by eye when looking at the “unmixed mGAT1-CFPCT image panels.” A clearer view of this increase is seen in the “lambda scan” images, where the cells clearly move from a green color (blue + yellow) to a deep blue color.
FRET data is analyzed by normalizing fluorescence intensities to the initial fluorescence, and determining FRET efficiency using the following relation:
D DA
I E1 I ,
where E corresponds to the FRET efficiency. IDA represents the intensity of the donor in the presence of the acceptor, this corresponds to donor fluorescence intensity prior to photodestruction of the acceptor. ID represents the donor fluorescence intensity without the acceptor, corresponding to the dequenched donor fluorescence following
photodestruction of the acceptor (45). From the FRET efficiency, the distance between the donor and acceptor fluorophores can be obtained from the following relation:
6 6
6
R R E R
o o
, where Ro is the Förster distance and is specific to the donor and acceptor used in the FRET experiment; it corresponds to the distance where the FRET efficiency is half maximal.
Studying GAT1 Membrane Confinement with Fluorescence Recovery after Photobleaching
The lateral mobility of a protein on the plasma membrane is now accepted as a form of protein trafficking (23). Lateral diffusion of the AMPA receptor is not only faster than trafficking by exocytosis, but it also accounts for a significant amount of AMPA receptor exchange in dendrites (46). Fluorescence recovery after photobleaching (FRAP) allows for the measurement of molecular lateral mobility and diffusion (47). In this technique, a region of interest is exposed with a high-intensity laser to irreversibly bleach fluorophores in the region. After bleaching, diffusion of fluorescent molecules into the bleached region is monitored by acquisition of images with an attenuated laser.
Raw data are corrected for the photobleaching that occurs during image acquisition and normalized by taking a ratio of the fluorescence in the observed region to the initial fluorescence value as follows:
( ) ( )
( ) ( )
) ( ) (
o o
NB t b t f t b t
f
t b t f
. Here, the background
fluorescence is represented by b(t), the fluorescence in a region not bleached is given by fNB (t), and the pre-bleach fluorescence intensity is represented by f(to). A recovery curve is obtained from the data, and from this we can determine the fraction of molecules, Mf, that are free to diffuse, vs. those that are immobilized. In the following equation, Fbo is
the is the initial fluorescence following photobleach and F∞ is the asymptote of the recovery curve (48): .
1 bo
bo
f F
F M F
The diffusion coefficient is obtained by first determining the half time for fluorescence recovery using the following equations:
2
bo h
F F F
, t th tbo
2
1 , where Fh is the value for fluorescence when half the recovery has occurred; th is the corresponding time for Fh; tbo is the time, following photobleaching, when the first recovery image is obtained; and
2
t1 is the half time of equilibration (49). Finally, the diffusion coefficient is related to the recovery half-time by the following relation:
Deff
t
2
2 1
, where is a constant that describes a circular
Gaussian beam, ω is the radius of the bleach spot, and Deff is the effective diffusion coefficient (50).
Summary of Thesis
In the following chapters, I visualize GAT1 membrane confinement, vesicle trafficking, and structure using the microscopy techniques outlined above. In Chapter 2 I apply FRAP, FRET, and TIRF to determine the interactions that confine GAT1 at the membrane. In Chapter 3 I apply TIRF to fluorescently resolve the vesicle that traffics GAT1 onto the plasma membrane, and to explore the kinematics of the GAT1 vesicle. I also quantify the number of GAT1 molecules on a vesicle. Chapter 4 applies FRET to determine the oligomerization state of the GAT1 mutants, and confocal microscopy to determine the localization of GAT1 on the plasma membrane. Appendix I is a review of the structure, oligomerization, trafficking, and pharmacology of GABA transporter.
Finally, in Appendix II I apply TIRF to characterize the distribution of subunits of the neuronal nicotinic acetylcholine receptor on the plasma membrane.
References
1. Chen, N.-H., M. A. Reith, and M. Quick. 2004. Synaptic uptake and beyond: the sodium- and chloride-dependent neurotransmitter transporter family SLC6. Pflügers Archiv European Journal of Physiology 447:519-531.
2. Giros, B., M. Jaber, S. R. Jones, R. M. Wightman, and M. G. Caron. 1996.
Hyperlocomotion and indifference to cocaine and amphetamine in mice lacking the dopamine transporter. Nature 379:606-612.
3. Chiu, C. S., S. Brickley, K. Jensen, A. Southwell, S. McKinney, S. Cull-Candy, I.
Mody, and H. A. Lester. 2005. GABA transporter deficiency causes tremor, ataxia, nervousness, and increased GABA-induced tonic conductance in cerebellum. J Neurosci 25:3234-3245.
4. Alberts, B., D. Bray, K. Hopkin, A. Johnson, J. Lewis, M. Raff, K. Roberts, and P. Walter. 2004. Essential cell biology. Garland Science, New York.
5. Hoogland, G., H. A. Spierenburg, C. W. van Veelen, P. C. van Rijen, A. C. van Huffelen, and P. N. de Graan. 2004. Synaptosomal glutamate and GABA transport in patients with temporal lobe epilepsy. J Neurosci Res 76:881-890.
6. Richerson, G. B., and Y. Wu. 2004. Role of the GABA transporter in epilepsy.
Adv Exp Med Biol 548:76-91.
7. Wu, Y., W. Wang, and G. B. Richerson. 2001. GABA Transaminase Inhibition Induces Spontaneous and Enhances Depolarization-Evoked GABA Efflux via Reversal of the GABA Transporter. J. Neurosci. 21:2630-2639.
8. Chiu, C. S., K. Jensen, I. Sokolova, D. Wang, M. Li, P. Deshpande, N. Davidson, I. Mody, M. W. Quick, S. R. Quake, and H. A. Lester. 2002. Number, density, and surface/cytoplasmic distribution of GABA transporters at presynaptic structures of
knock-in mice carrying GABA transporter subtype 1-green fluorescent protein fusions. J Neurosci 22:10251-10266.
9. Cohen-Kfir, E., W. Lee, S. Eskandari, and N. Nelson. 2005. Zinc inhibition of {gamma}-aminobutyric acid transporter 4 (GAT4) reveals a link between excitatory and inhibitory neurotransmission. Proceedings of the National Academy of Sciences
102:6154-6159.
10. Ana Gadea, A. M. L.-C. 2001. Glial transporters for glutamate, glycine, and GABA: II. GABA transporters. Journal of Neuroscience Research 63:461-468.
11. Schousboe, A., A. Sarup, O. M. Larsson, and H. S. White. 2004. GABA transporters as drug targets for modulation of GABAergic activity. Biochemical Pharmacology 68:1557-1563.
12. Liu, Q. R., Lopez-Corcuera, B., Mandiyan, S., Nelson, H., Nelson, N. 1993.
Molecular Characterization of Four Pharmacologically Distinct alpha-aminobutyric acid transporters in mouse brain. The Journal of Biological Chemistry 268:2106-2112.
13. Matskevitch, I., C. A. Wagner, C. Stegen, S. Broer, B. Noll, T. Risler, H. M.
Kwon, J. S. Handler, S. Waldegger, A. E. Busch, and F. Lang. 1999. Functional Characterization of the Betaine/gamma -Aminobutyric Acid Transporter BGT-1 Expressed in Xenopus Oocytes. J. Biol. Chem. 274:16709-16716.
14. Kempson, S. A., and M. H. Montrose. 2004. Osmotic regulation of renal betaine transport: transcription and beyond. Pflügers Archiv European Journal of Physiology 449:227-234.
15. Guastella, J., N. Brecha, C. Welgmann, H. A. Lester, and N. Davidson. 1992.
Cloning, expression, and localization of a rat brain high-affinity glycine transporter.
Proceedings of the National Academy of Sciences of the United States of America 89:7189-7193.
16. Bennnett, E. R., Kanner, B.I. 1997. The Membrane Topology of GAT-1, a (Na+ + Cl-)-coupled gamma-Aminobutyric Acid Transporter from Rat Brain. The Journal of Biological Chemistry 272:1203-1210.
17. Farhan, H., Korkhov, V.M., Paulitschke, V., Dorostkar, M.M., Scholze, P., Kudlacek, O., Freissmuth, M., Sitte, H. 2004. Required for Membrane Targeting of the Rat gamma-Aminobutyric Acid Transporter-1 (GAT1). The Journal of Biological Chemistry 279:28553-28563.
18. Hastrup, H., Karlin, A., Javitch, J.A. 2001. Symmetrical dimer of hte human dopamine transporter revealed by cross-linking Cys-306 at the extracellular end of the sixth transmembrane segmetn. Proccedings of the National Academy of Acience USA 98:10055-10060.
19. Schmid, J. A., Scholze, P., Kudlacek, O., Freissmuth, M., Singer, E.A., Sitte, H.H.
2001. Oligomerization of the Human Serotonin Transporter and fo the Rat GABA Transporter 1 Visualized by Fluorescence Resonance Energy Transfer Microscopy in Living Cells. The Journal of Biological Chemistry 276:3805-3810.
20. Yamashita, A., S. K. Singh, T. Kawate, Y. Jin, and E. Gouaux. 2005. Crystal structure of a bacterial homologue of Na+/Cl--dependent neurotransmitter transporters.
Nature 437:215-223.
21. Farhan, H., V. Reiterer, V. M. Korkhov, J. A. Schmid, M. Freissmuth, and H. H.
Sitte. 2007. Concentrative Export from the Endoplasmic Reticulum of the {gamma}-
Aminobutyric Acid Transporter 1 Requires Binding to SEC24D. J. Biol. Chem.
282:7679-7689.
22. Farhan, H., V. M. Korkhov, V. Paulitschke, M. M. Dorostkar, P. Scholze, O.
Kudlacek, M. Freissmuth, and H. H. Sitte. 2004. Two Discontinuous Segments in the Carboxyl Terminus Are Required for Membrane Targeting of the Rat {gamma}- Aminobutyric Acid Transporter-1 (GAT1). J. Biol. Chem. 279:28553-28563.
23. Wang, D., and M. W. Quick. 2005. Trafficking of the Plasma Membrane g- Aminobutyric Acid Transporter GAT1. Size and rates of an acutely recycling pool. J.
Biol. Chem. 280:18703-18709.
24. Deken, S. L., D. Wang, and M. W. Quick. 2003. Plasma Membrane GABA Transporters Reside on Distinct Vesicles and Undergo Rapid Regulated Recycling. J.
Neurosci. 23:1563-1568.
25. Lodish, H., A. Berk, L. S. Zipursky, P. Matsudaira, D. Baltimore, and J. Darnell.
1999. Molecular Cell Biology. W.H. Freeman, New York.
26. Quick, M. W., J. L. Corey, N. Davidson, and H. A. Lester. 1997. Second messengers, trafficking- related proteins, and amino acid residues that contribute to the functional regulation of the rat brain GABA transporter GAT1. J. Neurosci. 17:2967- 2979.
27. Wang, D., S. L. Deken, T. L. Whitworth, and M. W. Quick. 2003. Syntaxin 1A Inhibits GABA Flux, Efflux, and Exchange Mediated by the Rat Brain GABA
Transporter GAT1. Mol Pharmacol 64:905-913.
28. Deken, S. L., Beckman, M.L., Boos, L., Quick, M.W. 2000. Transport rates of GABA transporters: regulation by the N-terminal domain and syntaxin 1A. Nature Neuroscience 3:998-1003.
29. Purves, D., G. J. Augustine, D. Fitzpatrick, L. C. Katz, A.-S. LaMantia, J. O.
McNamara, and S. M. Williams. 2001. Neuroscience. Sinauer Associates, Sunderland.
681.
30. White, H. S., W. P. Watson, S. L. Hansen, S. Slough, J. Perregaard, A. Sarup, T.
Bolvig, G. Petersen, O. M. Larsson, R. P. Clausen, B. Frolund, E. Falch, P. Krogsgaard- Larsen, and A. Schousboe. 2005. First Demonstration of a Functional Role for Central Nervous System Betaine/{gamma}-Aminobutyric Acid Transporter (mGAT2) Based on Synergistic Anticonvulsant Action among Inhibitors of mGAT1 and mGAT2. J
Pharmacol Exp Ther 312:866-874.
31. Clausen, R. P., E. K. Moltzen, J. Perregaard, S. M. Lenz, C. Sanchez, E. Falch, B.
Frolund, T. Bolvig, A. Sarup, O. M. Larsson, A. Schousboe, and P. Krogsgaard-Larsen.
2005. Selective inhibitors of GABA uptake: synthesis and molecular pharmacology of 4- N-methylamino-4,5,6,7-tetrahydrobenzo[d]isoxazol-3-ol analogues. Bioorganic &
Medicinal Chemistry 13:895-908.
32. Michael, D. J., R. A. Ritzel, L. Haataja, and R. H. Chow. 2006. Pancreatic {beta}- Cells Secrete Insulin in Fast- and Slow-Release Forms. Diabetes 55:600-607.
33. Lynch, B. A., N. Lambeng, K. Nocka, P. Kensel-Hammes, S. M. Bajjalieh, A.
Matagne, and B. Fuks. 2004. The synaptic vesicle protein SV2A is the binding site for the antiepileptic drug levetiracetam. PNAS 101:9861-9866.
34. Toomre, D., J. A. Steyer, P. Keller, W. Almers, and K. Simons. 2000. Fusion of Constitutive Membrane Traffic with the Cell Surface Observed by Evanescent Wave Microscopy. J. Cell Biol. 149:33-40.
35. Liu, T., W. C. Tucker, A. Bhalla, E. R. Chapman, and J. C. Weisshaar. 2005.
SNARE-Driven, 25-Millisecond Vesicle Fusion In Vitro. Biophys. J. 89:2458-2472.
36. An, S. J., and W. Almers. 2004. Tracking SNARE Complex Formation in Live Endocrine Cells. Science 306:1042-1046.
37. Halliday, D., Resnick, R., Krane, K.S. . 1992. Physics. John Wiley & Sons, Inc., New York.
38. Axelrod, D. 2003. Total Internal Reflection Fluorescence Microscopy in Cell Biology. Methods in Enzymology 361:1-33.
39. Dickinson, M. E., G. Bearman, S. Tilie, R. Lansford, and S. E. Fraser. 2001.
Multi-spectral imaging and linear unmixing add a whole new dimension to laser scanning fluorescence microscopy. Biotechniques 31:1272, 1274-1276, 1278.
40. Nashmi, R., M. E. Dickinson, S. McKinney, M. Jareb, C. Labarca, S. E. Fraser, and H. A. Lester. 2003. Assembly of a4b2 nicotinic acetylcholine receptors assessed with functional fluorescently labeled subunits: effects of localization, trafficking, and nicotine- induced upregulation in clonal mammalian cells and in cultured midbrain neurons. J Neurosci 23:11554-11567.
41. Triller, A., and D. Choquet. 2005. Surface trafficking of receptors between synaptic and extrasynaptic membranes: and yet they do move! Trends in Neurosciences 28:133-139.
42. Wells, K. S., Sandison, D.R., Strickler, J., Webb, W.W. 1990. Quantitative Fluorescence Imaging with Laser Scanning Confocal Microscopy. In Handbook of Biological Confocal Microscopy. J. B. Pawley, editor. Plenum Press, New York and London. 27-39.
43. Axelrod, D., Koppel, D.E., Schlessinger, J., Elson, E., Webb, W.W. . 1976.
Mobility measurement by analysis of fluorescence photobleaching recovery kinetics.
Biophysical Journal 16:1055-1069.
44. Rabut, G., Ellenberg, Jan. 2005. Photobleaching Techniques to Study Mobility and Molecular Dyanmics of Proteins in Live Cells: FRAP, iFRAP, and FLIP. In Live Cell Imaging: A Lab Manual. D. S. Robert D. Goldman, editor. Cold Spring Harbor Laboratory Press, Cold Spring Harbor, New York. 101-126.
45. Wey, C. L., Cone, R.A., Edidin, M.A. 1981. Lateral Diffusion of Rhodopsin in Photoreceptor Cells Measured by Fluorescence Photobleaching and Recovery.
Biophysical Journal 33:225-232.
Chapter 2: Ezrin mediates tethering of the γ-
aminobutyric acid transporter, GAT1, to actin filaments via a C-terminal PDZ domain
This chapter has been submitted for publication. We determine interactions that confine GAT1 at the membrane by investigating the lateral mobility of GAT1-YFP8 expressed in neuroblastoma 2a (N2a) cells. I performed the FRAP, TIRF, and FRET experiments along with the analysis. Fraser Moss performed the molecular biology, creating GAT1- YFP8.
Ezrin mediates tethering of the -aminobutyric acid transporter GAT1 to actin filaments via a C-terminal PDZ domain
Princess I. Imoukhuede1,2, Fraser J. Moss2, Darren J. Michael3, Robert H. Chow3, and Henry A. Lester2*
1Bioengineering and 2Division of Biology, California Institute of Technology, Pasadena, CA 91125, USA
3Zilkha Neurogenetic Institute and Department of Physiology and Biophysics, Keck School of Medicine, University of Southern California, Los Angeles, CA 90089, USA
*Corresponding author: Henry A. Lester, 1200 E California Blvd., M/C 156-29, Pasadena, CA 91125-2900, Phone: (626)395-4946, Fax:
(626)564-8709, Email: lester@caltech.edu Running Title: GAT1 interacts with actin via PDZ domain & ezrin
Total character count: 49,075
A high density of neurotransmitter transporters on axons and presynaptic boutons is required for efficient clearance of neurotransmitter from the synapse.
Therefore, regulators of transporter trafficking (insertion, retrieval, and confinement) can play an important role in maintaining the transporter density necessary for effective function. We determine interactions that confine GAT1 at the membrane by investigating the lateral mobility of GAT1-YFP8 expressed in neuroblastoma 2a (N2a) cells. Through fluorescence recovery after photobleaching (FRAP) we find that a significant fraction (~
50%) of membrane-localized GAT1 is immobile. The mobility of the transporter can be increased by depolymerizing actin or by interrupting the GAT1 PDZ-interacting domain. Microtubule depolymerization, in contrast, does not affect GAT1 membrane mobility. We also identify ezrin as a major GAT1 adaptor to actin. Förster resonance energy transfer (FRET) determines that the distance between GAT1-YFP8 and ezrin-CFP is 64--68 Å. This distance can be increased by disrupting the actin cytoskeleton.
Altogether, our data reveal that actin confines GAT1 to the plasma membrane via ezrin, and this interaction is mediated through the GAT1-PDZ interaction domain.
Key Words: GABA, transporter, GAT1, lateral mobility, trafficking, FRAP, actin, cytoskeleton, PDZ-interacting motif, fluorescent protein
The -aminobutyric acid (GABA) transporter GAT1 (51), a member of the SLC6 family of neurotransmitter transporters, is a 12- transmembrane domain protein that aids in terminating GABAergic synaptic signaling by transporting GABA into cells. GAT1 is the predominant GABA transporter in the brain and is localized primarily on axons and presynaptic terminals of GABAergic inhibitory neurons; it is also expressed on astrocytes (52, 53).
The uptake of each GABA molecule is coupled to co-transport of two Na+ ions and one Cl- ion (54- 56). The complete time for one transport cycle is
~ 100 ms, which is longer than the ~ 10 ms decay time constant of GABAergic postsynaptic currents (57). This implies that each transporter functions at most only once per synaptic event.
To accommodate such functional constraints, a GAT1 density on the order of 1000 transporters/µm2 is required (33). The actual measured density of GAT1 molecules on several membranes, including presynaptic boutons and axons, is 800--1300 transporters/µm2 (33).
Therefore, a high membrane density of GAT1 underlies the efficient clearance of GABA from the synaptic cleft and from nearby extrasynaptic compartments. Knowing that a high density of GAT1 on the membrane aids in clearance, one may ask how GAT1 trafficking is regulated and how GAT1 is restricted among membrane compartments.
Some aspects of GAT1 trafficking have been studied, and GAT1 insertion and retrieval time constants of 1.1 and 0.7 min-1, respectively, have been obtained through biotinylation studies (23).
Previous studies have also revealed that that 30% of the GAT1 cellular pool exists within the plasma membrane. The remaining 70% of GAT1 is found in vesicles adjacent to the membrane surface. The trafficking rates and the high number of reserve GAT1 vesicles have the potential to affect GAT1 membrane density and effectively increase GABA turnover.
We seek an understanding of the restriction of GAT1 mobility at the membrane and by analogy the restriction of other SLC6 family transporters.
To this end we apply FRAP to measure GAT1 movement at the plasma membrane. FRAP reveals both the time course and the mobile fraction for protein movement, which are governed by passive diffusion, by active processes, and by tethering within and near the