Volatility spillovers due to differences in the degree of market integration: Evidence from selected Asian and Eastern European stock markets. General Comment: This paper explained the volatility transmitted from the global market to ten Asian and Eastern European stock markets and from the major stock exchanges in the region to the rest of the stock markets by considering their degree of integration. The purpose of this research is to investigate the volatility transmitted from the global market to ten Asian and Eastern European stock markets and from the major stock markets in the region to the rest of the stock exchanges by considering their degree of integration.
Specifically, there is no spillover of volatility from major global and regional markets to segmented equity markets. However, the integration of stock exchanges towards the international market has not yet been discovered. Therefore, detailed assessments of the level and nature of financial integration between stock markets are needed.
Accordingly, we expect that a volatility spillover event may occur only in stock markets that have greater integration with the global market and the major stock market in the region, such as China in Asian or Russia in Eastern European stock markets.
METHODOLOGY
Among various domestic and global factors, the return volatility of major stock markets is one of the important factors of stock return volatility in a stock market (Mukherjee & Mishra, 2010). The return of time t for the stock index i sample (Ri,t) is the difference between the natural logarithm of the index price at the current time (Pi,t) and the natural logarithm of the index price at a previous time ( lnPi,t -1). The first objective is to analyze the strength of a stock market as a receiver versus the volatility effects of international and regional markets as senders.
Bekaert and Harvey (1997) in the work on the volatility spillover models for the stock returns from the original market to the ten receiving stock markets. Where RWI,t, RCN,t and RRS,t are market returns on the world markets, China and Russia stock markets respectively at time t; and εt is the error term at time t. The first equation, called the mean equation, of the AR-GARCH-M(p,q) model for the recipient domestic stock market i is expressed as follows:.
2∑(n log(2𝜋) + 2 log|𝐷𝑡| + log|𝑅𝑡| + 𝜀𝑡′𝑅𝑡−1𝜀𝑡) (13) In order to achieve the third objective, we connect the volatility spillover patterns across markets with patterns of the degree of integration between these markets.
EMPIRICAL RESULTS AND DISCUSSION
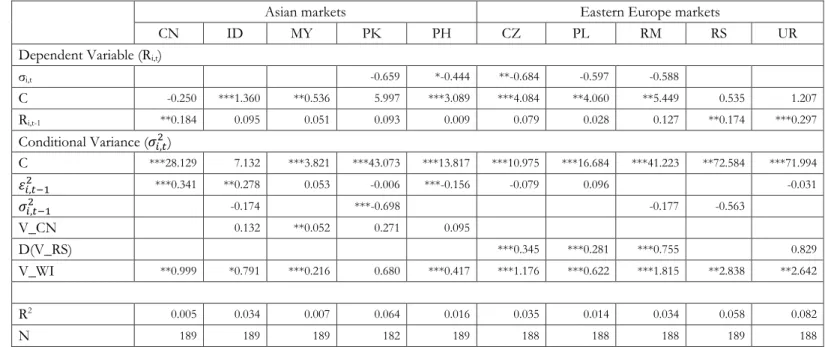
In contrast, the conditional variance of the global market has no effect on the conditional variance of the Pakistan Stock Exchange, which is shown by the insignificant coefficient of V_WI at a statistical amount of 0.680. Regionally, the estimation results in Asian stock markets indicate that the conditional variance of the Chinese stock market (V_CN) has a positive effect on the conditional variance of the Malaysian stock market. The volatility of the Russian stock market was partially implemented in the form of transformation, i.e. in the form of the first difference D(V_RS), due to the problem of multicollinearity with the volatility of the world market index (V_WI).
The volatility of global market returns affects the volatility of returns of all observed stock markets, except for the volatility of the Pakistan Stock Exchange. A similar pattern suggests that the Chinese stock market also has a higher level of integration only with the Malaysian stock market. In addition, the volatility of returns of the Russian stock market, as the dominant stock market in Eastern Europe, only affects the volatility of the Czech, Romanian and Polish stock markets.
On the other hand, the Russian stock market also has a higher degree of integration with these three stock markets.
CONCLUSION
These patterns indicate that volatility would be sent from the global market provided that the degree of integration with the receiving stock market is higher. Moreover, as the dominant stock market in the Asian region, China's stock market only sends its return volatility to the Malaysian stock market. This evidence suggests that volatility transfer from China would occur under the condition of a higher degree of integration with the Malaysian stock market.
According to the results of volatility spillover and market integration investigated, it can be argued that the volatility of stock market affected by the volatility of other stock market occurs when both stock markets have a higher degree of integration. In contrast, the volatility of a local stock market segmented into global or regional market will not change. Stock market that is more integrated with international financial movements will be more sensitive to external shock.
The findings suggest that financial asset volatility integrated across borders may be a source of financial asset vulnerability in the national stock market.
Volatility spillovers under difference in the degree of market integration: evidence from selected Asian and
Comments (Please give your critical comment for the deficiencies of each section of the manuscript)
REVIEW FORM
Volatility effects under differences in the degree of market integration: evidence from selected Asian and. The GARCH(p,q) method used to analyze volatility spillovers was less sophisticated than the other recent methods. In addition, this method does not consider the other factors such as asymmetric factor as found in the latest ARCH(p,q) family, for example EGARCH, TGARCH, QGARCH and various other non-linear GARCH models.
The volatility in the time series model that is considered a more advanced measure is the ARCH family. The analysis to generate this finding was very simple, linking only the volatility overflow patterns to the patterns of the dynamic degree of integration between markets. For future research, it would be better to expand on this problem by using the different causality methods that examine the effect of market integration on volatility spillovers.
Furthermore, the challenges for future research are to explore other factors that influence volatility spillovers and to investigate the consequences that may arise from volatility spillovers among stock markets (as written in the conclusion section on page 14).
Please rate the following: (1 = Excellent) (2 = Good) (3 = Fair) (4 = Poor)
Recommendation: ( Kindly Mark with an X )
Additional Comments (Please make suggestions to the authors)
Volatility spillovers under difference in the degree of market integration: evidence from selected Asian
INTRODUCTION
It refers to the international portfolio diversification framework, which states that the movement of financial assets between stock markets plays an important role in the change in volatility. In addition, Gebka and Serwa (2007) argue that there is varying evidence for the volatility spillover between emerging equity markets in Latin America, East Asia and Eastern Europe. They recognize that equity markets will be more vulnerable or contaminated by the volatility of the other markets when integrated.
As emerging markets develop and become more similar to mature markets, they automatically respond better to the volatility of equity markets elsewhere in the world. It could make their decisions more efficient and effective in anticipating the events in the stock markets. The higher integration of international equity markets and the associated volatility of equity prices would weaken international portfolio diversification (Bekaert, Harvey, & Ng, 2005).
For example, the global financial crisis overwhelms and suppresses emerging stock markets and causes prices to fall rapidly (Neaime, 2012).
LITERATURE REVIEW
These results suggest that there is volatility spillover from the world market to nine observed stock markets and there is no volatility contagion in the Pakistani stock market. This evidence suggests that the volatility in the Asian region from the Chinese stock market only occurs in the Malaysian stock market. This information suggests that the Pakistani stock market has the lowest degree of integration in observed market pairs with the world market and major markets in its region.
This fact informs that China has a higher degree of integration only with the stock market of Malaysia in the Asian region and Russia has a higher degree of integration with the whole stock markets in the Eastern Europe region. We examine volatility transmissions from the global market to the ten stock markets in Asian and Eastern Europe regions, and from major stock market in the region to the four stock markets. The first is variation in the degree of integration linking the world market index movement to the returns of each stock market for different regional markets.
The second is variation in the volatility spillover that links global market volatility to the volatility of each stock market for different regional markets. Conversely, the Ukraine stock market has the highest average returns in the region, followed by the highest risk. These results indicate that there are volatility spillovers for all sample periods from the global market to nine observed stock markets and there is no volatility spillover on the Pakistani stock market.
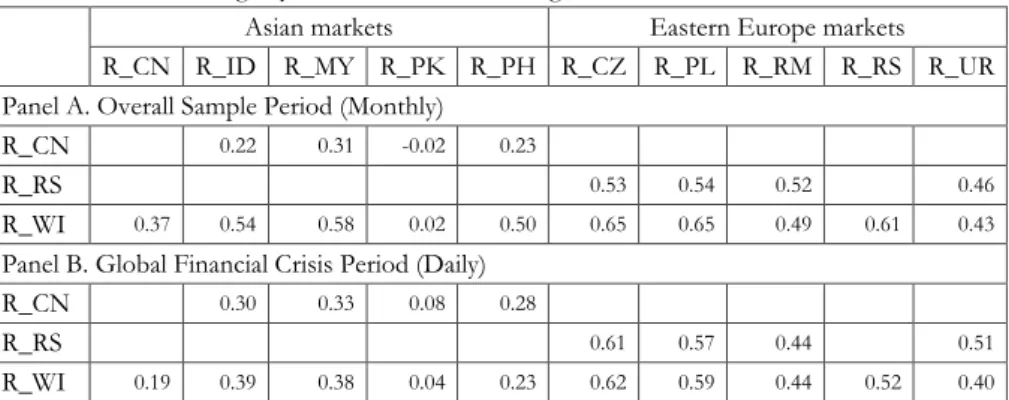
Similarly, the global market also has a higher degree of integration with all observed stock markets except with Pakistani stock market. Specifically, domestic stock markets that have a higher (lower) degree of integration will (not) receive volatility spillovers from the global market. Furthermore, Table 4 Panel A displays monthly average series of eighteen stock market pairs among the global market and ten stock markets in Asian and Eastern Europe regions.
This information indicates that Pakistan stock market has the lowest degree of integration in observed markets pairs with the world market and major markets in its region. This fact informs that China has a lower degree of integration with the whole stock market in the Asian region and Russia has a higher degree of integration with the whole stock markets in the Eastern Europe region. Conversely, all stock markets in Eastern Europe have a higher level of integration with the world market.
In addition, the volatility of the returns of the Russian stock market as the dominant stock market in Eastern Europe affects the volatility of the Czech, Romanian and Polish stock markets. Following the same pattern, the Russian stock market also has a higher degree of integration with these three stock markets. We investigate volatility transmissions from the global market to ten stock markets in the Asian and Eastern European regions, and from the main stock exchanges of both regions to four other stock exchanges.
Paper published, 10 Maret 2019 (jam 23:43)