68 INTENSIF: Jurnal Ilmiah Penelitian dan Penerapan Teknologi Sistem Informasi
Water Management Zone Mapping on Peatland in Limbung Village Sungai Raya District
Received:
25 October 2023 Accepted:
22 January 2024 Published:
1 February 2024
1*Qishtamy Wahyu Alyaminy, 2Rossie Wiedya Nusantara,
3Ari Krisnohadi
1-3Ilmu Tanah, Universitas Tanjungpura E-mail: 1[email protected],
2[email protected], 3[email protected]
*Corresponding Author Abstract—This study focuses on mapping peatland water management zones, which have not been mapped in previous research. These water management zones serve as crucial reference points for the development and implementation of the National Peatland Ecosystem Protection and Management Plan.
The research applied various methods, including soil survey, drilling, soil sampling, measuring groundwater level and canal, matching methods, and create a peat water management zone map. Based on research and map overlays, five water management zones were obtained, these zones include Zone I (F2.B1.K1.C2) covering 1.39 ha (11.58%), Zone II (F1.B1.K1.C2) covering 0.82 ha (6. 83%), Zone III (F2.B1.K1.C3) covering 1.93 ha (16.08%), Zone IV (F1.B1.K1.C3) covering 3.86 ha (32.17%) and Zone V (F1.B1.K2.C3) covering 4.00 ha (33.33%). These water management zones will be related to conservation activities to maintain the quality of soil and water on peatlands. Peatland restoration management activities in Zone I can be accomplished by canal blocking and maximum planting patterns, in Zone II by canal filling and maximum planting patterns, in Zone III by canal blocking and enrichment plants, in Zone IV by canal backfilling and maximum planting patterns, and in Zone V by canal backfilling and deep wells.
Keywords—Peatland; Water Management Zone; Land Survey; Land Restoration
This is an open access article under the CC BY-SA License.
Corresponding Author:
Qishtamy Wahyu Alyaminy, Ilmu Tanah,
Universitas Tanjungpura,
Email: [email protected] Orchid ID: http://orcid.org/0009-0003-6203-998X
INTENSIF: Jurnal Ilmiah Penelitian dan Penerapan Teknologi Sistem Informasi 69 I.INTRODUCTION
Peatland is a significant land resource that covers approximately 14.9 million hectares, equivalent to 8% of Indonesia's total land area of 189 million hectares [1]. Although peatlands cover much of the world, they represent only a small percentage of Earth's land area [2]. Peatlands are valuable ecosystems that play a critical role in carbon cycling and hydrology. They are highly important for their ability to store carbon and regulate water flow[3]. However, peatland productivity remains relatively low, despite its vast potential [4], [5]. Productivity is highly dependent on management and human actions [6]. Peat is a wetland ecosystem that is fragile in nature. If damaged, it will be difficult for it to return to its original condition. Technical term abbreviations are explained when first used for comprehensibility. Degraded peat refers to the state of peat soil that is damaged due to the decline in the quality of peat concerning its chemical, physical, biological and hydrological functions [7], [8].
Water management in peatlands needs to consider several characteristic features of bogs, such as the exceptional ability of peat to absorb water (hydrophilic) [9]. Water management in peatlands must employ an integrated and holistic approach, implemented through a water management zone strategy. Peatland water management zones can serve as a foundation for creating all-encompassing and sustainable water management strategies in peatlands.
Water management in peatlands aims to regulate water resources for maximum land productivity, while ensuring the sustainability of land resources. It is essential to maintain a balance between the utilization of water resources and the conservation of land [10]. Water management in peatlands is closely related to a crucial factor, groundwater level. This applies to both natural and degraded peatlands. Regulating the groundwater level is essential to ensure that it is neither too shallow nor too deep, thereby maintaining the integrity of the peat [11].
Limbung Village is predominantly characterized by peatland, which is utilized for agriculture purposes and its proximity to the airport. In recent years, the village has experienced severe peat fires. Therefore, proper management is necessary. One potential approach could be to repair current infrastructure, including constructing and maintaining canal blocking [12], canal backfilling, and utilizing deepwells [13] to stabilize the groundwater table. This would help to raise the groundwater table to the vicinity of the soil surface, which would restore near-natural hydrological conditions [12] and mitigate the risk of land fires and haze [14] that may disrupt flight operations. Peatland restoration is also an effective means of mitigating and preventing the spread of forest and land fires. The effective and uninterrupted regulation of the water level through canal blocking facilitates the leaching of toxic materials and creates a favourable ground for plant growth [10]. Furthermore, canal blocking aids in regulating the water level in the peat
70 INTENSIF: Jurnal Ilmiah Penelitian dan Penerapan Teknologi Sistem Informasi profile, thereby preventing flooding during rainy seasons and excessive dryness during the dry season [11]. Changes in water table levels result in higher emissions from peatlands [12].
Therefore, it is essential to carefully monitor and manage water table levels in peatland areas.
Proper water management requires a spatial information in the form of mapping that delineates water management zones on peatlands. In Indonesia, spatial optimization has been employed to identify the necessary restoration area to counteract the negative effects of harmful land use [15],[16]. Additionally, it has been used to target specific peatland restoration interventions, such as blocking drainage canals and preventing fires [17]. The mapping of peatland water management zones is based on an analysis of the hydrological conditions, the peatland conditions and the land use in the area. The peat water management zones map can help identify the appropriate water management strategies for each zone. Proper water management can enhance the productivity of peatland, primarily in regions that necessitate more rigorous water management strategies.
This study aims to identify the appropriate water management strategy for a specific zone based on the condition and characteristics of peatlands in Limbung Village. To achieve this, a map of the zone is required, which has not been previously mapped due to the need for additional datasets in the form of parameters.[18] conducted research on water management in peatlands by zoning peat water levels. The resulting spatial data on peat water levels were presented in the form of maps. The water level zoning map serves as the foundation for creating a peat water management plan to mitigate forest and peatland fires in the region. This study determined water management in peatlands solely based on the peat water table zoning map, limited to protected areas. It did not consider zones formed from parameters such as the peat ecosystem function map, burned area map, canalised area map, and vegetation density map, which were included in this study. The difference between this research and previous research lies in the formation of water management zones, where this study adds new, more complex parameters to determine appropriate restoration and water management actions.
Mapping water management zones can aid in identifying suitable water management methods based on the characteristics of the peat soil in each zone, which in turn can enhance the effectiveness and efficiency of water management to preserve soil moisture and prevent wildfires.
Mapping water management zones in Limbung Village can be instrumental in identifying suitable water management strategies for each zone, thus enhancing overall land productivity.
INTENSIF: Jurnal Ilmiah Penelitian dan Penerapan Teknologi Sistem Informasi 71 II.RESEARCHMETHOD
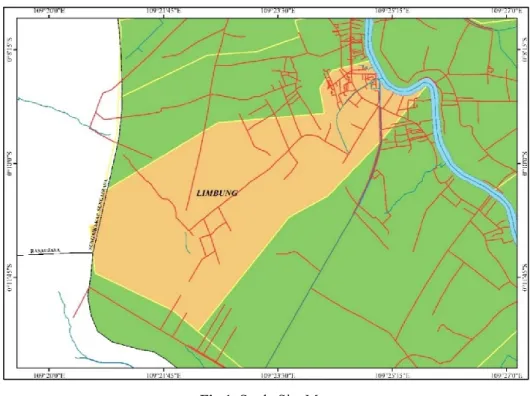
This study located in Limbung Village, Sungai Raya District, Kubu Raya Regency, which is divided into three land uses: horticulture, shrubs and secondary forest (Figure 1). Sample analysis was conducted at the Laboratory of Physics and Soil Conservation and the Laboratory of Chemistry and Soil Fertility at Tanjungpura University's Faculty of Agriculture.
Fig 1. Study Site Map
The research utilized a range of equipment, including stationery, a meter, a knife/cutter, label paper, plastic bags, a GPS (global positioning system), a measuring cup, an Eijkelkamp drill, a drill inclusion profile description sheet, a sample ring, a Munsell soil colour chart, ArcGIS software, Microsoft Office Word & Excel, laptop hardware, and a camera. The study utilized both intact and disturbed soil samples obtained during a single collection for the analysis of physical and chemical properties in both the laboratory and field. In addition to this, rainfall and temperature data spanning the past 10 years (2013-2022), administrative maps, soil type maps, land use maps, observation point maps, and the 2023 Landsat 8 OLI Imagery sourced from USGS Earth Explorer. The data used covers the whole research period collected or generated within the identical time span as the research period.
72 INTENSIF: Jurnal Ilmiah Penelitian dan Penerapan Teknologi Sistem Informasi Fig 2. Research Methodology
The land survey, matching methods, and mapping was utilised for this research, which was conducted in multiple stages (Figure 2). The initial stage included creating a land unit map utilizing secondary data gathered from various agency sources which are Balai Besar Penelitian dan Pengembangan Sumberdaya Lahan Pertanian (Indonesian Center for Agricultural Land Resources Research and Development) for soil types and Badan Informasi Geospasial (Geospatial Information Agency) land use and administrative, engaging in literature study and preparing research tools and materials. Primary data collection comprised physical parameters that could be measured in the field, encompassing peat depth, peat maturity, groundwater level, and canal water level at the pre-defined points based on the map analysis results. Soil sampling was conducted in two modes: intact soil samples and disturbed soil samples in the Acrotelm and Catotelm layers, respectively. Soil samples were analysed for physical and chemical properties in the laboratory.
The matching methods involves aligning field data with analytical data, which is used as a reference point for creating water management zone maps.
Technically, the Water Management Zone Map creation process was implemented through a straightforward overlay method using ArcGIS software. The overlaid parameters data layers followed a sequence of: (1) Peat Ecosystem Function Map; (2) Burn Area Map; (3) Canalized Area Map and (4) Vegetation Density Map. Figure 3 presents the stages of analysis involved in generating the water management zone map.
(*) = optimization
INTENSIF: Jurnal Ilmiah Penelitian dan Penerapan Teknologi Sistem Informasi 73 Fig 3. Water Management Zone Mapping Analysis Steps
The Peat Ecosystem Function Map was produced by measuring the peat depth in the field and analysing the resulting data using ArcGIS software, displaying the protection and cultivation functions of the peat ecosystem. The code (F) is used to label the Peat Ecosystem Function Map.
The Burn Area Map is generated through Google Earth imagery and historical data on terrestrial fires in the region. The data is then processed using ArcGIS software, resulting in a clear visualisation of the burn area map. The code (B) is used to label the Burn Area Map.
Survey and Field Observation
Land Unit Map
Peat Depth Map Soil Physical and Chemical Properties
Peat Ecosystem Protection Function
Zone Map
Peat Ecosystem Cultivation Function
Zone Map
Vegetation Density Map
Landsat 8 Imagery in
2023
Peat Ecosystem
Zone Map Burn Area
Map
Canalized Area Map
Water Management Zone Map*
overlay
Groundwater Level Map*
Undamaged
Zone Damaged Zone
overlay
Piezometer Installation Imagery
Cropping
Composite Band
NDVI Analysis
(*) = optimization
74 INTENSIF: Jurnal Ilmiah Penelitian dan Penerapan Teknologi Sistem Informasi The Canalized Area Map was obtained through field survey at the research site (Table 1).
Canal coordinate data was analysed using ArcGIS software to generate a map of canal points.
Canal maps are labeled by a code (K). The Vegetation Density map was acquired through field surveys of the research site, where vegetation density of the land use was verified. Vegetation density underwent NDVI (Normalized Difference Vegetation Index) analysis using ArcGIS software. The resulting Vegetation Density map is identified by code (C).
The groundwater level map was generated by analyzing the water level data collected from a piezometer apparatus deployed at the research site. The map was utilized to identify the damaged and undamaged zones as per the Ministry of Environment and Forestry Regulation Number P.16 of 2017, which provides technical guidance for ecosystem reparation in peatlands with a maximum groundwater level of 40 cm. A zone is considered damaged if the water table exceeds 40 cm [19].
Table 1. Criteria for Water Management Zones in Peatlands Peat Ecosystem
Function Class (F)
Burn Area Class (B)
Canalized Area Class (K)
Vegetation Density Class (C) Protection Function
(F1) Burn Area (B1) Canalized Area (K1) Low Density (C1) Cultivation Function
(F2) Non-Burn Area
(B2) Non-Canalized Area
(K2) Moderately Density (C2)
Highly Density (C3) Source: Regulation of the Head of the Peatland Restoration Agency No. 4/2017
III.RESULTANDDISCUSSION
A. Land Characteristics
The results showed differences in soil depth, soil type, and groundwater levels, which led to the identification of different management zones based on the observed soil characteristics.
Observations were made at six points for each land use category, Horticulture, Shrubs, and Secondary Forest. Soil depth measurements were taken at 18 observation points, with six points for each land use category. The transect lines are spaced 115 metres apart, divided into 6 lines.
Within each transect line, there are 3 lines spaced 150 metres apart. Soil samples were taken by drilling from the top layer to the substratum layer (mineral layer), and observations were made on the soil cross-section to determine the characteristics of the peat soil.
Soil sampling was conducted on each land use at two layers, the Acrotelm and Catotelm layers, resulting in a total of eight samples around the piezometer. Two soil samples were taken from horticulture before and after canal blocking, one soil sample was taken from shrubs before canal blocking, and one soil sample was taken from secondary forest. The samples were composite
INTENSIF: Jurnal Ilmiah Penelitian dan Penerapan Teknologi Sistem Informasi 75 samples taken under disturbed soil conditions and intact samples taken with sample rings at each drilling point in the Acrotelm and Catotelm layers. Composite soil sampling was conducted to analyse c-organic parameters in disturbed soil conditions. Whole soil sampling was carried out using a drill around the piezometer in the Acrotelm and Catotelm layers to analyse content weight, moisture content, fibre content, and total porosity.
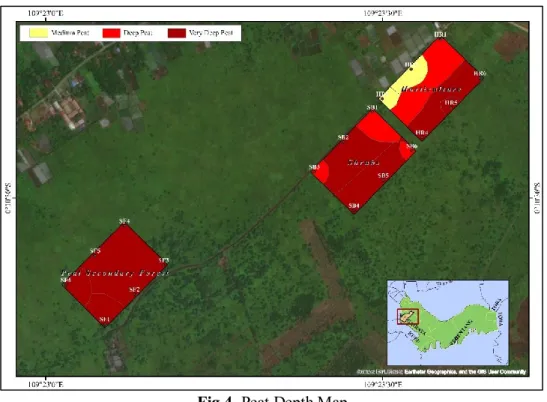
Fig 4. Peat Depth Map
Peat soil depth (figure 4) is grouped into four categories: shallow peat (50 – 100 cm), medium peat (100 – 200 cm), deep peat (200 – 300 cm), and very deep peat (> 300 cm) [20]. Peat depth in the study area ranges from medium to very deep. These details are available in Table 2.
Table 2. Peat Depth Criteria
Land Use Peat Depth Criteria Area
Ha (%)
Horticulture Medium (0 – 121 cm) 0,72 6,00
Deep (0 – 259 cm) 1,69 14,08
Very Deep (0 – 421 cm) 1,59 13,25
Shrubs Deep (0 – 282 cm) 0,93 7,75
Very Deep (0 – 480 cm) 3,07 25,58
Secondary Forest Very Deep (0 – 594 cm) 4,00 33,33
Source : Drill Observation (2023)
Based on field observations, the research sites, specifically the horticulture, shrubs and secondary forest areas, all measuring an area of 4.00 ha each, exhibit varying depths of peat. The
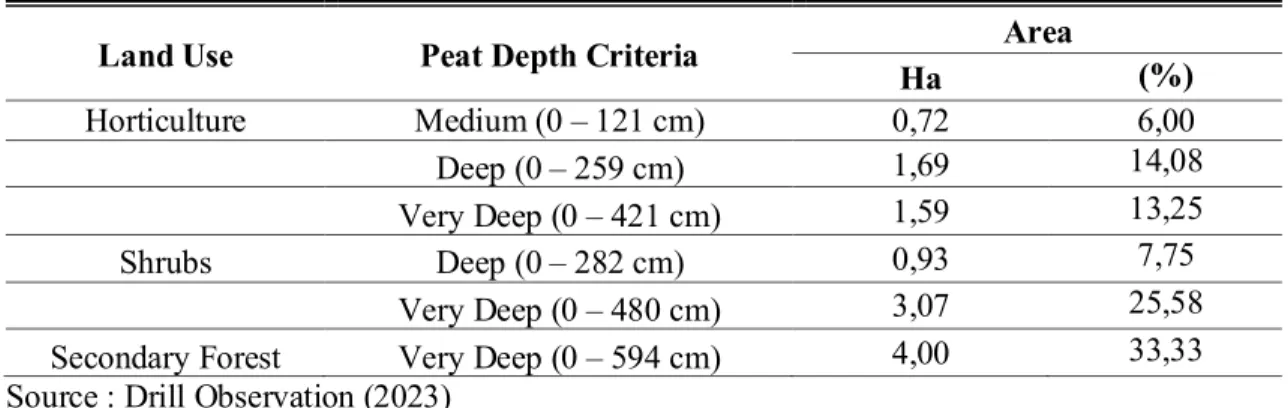
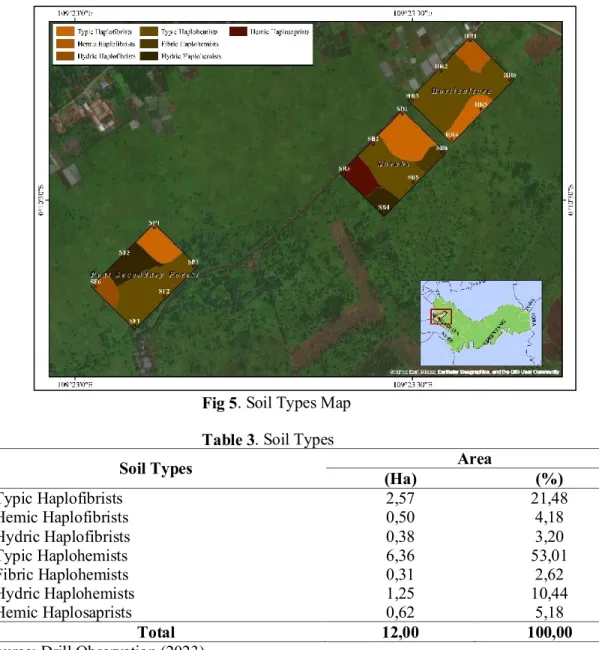
76 INTENSIF: Jurnal Ilmiah Penelitian dan Penerapan Teknologi Sistem Informasi peat soil depth (Figure 5) at the research location is determined by classifying it into three categories, namely medium, deep and very deep. Peat with a depth of 100-200 cm covers an area of 0.72 hectares, while peat with a depth of 200-300 cm covers 2.62 hectares, and peat with a depth greater than 300 cm covers the largest area of 8.66 hectares.
Fig 5. Soil Types Map Table 3. Soil Types
Soil Types Area
(Ha) (%)
Typic Haplofibrists 2,57 21,48
Hemic Haplofibrists 0,50 4,18
Hydric Haplofibrists 0,38 3,20
Typic Haplohemists 6,36 53,01
Fibric Haplohemists 0,31 2,62
Hydric Haplohemists 1,25 10,44
Hemic Haplosaprists 0,62 5,18
Total 12,00 100,00
Source: Drill Observation (2023)
Soil types (table 3) are classified based on field verification results, specifically through drilling and maturity observation. The observations conducted at the research site identified one soil ordo, which is histosols, and three subordo, namely fibrists, hemists, and saprists. There are several subgroups within each sub-group, including Typic Haplohemists, Typic Haplofibrists, Hemic Haplofibrists, Fibric Haplohemists, Hemic Haplosaprists, Hydric Haplohemists, and Hydric Haplofibrists. Among these, Typic Haplohemist is the most widespread soil type, covering 8.67 Ha (71.54%), while the Hemic Haplofibrists soil type is the smallest, with only 0.21 Ha (1.73%) of coverage.
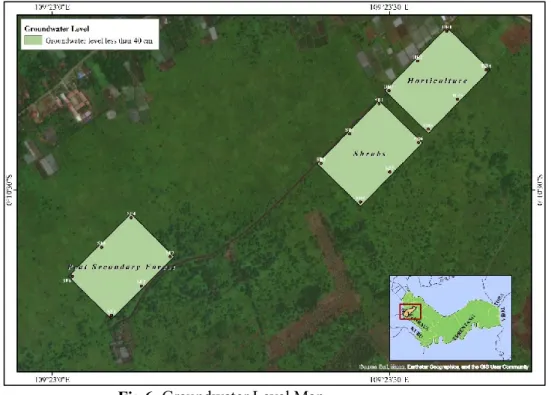
INTENSIF: Jurnal Ilmiah Penelitian dan Penerapan Teknologi Sistem Informasi 77 Fig 6. Groundwater Level Map
Groundwater levels (Figure 6) were observed using piezometers/PVC pipes installed in three land uses, with observations made twice a week for one month. Observations were taken twice daily, at 8 am and 4 pm, at the same location. The groundwater level at the three research sites is low (less than 40 cm). This suggests that each site's peatland is not classified as damaged, since the water level is less than 40 cm high. (Figure 5)
Table 4. Soil Physical and Chemical Properties Land Use Sample
Code
Bulk Density (g/cm3)
Porosity (%)
Fiber Content
(%)
Water Content
(%)
C – Organic (%)
Horticulture
H1 A 0,10 93,05 38,00 795,20 54,60
H1 C 0,07 95,67 44,00 1346,37 52,57
H2 A 0,21 86,63 40,00 338,86 53,64
H2 C 0,09 93,06 65,00 971,31 56,33
Shrubs SB A 0,14 91,39 22,00 599,56 56,40
SB C 0,13 91,20 24,00 672,62 55,89
Secondary Forest SF A 0,17 89,51 44,00 495,49 56,82
SF C 0,10 93,88 36,00 913,96 57,29
Source: Laboratory Analyze (2023) Note: A: Acrotelm C: Catotelm
Three land-use units (table 4) were obtained by overlaying the soil type map and land use at the research site. Soil sampling is based on the Acrotelm and Catotelm layers, with each sampling point assigned a code: H1, H2, SB, and SF. Each point denotes a distinct land use. H1 point is
78 INTENSIF: Jurnal Ilmiah Penelitian dan Penerapan Teknologi Sistem Informasi situated in the Horticulture area, located before the canal blocking, with an average groundwater level of 15.5 cm. The bulk density in the Acrotelm layer is 0.10 g/cm3 whilst those in the Catotelm layer is 0.07 g/cm3. [21] research also showed a bulk density value ranging from 0.08 g/cm3 to 0.16 g/cm3. The porosity for the Acrotelm layer is 93.5% and for the Catotelm layer it is 95.67%.
Meanwhile, the fiber content for the Acrotelm layer is 38.0% and for the Catotelm layer is 44.0%.
The fiber content value indicates the peat's maturity, which is hemic. The water content in the Acrotelm layer is 795.2% and in the Catotelm layer is 1346.37%, whereas the C-Organic content in the Acrotelm layers is 54,6% and Catotelm layers is 52.57%. [22] research also showed similar values for C-Organic, ranging from 52.92% to 56.39%. These values indicating the physical and chemical properties of the peat soil, which are influenced by the presence of canals. These results are consistent with previous.
Point H2 is situated in the Horticulture area, after the canal blocking, with an average groundwater level of 26 cm. The bulk density in the Acrotelm layer is 0.21 g/cm3 and in the Catotelm layer is 0.09 g/cm3. The bulk density in the [22] research also showed similar values of around 0.10 g/cm3 - 0.20 g/cm3. The Acrotelm layer has a porosity of 86.63% and the Catotelm layer has a porosity of 93.06%. The porosity in the [22] research ranged from 82.0% - 92%. The fiber content of the Acrotelm layer is 40.0% and in the Catotelm layer is 65.0%, indicates hemic peat maturity. The Acrotelm layer has a water content of 338.86% and the Catotelm layer is 971.31%. Similarly, the water content value in [22] research ranged from 359.4% to 846.4%.
Furthermore, the Acrotelm layer has a C-organic content of 53.64%, whereas the Catotelm layer has a C-organic content of 56.33%. [22] research also showed similar values for C-Organic, ranged from 52.92% to 56.39%. These values indicating the physical and chemical properties of the peat soil, which are influenced by the presence of canals. These results are consistent with previous.
Point SB is situated in the shrubs, before the canal blocking, with an average groundwater level of 18 cm. The bulk density for the Acrotelm layer measure 0.14 g/cm3 and in the Catotelm layer measure 0.13 g/cm3. The bulk density in the [22] research also showed similar values of around 0.10 g/cm3 - 0.20 g/cm3. The porosity of the Acrotelm layer is 91.39% and in the Catotelm layer is 91.20%. The porosity value in [23] research ranged from 91.70% to 92.63%. The fiber content of the Acrotelm layer is 22.0% and in the Catotelm layer is 24.0%, indicates sapric peat maturity. The water content in the Acrotelm layer is 599.56% and in the Catotelm layer is 672.62%. Furthermore, the Acrotelm layer has a C-organic content of 56.4%, whereas the Catotelm layer has a C-organic content of 55.89%. the C-Organic value in the [22] research ranged from 52.92% to 56.39%. The water content value in the same study ranged from 359.4%
INTENSIF: Jurnal Ilmiah Penelitian dan Penerapan Teknologi Sistem Informasi 79 to 846.4%. These values suggest that canal blocking has a significant impact on the physical and chemical properties of peat soil. These results are consistent with previous.
Point SF is situated in a Secondary Forest, the location without a canal obstruction with an average groundwater level of 12.3 cm. The bulk density in the Acrotelm is 0.17 g/cm³ while in the Catotelm is 0.10 g/cm³. The porosity in the Acrotelm layer is 89.51% and in the Catotelm layer is 93.88%. The fiber content of the Acrotelm layer is 44.0% and in the Catotelm layer is 36.0%, indicates hemic peat maturity. The water content in the Acrotelm layer is 495.94% and in the Catotelm layer is 913.96%. Furthermore, the Acrotelm layer has a C-organic content of 56.82%, whereas the Catotelm layer has a C-organic content of 57.29%. The bulk density in [24]
research also showed comparable values ranged from 0.05 g/cm3 to 0.12 g/cm3 and indicates a porosity value ranging from 84.99% to 99.95%. [25] research shows a C-Organic value ranged from 57.52% to 57.79%. [23] research reports a water content value of 532.95%. These values demonstrate the physical and chemical properties of peat soil, which remain consistent across multiple studies and are not affected by canal blocking.
B. Water Management Zone in Peatland
Water management zones are established based on four parameters of SLRG (Peatland Restoration Unit) which include Peat Ecosystem, Canalized Area, Burn Area, and Vegetation Density [26]. These parameters shape the zones and thus become a point of reference in water management on peatlands, and they are modified in each formed zone.
1. Peat Ecosystem Function
Peat ecosystem functions are coded (F). Peat ecosystem function class is obtained from peat depth data. Peatland ecosystems have dual functions: protection and cultivation. Peat with protection function has a depth >300 cm, while peat with cultivation function has a depth < 300 cm. Peatland ecosystem function map derived from peat depth data acquired via peat drilling.
80 INTENSIF: Jurnal Ilmiah Penelitian dan Penerapan Teknologi Sistem Informasi Fig 7. Peat Ecosystem Function Map
The study area (figure 7) with the peat ecosystem protection function encompasses three types of land use: Horticulture, Shrubs, and Secondary Forest. The area where peat ecosystems are cultivated is limited to Horticulture and Shrubs. The protection function area comprises 8.66 hectares (72.17%), while the cultivation function area is only 3.36 hectares (27.83%).
2. Burned Area
Burn area is coded (B). Fire areas can be observed based on the occurrence of land fires in the research location's history. The area has encountered land fires in 2015 and 2021, as per interviews conducted with farmer groups. The fire area is additionally identifiable through Google Earth images. The fire affected (here after referred to as ‘Burned’) land-use consisted of three sites that were burned down by fire within the last decade.
INTENSIF: Jurnal Ilmiah Penelitian dan Penerapan Teknologi Sistem Informasi 81 Fig 8. Burn Area
The burn area (figure 8) is determined by the occurrence of past land fires at the research location. Land fires were observed in both 2015 and 2021. A secondary forest area was affected by the fires in 2015. A subsequent fire in 2021 impacted all three land uses, namely horticulture, shrubs, and secondary forest.
3. Canalized Area
The process of creating maps of canalized areas is referred to Peraturan Kepala Badan Restorasi Gambut no. 4 tahun 2017 (Regulation of the Head of the Peat Restoration Agency no.
4 of 2017). Canalized area is coded (K). This map divides the peat ecosystem into canalized and non-canalized areas, with the canal area being determined by the coordinates of the canal's existence at the research location. The presence of the canal is related to restoration activities on peatlands. Restoration and management actions on land with canals may involve building canal blocks or filling canals. On land without canals, the focus can be on building deep wells. The decision on which direction to take should consider the function of the peat ecosystem on peatlands.
82 INTENSIF: Jurnal Ilmiah Penelitian dan Penerapan Teknologi Sistem Informasi Fig 9. Canalized Area Map
Canals (figure 9) are present in areas utilized for Horticulture, Shrubs, and Secondary Forest land uses. In the canals, Horticulture and Shrubs implement blocking while Secondary Forest does not use them.
4. Vegetation Density
According to field observations, Horticulture is characterized by moderate vegetation density due to the presence of crops such as chilies, tomatoes, basil, and long beans. Shrubs is characterized by high vegetation density resulting from the growth of closely spaced bushes, and Secondary Forest is characterized by high vegetation density, resulting from the close growth of acacia and bushes. Normalize Difference Vegetation Index is a reliable indicator of vegetation health and greenness [27]. A vegetation density map was created to analyse the vegetation density of the three land uses in the study site. This map is used for peatland restoration activities in the form of revegetation, which includes natural succession, enrichment palnting, and maximum pattern planting [28]. The activities are adjusted to the level of vegetation density on the peatland.
Vegetation density analysis (figure 10) using Normalized Difference Vegetation Index (NDVI) method [29]. The NDVI consistently generates original values ranging between -1 to +1.
Various land uses display distinct presentations of the original values resulting from the NDVI transformation [30].
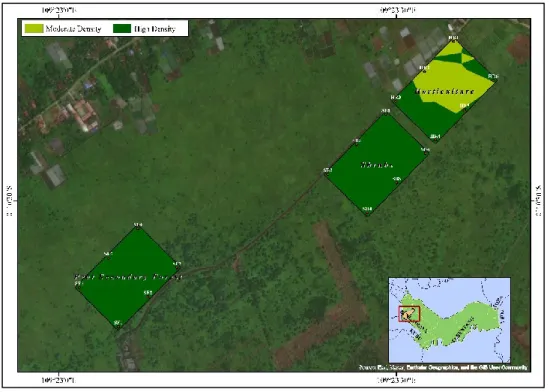
INTENSIF: Jurnal Ilmiah Penelitian dan Penerapan Teknologi Sistem Informasi 83 Fig 10. Vegetation Density Map
The range of Normalized Difference Vegetation Index (table 5) values and their corresponding classification categories are being referred to [31].
Table 5. Vegetation Density Classification
No Range of NDVI Vegetation Density Classification
1 -1 to -0.32 Non-Vegetation
2 -0.32 to 0.25 Low Vegetation
3 0.25 to 0.42 Moderate Vegetation
4 0.42 to 0.50 High Vegetation
5 0.50 to 1 Very High Vegetation
Source: Hanif, 2015
The Horticulture site has a vegetation density that is moderate density, with NDVI values of 0.25 to 0.37. The Shrubs site, has a high density with NDVI values of 0.45 to 0.57. The Secondary Forest site also presents a high density with NDVI values of 0.45 to 0.57, resulting in two distinct types of vegetation density observed at the research location. The area with moderate vegetation density covers 9.69 hectares, equivalent for 80.68% of the area. Meanwhile, the area with high density covers 2.32 hectares, equivalent to 19.31% of the total area.
The moderate vegetation index class encompasses the entire land surface covered mostly by plants in close proximity to buildings within a defined area. This category includes not only dominant plants, but also smaller plant species, as greenery is still a prevailing feature [32]. The high vegetation index class encompasses land covered mostly by dense vegetation and numerous shade trees, with both overlapping and separate canopies, resulting in scarce clusters of buildings [32].
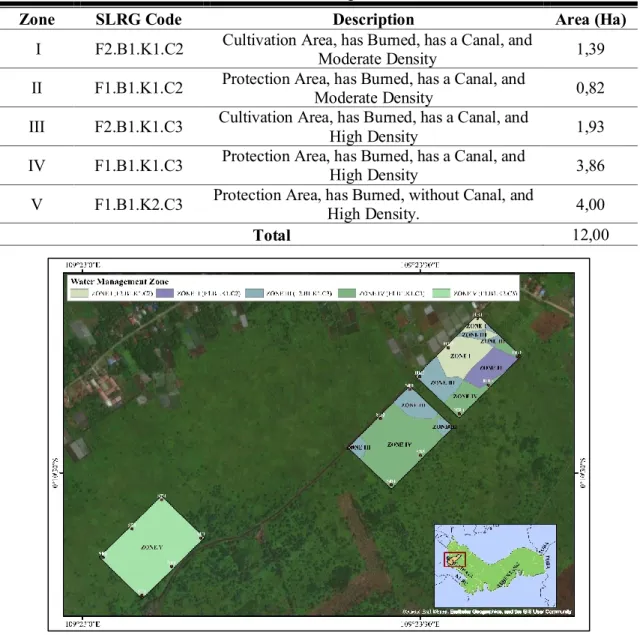
84 INTENSIF: Jurnal Ilmiah Penelitian dan Penerapan Teknologi Sistem Informasi According to the analysis table 6, the peatland water management zone in Limbung Village encompasses 5 distinct water management zones, denoted as Zone I (covering 1.39 ha), zone II (covering 0.82 ha), zone III (covering 1.93 ha), zone IV (covering 3.86 ha), and zone V (covering 4.00 ha). Each of these water management areas is associated with conservation activities aimed at preserving the quality of soil and water on peatlands. Zone I requires particular attention water management out of the five water management zones. This is due to its use for agricultural cultivation and its peat ecosystem cultivation function, which increases the risk of fire compared to a zone with a peat ecosystem protection function, which is a natural ecosystem.
Table 6. Water Management Zone
Zone SLRG Code Description Area (Ha)
I F2.B1.K1.C2 Cultivation Area, has Burned, has a Canal, and
Moderate Density 1,39
II F1.B1.K1.C2 Protection Area, has Burned, has a Canal, and
Moderate Density 0,82
III F2.B1.K1.C3 Cultivation Area, has Burned, has a Canal, and
High Density 1,93
IV F1.B1.K1.C3 Protection Area, has Burned, has a Canal, and
High Density 3,86
V F1.B1.K2.C3 Protection Area, has Burned, without Canal, and
High Density. 4,00
Total 12,00
Fig 11. Water Management Zone Map
Zone I (F2.B1.K1.C2) (figure 11), is a polygon area within the SLRG domain characterized by cultivated ecosystem function (F2), that has experienced fires (B1), has a canal (K1), and has a moderate vegetation density (C2). Zone I encompass area of horticulture.
INTENSIF: Jurnal Ilmiah Penelitian dan Penerapan Teknologi Sistem Informasi 85 Zone II (F1.B1.K1.C2) (figure 11), is a polygon area within the SLRG domain characterized by protected ecosystem function (F1), that has experienced fires (B1), has a canal (K1), and has a moderate vegetation density (C2). Zone II encompasses areas of horticulture land use. Zone III (F2.B1.K1.C3) (figure 11), is a polygon area within the SLRG domain characterized by cultivated ecosystem function (F2), that has experienced fires (B1), has a canal (K1) and has a high vegetation density (C3). Zone III encompasses areas of horticulture and shrubs. Zone IV (F1.B1.K1.C3) (figure 11), is a polygon area within the SLRG domain characterized by cultivated ecosystem function (F1), that has experienced fires (B1), has a canal (K1), and has a high vegetation density (C3). Zone IV encompasses areas of horticulture, shrubs, and secondary forests. Zone V (F1.B1.K2.C3) (figure 11), is a polygon area within the SLRG domain characterized by cultivated ecosystem function (F1), that has experienced fires (B1), does not have canal (K2), and has a high vegetation density (C3). Zone V encompass area of secondary forest.
C. Restoration Strategy for Each Water Management Zone
Based on the identification of Satuan Lahan Restorasi Gambut (SLRG) (Peat Restoration Land Unit) in the research location, peatland management is adapted to each zone formed. The restoration approach implemented by Badan Restorasi Gambut (Peatland Restoration Agency) involves the 3R activities, which are Hydrological Restoration (Rewetting), Vegetation Restoration (Revegetation), and Revitalisation of local livelihoods.
Peatland restoration is a nature-based solution that can transform degraded peatlands from a net source of CO2 to a net sink in about 20 years[33], [34]. Recent studies have also shown that peatland restoration can mitigate climate change [35], increase water storage [36], and reduce the severity of wildfires [37]. This statement aligns with [38] research, which indicates that restoration has significantly impacted the hydrology of peatland headwater catchments, resulting in notable alterations in water table depth, runoff production, and storm flow behaviour.
Hydrological restoration enables the rewetting of peatlands to decrease the risk of forest fires and create optimal soil conditions for vegetation growth. The primary objective of rewetting was to decrease the occurrence of peat fires. [39]Research results indicate that restoration can significantly reduce both the number and size of peat fires compared to all wildfires in the Moscow region, particularly during the extreme fire years such as 2002 and 2010. The restoration of vegetation is achieved by replanting native species in both forest and peat swamp areas.
Unfortunately, the cultivation techniques for local trees often result in low success rates [40].
Among these three approaches, Rewetting and Revegetation activities will be the focus of this research. Canal blocking, canal backfilling and deep wells can be used for rewetting, while natural succession, enrichment planting and maximum pattern planting can be used for revegetation.
86 INTENSIF: Jurnal Ilmiah Penelitian dan Penerapan Teknologi Sistem Informasi Hydrological restoration involves rewetting and blocking or even closing drainage canals in protected areas to prevent further damage. This aims to reinstate the original hydrology of the peat swamp ecosystem and bring it back to its natural state. It is essential to follow up the hydrological restoration with vegetation restoration [41]. Revegetation aims to reinstate land cover in peat ecosystems by establishing native plant species with protective functions, or alternative plant species that are adaptable to wetlands and offer economic value through cultivation. Such activities are complex, as they seek to establish long-term survival of the planted vegetation [42].
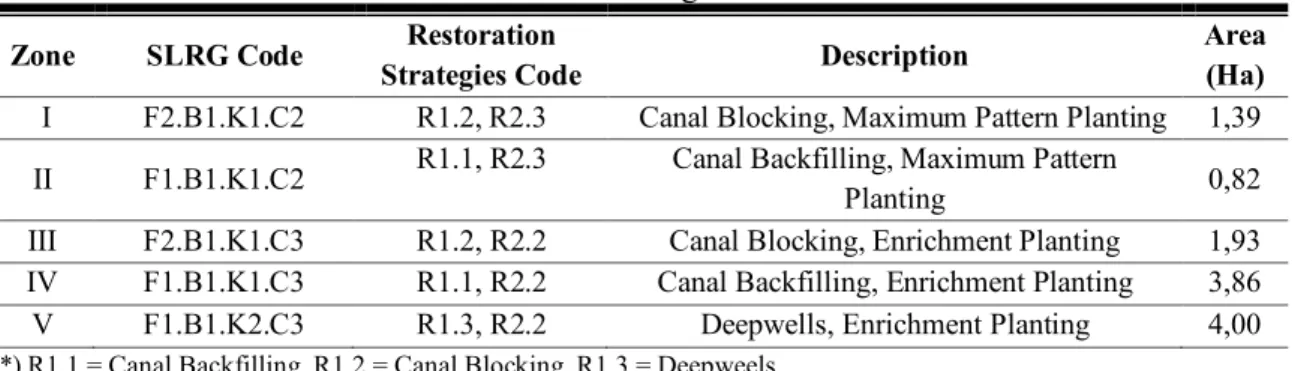
Table 7. Restoration Strategies for each zones Zone SLRG Code Restoration
Strategies Code Description Area
(Ha) I F2.B1.K1.C2 R1.2, R2.3 Canal Blocking, Maximum Pattern Planting 1,39 II F1.B1.K1.C2 R1.1, R2.3 Canal Backfilling, Maximum Pattern
Planting 0,82
III F2.B1.K1.C3 R1.2, R2.2 Canal Blocking, Enrichment Planting 1,93 IV F1.B1.K1.C3 R1.1, R2.2 Canal Backfilling, Enrichment Planting 3,86
V F1.B1.K2.C3 R1.3, R2.2 Deepwells, Enrichment Planting 4,00
(*) R1.1 = Canal Backfilling, R1.2 = Canal Blocking, R1.3 = Deepweels
(*) R2.1 = Natural Succession, R2.2 = Enrichment Palnting, R2.3 = Maximum Pattern Planting
Management activities in Zone I (F2.B1.K1.C2) (table 7), can be conducted through canal blocking and maximum pattern planting. Sealing a ditch or canal involves creating barriers to retain water within it. The objective of this activity is to prevent water from escaping the ditch or canal [43]. Canal blocking is employed on peat layers < 300 cm deep, on all peatlands that have been developed, in order to optimise rewetting. The objective of canal blocking is to enhance water retention in the canal body and regulate water levels so that they remain no more than 40 cm from the peat surface, in accordance with relevant regulations [8]. The maximum pattern planting is implemented in areas with low vegetation cover, such as Zone I, which has low vegetation cover. The approach aims to revive extensively impaired peatlands with minimal ground cover [28].
Management activities in Zone II (F1.B1.K1.C2) (table 7), can be conducted through canal backfilling and maximum pattern planting. The purpose of canal backfilling is to prevent excessive water loss from the peatland by closing or blocking canals in the peatland ecosystem protection function. Canal backfilling takes place in the protected and canalised regions, while avoiding cultivated areas [44]. Maximum pattern planting is implemented in zones with a low vegetation cover, such as Zone II, which has open vegetation cover. The restoration of heavily damaged peatlands with low land cover utilises a maximum planting pattern [28].
INTENSIF: Jurnal Ilmiah Penelitian dan Penerapan Teknologi Sistem Informasi 87 Management activities in Zone III (F2.B1.K1.C3) (table 7), can be conducted through canal blocking and enrichment planting. Sealing a ditch or canal involves creating barriers to retain water within it. The objective of this activity is to prevent water from escaping the ditch or canal [43]. To optimise the rewetting process, canal blocking is implemented on peatlands with a thickness of less than 300 cm that have already been developed [8]. Canal blocking is intended to increase water retention in the canal body and maintain the water regime, ensuring that it does not exceed 40 cm above the peat surface in compliance with relevant regulations. Enrichment planting involves planting natural seedlings that are native to peatlands, but are not present in a degraded peatland so as to accelerate the recovery of the peat swamp forest ecosystem, ensuring that the target rate of natural youth sufficiency is met [28]. Enrichment is performed by planting suitable seedlings in areas where they are not currently represented, thus accelerating ecosystem recovery.
Management activities in Zone IV (F1.B1.K1.C3) (table 7), can be conducted through canal backfilling and enrichment planting. Canal backfilling targets the protection function of the peat ecosystem, by closing or blocking canals to prevent excessive water drainage from the peatland.
The canal backfilling activity is limited to protected areas and canals. Enrichment planting involves planting native peat seedlings in degraded peatlands to expedite the recovery of the peat swamp forest ecosystem and achieve the desired level of natural youth sufficiency [28]. Enrichment is performed by planting suitable seedlings in areas where they are not currently represented, thus accelerating ecosystem recovery.
Management activities in Zone V (F1.B1.K2.C3) (table 7), can be conducted through the deepwells and enrichment planting. The primary objective of deepwells construction is to mitigate the paucity of surface water resources that typically arises during the arid season [45]. Deepwells are utilized to restore moisture to arid peatlands by pumping reserves of groundwater from the aquifer and distributing it over the areas lacking wetness and moisture, particularly during the dry season. Furthermore, in the case of local forest or peatland fires, they can serve as a source of water for firefighting efforts [13]. Enrichment planting involves planting native peat seedlings in degraded peatlands to expedite the recovery of the peat swamp forest ecosystem and achieve the desired level of natural youth sufficiency [28]. Enrichment is performed by planting suitable seedlings in areas where they are not currently represented, thus accelerating ecosystem recovery.
IV.CONCLUSION
The protection and restoration of peatlands are crucial measures towards sustaining environmental stability, global climate health, and the wellbeing of human life and nearby ecosystems. Drained peatlands are prone to fires that are challenging to quell and such peat fires
88 INTENSIF: Jurnal Ilmiah Penelitian dan Penerapan Teknologi Sistem Informasi can emit fumes and fluids that are detrimental to human health while causing environmental degradation. The research site comprises five water management zones. Zone I covering a management area of 1.39 ha, Zone II covering 0.82 ha, Zone III covering 1.93 ha, Zone IV covering 3.86 ha, and Zone V covering 4.00 ha. In areas where the peat ecosystem protection function is present, peatland restoration management activities can be conducted through canal backfilling by closing or blocking canals in Zone II, Zone IV, and Zone V. Restoring peatlands in Zone I and Zone III of the peat ecosystem cultivation function can be conducted by blocking canals. Revegetation techniques depend on the vegetation density. In areas with low vegetation densities, such as zone I and zone II, maximizing pattern planting is an effective approach.
Peatland restoration management activities involving revegetation in moderate vegetation areas such as zones III, IV, and V may include enrichment planting as a form of replanting.
REFERENCES
[1] S. Ritung, Wahyunto, and K. Nugroho, Peta Lahan Gambut Indonesia Skala 1:250.000.
2011. [Online]. Available: http://bbsdlp.litbang.deptan.go.id
[2] J. Xu, P. J. Morris, J. Liu, and J. Holden, “PEATMAP: Refining estimates of global peatland distribution based on a meta-analysis,” Catena (Amst), vol. 160, pp. 134–140, 2018, doi: 10.1016/j.catena.2017.09.010.
[3] S. Treby and S. P. Grover, “Carbon emissions from Australian Sphagnum peatlands increase with feral horse (Equus caballus) presence,” J Environ Manage, vol. 347, Dec.
2023, doi: 10.1016/j.jenvman.2023.119034.
[4] I. Las, M. Sarwani, A. Mulyani, and M. F. Saragih, “Dilema dan Rasionalisasi Kebijakan Pemanfaatan Lahan Gambut untuk Areal Pertanian,” Bogor, 2012.
[5] D. A. Suriadikarta, “Teknologi Pengelolaan Lahan Rawa Berkelanjutan: Studi Kasus Kawasa EX PLG Kalimantan Tengah,” Jurnal Sumberdaya Lahan, vol. 6, no. 1, pp. 45–
54, Jul. 2012.
[6] Masganti, K. Anwar, and M. A. Susanti, “Potensi dan Pemanfaatan Lahan Gambut Dangkal untuk Pertanian,” Jurnal Sumberdaya Lahan, vol. 11, no. 1, pp. 43–52, Jul. 2017.
[7] Masganti, Wahyunto, A. Dariah, Nurhayati, and R. Yusuf, “Karakteristik dan Potensi Pemanfaatan Lahan Gambut Terdegradasi di Provinsi Riau,” Jurnal Sumberdaya Lahan , vol. 8, no. 1, pp. 59–66, Jul. 2014.
[8] Kementerian Lingkungan Hidup dan Kehutanan, Pemulihan Ekosistem Gambut. 2015.
[9] K. Fikri, “Pengelolaan Tata Air Lahan Gambut Berkelanjutan,” Prosiding Seminar Nasional 2 Quo Vadis Restorasi Gambut di Indonesia: Tantangan & Peluang Menuju Ekosistem Gambut Berkelanjutan, pp. 182–187, Oct. 2022.
[10] S. M. Napitupulu and B. Mudiantoro, “Pengelolaan Sumber Daya Air Pada Lahan Gambut Yang Berkelanjutan,” Annual Civil Engineering Seminar, pp. 330–337, 2015.
[11] E. Runtunuwu, B. Kartiwa, K. Kharmilasari, K. Sudarman, W. T. Nugroho, and A.
Firmansyah, “Dinamika Elevasi Muka Air Pada Lahan dan Saluran Di Lahan Gambut,”
Jurnal Riset Geologi dan Pertambangan, vol. 21, no. 1, p. 63, Dec. 2011, doi:
10.14203/risetgeotam2011.v21.47.
[12] C. Buschmann et al., “Perspectives on agriculturally used drained peat soils: Comparison of the socioeconomic and ecological business environments of six European regions,”
Land use policy, vol. 90, Jan. 2020, doi: 10.1016/j.landusepol.2019.104181.
INTENSIF: Jurnal Ilmiah Penelitian dan Penerapan Teknologi Sistem Informasi 89 [13] A. Dohong, Lola Cassiophea, and B. L. Triadi, Modul Pelatihan: Pembangunan Infrastruktur Pembasahan Gambut Sekat Kanal Berbasis Masyarakat. 2017. [Online].
Available: www.brg.go.id;
[14] H. Ritzema, S. Limin, K. Kusin, J. Jauhiainen, and H. Wösten, “Canal blocking strategies for hydrological restoration of degraded tropical peatlands in Central Kalimantan, Indonesia,” Catena (Amst), vol. 114, pp. 11–20, Mar. 2014, doi:
10.1016/j.catena.2013.10.009.
[15] S. Budiharta, E. Meijaard, J. A. Wells, N. K. Abram, and K. A. Wilson, “Enhancing feasibility: Incorporating a socio-ecological systems framework into restoration planning,”
Environ Sci Policy, vol. 64, pp. 83–92, Oct. 2016, doi: 10.1016/j.envsci.2016.06.014.
[16] S. Budiharta et al., “Restoration to offset the impacts of developments at a landscape scale reveals opportunities, challenges and tough choices,” Global Environmental Change, vol.
52, pp. 152–161, Sep. 2018, doi: 10.1016/j.gloenvcha.2018.07.008.
[17] T. Santika et al., “Interannual climate variation, land type and village livelihood effects on fires in Kalimantan, Indonesia,” Global Environmental Change, vol. 64, p. 102129, Sep. 2020, doi: 10.1016/j.gloenvcha.2020.102129.
[18] Suyanto and Y. Nugroho, “Zonasi Tinggi Muka Air Tanah Gambut di Kawasan Hutan Lindung Liang Anggang Kota Banjarbaru Kalimantan Selatan,” Prosiding Seminar Nasional Lingkungan Lahan Basah , vol. 6, 2021.
[19] Kementerian Lingkungan Hidup dan Kehutanan, “Peraturan Menteri Lingkungan Hidup Dan Kehutanan Republik Indonesia Nomor P.16/Menlhk/Setjen/Kum.1/2/2017 Tentang Pedoman Teknis Pemulihan Fungsi Ekosistem Gambut,” 2017.
[20] F. Agus and I. G. M. Subiksa, Lahan Gambut: Potensi untuk Pertanian dan Aspek Lingkungan. 2008. [Online]. Available: http://www.icraf.cgiar.org/sea
[21] A. L. Sinclair et al., “Effects of distance from canal and degradation history on peat bulk density in a degraded tropical peatland,” Science of The Total Environment, vol. 699, p.
134199, Jan. 2020, doi: 10.1016/j.scitotenv.2019.134199.
[22] L. P. Triatmojo, “Kualitas dan Kesuburan Lahan Gambut Pada Kawasan Gambut Bersekat di Kabupaten Kubu Raya,” Universitas Tanjungpura, Pontianak, 2022.
[23] R. W. Nusantara, R. Manurung, U. Lestari, and S. Pandagi, “Dampak Sekat Kanal Terhadap Fluktuasi Muka Air Tanah pada Lahan Gambut di Kabupaten Kubu Raya – Provinsi Kalimantan Barat,” Jurnal Ilmu Lingkungan, vol. 21, no. 2, pp. 393–402, 2023.
[24] M. Wang, H. Liu, and B. Lennartz, “Small-scale spatial variability of hydro-physical properties of natural and degraded peat soils,” Geoderma, vol. 399, p. 115123, Oct. 2021, doi: 10.1016/j.geoderma.2021.115123.
[25] R. D. Putra, R. W. Nusantara, and R. Manurung, “KARAKTERISTIK SIFAT KIMIA TANAH PADA LAHAN GAMBUT BERSEKAT KANAL DI DESA KUBU PADI KABUPATEN KUBU RAYA,” Jurnal Sains Pertanian Equator, vol. 12, no. 3, p. 640, Jul. 2023, doi: 10.26418/jspe.v12i3.64780.
[26] Badan Restorasi Gambut,
Rencana_Restorasi_Ekosistem_Gambut_RREG_Sumatera_Selatan_Tahun_2017_- _2021. 2019.
[27] C. Wang, A. Wang, D. Guo, H. Li, and S. Zang, “Off-peak NDVI correction to reconstruct Landsat time series for post-fire recovery in high-latitude forests,” International Journal of Applied Earth Observation and Geoinformation, vol. 107, p. 102704, Mar. 2022, doi:
10.1016/j.jag.2022.102704.
[28] D. Sitepu and Alue. Dohong, Modul Pelaksanaan Kegiatan Revegetasi di Lahan Gambut.
2019.
[29] M. A. Lasaiba and A. W. Saud, “Pemanfaatan Citra Landsat 8 OLI/TIRS Untuk Identifikasi Kerapatan Vegetasi Menggunakan Metode Normalized Difference
90 INTENSIF: Jurnal Ilmiah Penelitian dan Penerapan Teknologi Sistem Informasi Vegetation Index (NDVI) Di Kota Ambon,” Jurnal Geografi dan Pengajarannya, vol. 20, no. 1, pp. 53–65, Jun. 2022.
[30] D. K. Sunaryo and M. Z. Iqmi, “Pemanfaatan Citra Landsat 8 untuk Pendeteksian dan Mengetahui Hubungan Kerapatan Vegetasi Terhadap Suhu Permukaan,” Spectra, vol.
XIII, pp. 55–72, 2015.
[31] M. Hanif, Bahan Pelatihan Penginderaan Jauh Tingkat Lanjut. 2017. [Online]. Available:
http://nasa.gov
[32] A. Khairawan, Ermanita, and N. Falih, “Analisis Perubahan Indeks Kerapatan Vegetasi Memanfaatkan Citra Landsat (Studi Kasus : Provinsi DKI Jakarta),” Seminar Nasional Mahasiswa Ilmu Komputer dan Aplikasinya (SENAMIKA) , pp. 62–72, Aug. 2020.
[33] K. A. Nugent, I. B. Strachan, M. Strack, N. T. Roulet, and L. Rochefort, “Multi‐year net ecosystem carbon balance of a restored peatland reveals a return to carbon sink,” Glob Chang Biol, vol. 24, no. 12, pp. 5751–5768, Dec. 2018, doi: 10.1111/gcb.14449.
[34] K. A. Nugent, I. B. Strachan, N. T. Roulet, M. Strack, S. Frolking, and M. Helbig,
“Prompt active restoration of peatlands substantially reduces climate impact,”
Environmental Research Letters, vol. 14, no. 12, p. 124030, Dec. 2019, doi:
10.1088/1748-9326/ab56e6.
[35] M. Helbig et al., “The biophysical climate mitigation potential of boreal peatlands during the growing season,” Environmental Research Letters, vol. 15, no. 10, p. 104004, Oct.
2020, doi: 10.1088/1748-9326/abab34.
[36] H. Liu, F. Rezanezhad, and B. Lennartz, “Impact of land management on available water capacity and water storage of peatlands,” Geoderma, vol. 406, p. 115521, Jan. 2022, doi:
10.1016/j.geoderma.2021.115521.
[37] G. Granath, P. A. Moore, M. C. Lukenbach, and J. M. Waddington, “Mitigating wildfire carbon loss in managed northern peatlands through restoration,” Sci Rep, vol. 6, no. 1, p.
28498, Jun. 2016, doi: 10.1038/srep28498.
[38] E. L. Shuttleworth et al., “Restoration of blanket peat moorland delays stormflow from hillslopes and reduces peak discharge,” J Hydrol X, vol. 2, Jan. 2019, doi:
10.1016/j.hydroa.2018.100006.
[39] A. A. Sirin, M. A. Medvedeva, D. A. Makarov, A. A. Maslov, and H. Joosten,
“Multispectral satellite based monitoring of land cover change and associated fire reduction after large-scale peatland rewetting following the 2010 peat fires in Moscow Region (Russia),” Ecol Eng, vol. 158, Dec. 2020, doi: 10.1016/j.ecoleng.2020.106044.
[40] A. Jaya, E. U. Antang, C. Birawa, and H. Gunawan, “Pengembangan Agroekowisata Terintegrasi di Lahan Gambut di Kalimantan Tengah,” Jurnal Pengabdian Kampus, vol.
8, no. 1, pp. 26–42, Jul. 2021.
[41] L. B. Triadi, “Restorasi Lahan Rawa Gambut Melalui Metode Pembasahan (Sekat Kanal) Dan Paludikultur,” Jurnal Sumber Daya Air, vol. 16, no. 2, pp. 103–118, Nov. 2020, doi:
10.32679/jsda.v16i2.677.
[42] S. Soniati, N. Rohima, and D. Larasanti, “Restorasi Gambut Melalui Partisipasi Masyarakat Dan Revegetasi,” Prosiding Seminar Nasional 2 Quo Vadis Restorasi Gambut di Indonesia: Tantangan & Peluang Menuju Ekosistem Gambut Berkelanjutan, pp. 282–287, Oct. 2022.
[43] Y. Rochmayanto, D. Priatna, and Ari. Wibowo, Restorasi Ekosistem Hutan Rawa Gambut. 2021.
[44] Norhalimah, M. Ruslan, and Suyanto, “Analisis Tinggi Muka Air Tanah Dan Pemetaannya Di Lahan Gambut Kawasan Hutan Lindung Liang Anggang Kalimantan Selatan,” Jurnal Sylva Scienteae, vol. 04, no. 4, Aug. 2021.
[45] N. Anggita, “Analisis Value for Money Pada Pembangunan Sumur Bor Di Dinas Lingkungan Hidup dan Pertanahan Provinsi Sumatera Selatan Tahun Anggaran 2018,”
pp. 1–72, 2021.