WSN 135 (2019) 261-282 EISSN 2392-2192
Implementation of Big Data Concept for Variability Mapping Control of Financing Assessment of
Informal Sector Workers in Bogor City
Salmah1,*, Fredi Andria1, Irfan Wahyudin2
1Department of Management, Faculty of Economics, Pakuan University, Bogor, Jawa Barat, Indonesia
2Department of Computer Science, Faculty of Mathematics and Natural Sciences, Pakuan University, Bogor, Jawa Barat, Indonesia
*E-mail address: [email protected]
ABSTRACT
At present risks and uncertainties occur in protecting health for the community. This requires a national health insurance program that can guarantee health care costs. One of the program participants is a resident who works in the informal sector. This group is vulnerable as well as the potential for the implementation of health insurance programs. However, the level of participation of informal sector workers is still low, so an analysis of the constraints affecting it is needed. This study aims to identify categories of informal sector workers and analyze various obstacles faced by informal sector workers to become health insurance participants in the city of Bogor. The method used is the concept of big data with K-means clustering data mining techniques to group informal sector workers along with the constraints that exist in each of these groups. The results showed that there were 3 clusters with very low Social Security Administrator (BPJS) health ownership, namely cluster 1, cluster 3, and cluster 5.
Each cluster had different constraints. Cluster 1 has constraints on the number of dependents it has, Cluster 3 has constraints on the gender side that are dominated by women, while Cluster 5 has constraints on the low-income side. Each cluster has a different obstacle resolution recommendation, namely for cluster 1 by registering workers in JKN contribution recipient (PBI) participants, cluster 2 by giving outreach to women who have only focused on men, and for clusters 5 by involving the community as a forum for the empowerment of informal sector workers.
Keywords: Big Data, Cluster, K-Means Clustering, Informal Worker Sector
1. INTRODUCTION
The National Health Insurance (JKN) is a social security program that guarantees the cost of health care and fulfillment of basic health needs nationally carried out jointly by all Indonesians by paying regular contributions or paying dues to the government to nonprofit health insurance administrators (Article summary and paragraph constitution number 40 of 2004) [1].
The JKN program is expected to provide health insurance protection for all Indonesian people so that the risks and uncertainties that might occur in protecting the health of the community can be minimized.
To provide protection for health insurance, it is necessary to recognize the distribution of groups in the community that will later be included in the JKN program. JKN participants are divided into two main groups, namely the Fee Beneficiary (PBI) and Non-Contribution Aid Recipients (Not PBI). PBI includes people who are classified as poor and poor people, while not PBI consists of:
1) Wage Recipient Workers and their family members who are commonly called formal workers.
2) Workers Not Recipients of Wages and family members commonly referred to as informal workers.
3) Not a worker and family member.
4) Pension Recipients [2].
According to BPS data as of February 2018, the number of people working in the informal sector is 73.98 million people or 58.22%. This group is a vulnerable group as well as a potential for the implementation of social welfare insurance, because their work is full of uncertainty, high risk, and has not been protected through various social security schemes. This condition shows that the ability of informal workers still needs assistance in the form of health insurance, which can be formulated through certain schemes based on the boundaries of each region.
Bogor City is a city has a very high population density there are of 8.7 million people.
The number of informal workers in the Bogor city reached more than 47% but the level of participation in the JKN program administered by Social Security Administrator (BPJS) Health was still low at only 36%. The results of the study [3] show that as many as 73% of respondents have special funds which are deliberately set aside in case of emergencies or just in case when sick. As many as 23.3% were only able to set aside reserve funds when they were sick for less than Rp. 100,000 - only.
Many other factors certainly cause the reason for the low level of participation in health insurance for informal sector workers in Bogor city [4]. Various variability of problems and constraints must be identified to find optimal solutions and strategies in the field so that the government's target to increase the participation rate of health insurance in the informal sector can increase significantly, especially informal sector workers in Bogor city.
Based on the problems, a comprehensive study is needed to mapping various obstacles found [5]. Through a study of the implementation of the big data concept mapped various constraints on financing health insurance for informal sector workers in Bogor city, so that the variability of existing constraints can be seen, and these constraints are expected to be grouped in an effort to increase health insurance participation in informal sector workers in Bogor city.
2. BASIC CONCEPTS
The National Health Insurance (JKN) which developed in Indonesia is part of the National Social Security System (SJSN). The National Social Security System is organized through a mandatory social health insurance mechanism based on constitution No. 40 of 2004 concerning the National Social Security System. The aim is so that all Indonesians are protected in the insurance system so that they can meet the basic needs of proper public health [1].
JKN participants are applied to everyone, including foreigners working in Indonesia for at least 6 (six) months in Indonesia, who have paid contributions. Participants are entitled to JKN benefits. To continue to obtain health service guarantees, participants must pay JKN contributions regularly and continuously until the end of their lives. JKN participants are divided into two main groups, namely: JKN Beneficiary Benefit (PBI) and Not JKN PBI.
Contribution Beneficiaries receive subsidies for JKN contributions from the Government. Non- contribution contribution recipients must pay JKN contributions by themselves or together with their employers [6, 7].
Research conducted by [8] shows that Nigeria has a community-based health insurance (CBHI) model that synergizes with the National Health Insurance Scheme (NHIS). The CHBI scheme has been socialized through the SSA program but shows various shortcomings and failures. Except in Ghana and Rwanda, which has effectively implemented the scheme through intensive government support and control. Factors that influence the failure of this scheme include the lack of a strong legislative framework in support of legality, and bureaucracy and unrealistic registration procedures. As a result, there appears to be self-confidence from the informal workers’ community to take advantage of this scheme. [9] proposed the concept of voluntary health care insurance (VHCI) which was tested in the state of Penang, Malaysia. The results showed that more than 63.1% of respondents were willing to join and contribute to this scheme. The amount of the agreed contribution is $114.38 per month per household. This study included people with different ethnicities, education levels, monthly household income, chronic illnesses, and insurance coverage. The seriousness of government support in technical managerial, financial guarantees, information on disease costs, transparency and offer of benefits packages that are clearly a factor that will realize the system so that it can be sustainable [10].
According to [11] the informal economy consists of marginalized economic units and workers who have characteristics: deficits in decent work, deficits in labor standards, deficits in productivity and quality of work, deficits in social protection and deficits in terms of organization and voting rights. Furthermore [12], said that based on employment categories, the informal economy can be described through the following types of jobs:
1) Self-employed workers, for example, are own-account workers, family business leaders, and unpaid family workers.
2) Salaried workers, for example, employees of informal companies, temporary workers without permanent employers, homeworkers, paid household servants, temporary and part-time workers, and unregistered workers.
3) Employers, for example, company owners and owners who run informal businesses.
Data mining is the process of finding meaningful new correlations, patterns, and trends by sorting through large amounts of data stored in the repository, using pattern reasoning technology as well as statistical and mathematical techniques [13-15]. There are many data
mining techniques that can be used, including K-Means clustering, Hierarchical clustering, DBS can if the main purpose is to classify data that is not known to the target class, and if the target data is known, algorithms such as Naïve Bayes, Decision Tree can be used, and Artificial Neural Network [16, 17]. There are several other things related to data mining, including Statistics, Machine Learning as described above, Data Visualization, and Database Management [18-20].
K-means is a distance-based clustering method that divides data into a number of clusters and this algorithm only works on numeric attributes. K-means tries to partition existing data into one or more clusters or groups so that data that has the same characteristics are grouped into one and the same cluster and data that has different characteristics are grouped into other groups [21; 22]. The K-means algorithm basically performs two processes, namely the process of detecting the central location of each cluster and the process of searching members from each cluster. The workings of the K-means algorithm:
1) Determine k as the number of clusters that want to be formed.
2) Awaken the initial centroid (cluster center point) randomly.
3) Calculate the distance of each data to each centroid.
4) Each data selects the closest centroid.
5) Determine the position of the new centroid by calculating the average value of the data located on the same centroid.
6) Return to step 3 if the position of the new centroid with the old centroid is not the same [4].
3. METHOD
Complete stages of research are as follows:
1) Data Collection. The data used in this study is secondary data, namely data obtained by researchers indirectly but obtained from data providers such as mass media, companies, stock exchanges, and others. As for this study, the data used by the author comes from the data used by previous research conducted by one of the lecturers at the Faculty of Economics, Pakuan University. Data collection techniques were carried out through interviews, questionnaires obtained from previous studies [23] and literature studies.
2) Formulation and identification of problems. Based on secondary data that has been obtained, the formulation and identification of existing problems are carried out by looking at the variables in the questionnaire that have been distributed.
3) Processing questionnaire data using the statistical package for social sciences (SPSS) version 20.0. The analysis is carried out through frequency tabulation, namely the process of calculating the frequency that is spelled out on the respondent's answers in the questionnaire into each category. Through this analysis, an overview of the profiles of respondents in the informal sector and the informal sector workers in Bogor city was obtained.
4) Processing data with clustering techniques. The technique used in this study is K-means clustering, which is a distance-based clustering method that divides data into a number of clusters and this algorithm only works on numeric attributes [24, 25].
5) Stages of the K-Means algorithm [14, 26] is explained through the following pseudo- code:
a. Initiation of cluster centroids as much as k: 𝜇1, 𝜇2, 𝜇3, ⋯ , 𝜇𝑘
b. Repeat the following stages until conditions are found where, the position of the item at the last stage, in each cluster, converges to the previous stage
[https://stanford.edu/~cpiech/cs221/handouts/kmeans.html]:
For each item to x, determine the closest centroid c:
𝑐(𝑖) ≔ arg 𝑚𝑖𝑛𝑗‖𝑥(𝑖)− 𝜇𝑗‖2 (1)
Figure 1. Stages of Data Processing with K-Means Clustering
Determination of the closest centroid c, using Euclidean Distance
𝑑(𝑥, 𝑐) = √∑2 𝑚𝑖=1(𝑥𝑖 − 𝑐𝑖)2 (2) For each cluster j, determine the latest position of centroid c, by calculating the total distance of the average cluster member, that is μ:
𝜇
𝑗: =
∑𝑚𝑖=11{𝑐𝑖=𝑗}𝑥(𝑖)∑𝑚𝑖=11{𝑐𝑖=𝑗} (3)
6) Stages of data processing with K-means clustering [23, 24] shown in the image below Figure 1.
4. RESULT AND EXPLANATION
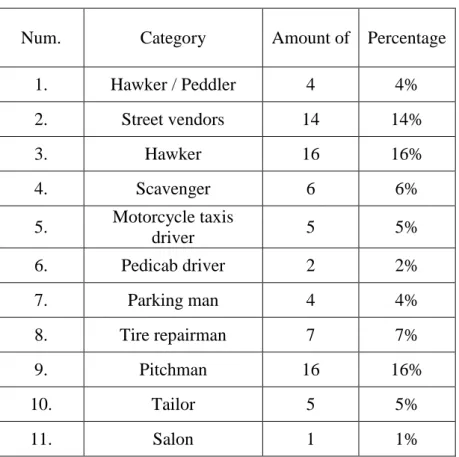
The number of respondents in this study was 100 people, spread over six sub-districts namely Bogor Barat, Bogor Timur, Bogor Utara, Bogor Tengah, Bogor Selatan, and Tanah Sareal. Based on data from 100 respondents showed variations in the profession involved by informal sector workers in Bogor city. Where there are 20 types of professionals of the informal sector workers (see on Table 1.)
Table 1. Respondent Data by Profession
Num. Category Amount of Percentage
1. Hawker / Peddler 4 4%
2. Street vendors 14 14%
3. Hawker 16 16%
4. Scavenger 6 6%
5. Motorcycle taxis
driver 5 5%
6. Pedicab driver 2 2%
7. Parking man 4 4%
8. Tire repairman 7 7%
9. Pitchman 16 16%
10. Tailor 5 5%
11. Salon 1 1%
12. Rent House Owner 2 2%
13. Janitor 1 1%
14. Drink seller 6 6%
15. Copy servicer 1 1%
16. Retail Gasoline seller 1 1%
17. Service Seller 3 3%
18. Food seller 4 4%
19. Cloth seller 1 1%
20. Barber Shop 1 1%
Source: questionnaire data, processed in 2019
The group data by category shows the results in Table 2. A total of 62 respondents were included in the category of small traders, and 38 respondents were included in the category of service sellers.
Table 2. Respondents Data by Professional Category
Number Category Amount of Percentage
1. Small Trader 62 62%
2. Service Seller 38 38%
3. Farmer and breeder 0 0
Source: questionnaire data, 2019
Then the data is processed using the clustering method, with the following stages;
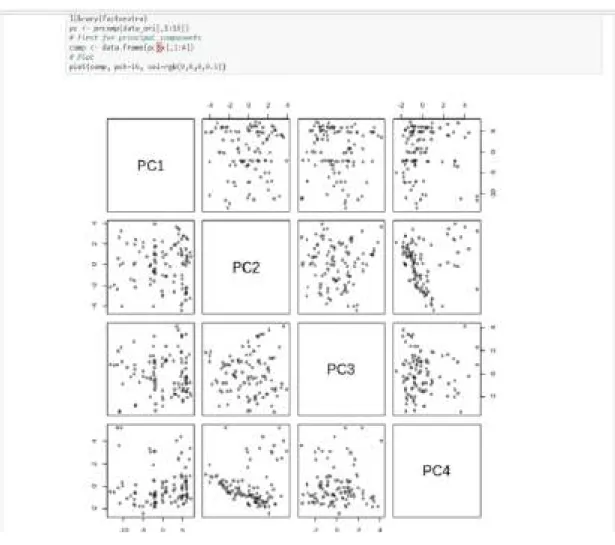
1) Clustering Step 1 - Principal Component Analysis
Principal component analysis (PCA) is used to extract and only use important components to be used in the next clustering process. PCA is calculated by first calculating the covariance matrix C
𝐶 = 1
𝑁−1𝑋𝑇𝑋 (4)
where X is a matrix formed from questionnaire data, and N is the number of attributes (questionnaire questions). Then, from this C covariance matrix, we look for the main components which are representations of eigenvector v, from the following equation:
𝐴𝑣 = 𝜆𝑣 (5) where A is the covariance matrix C, and λ is the eigenvalue. From these calculations, we take two main components as the x, and y axes for cluster visualization as below.
Figure 2. Clustering Process Step 1
2) Clustering Step 2 - K-Means
The first step at this stage is to determine the number of clusters. Determining the number of clusters is done using the ElBow technique, seen from the picture below for K = 6, SSE tends to start decreasing the difference for the next K, so it can be concluded that the number of clusters that are suitable for this study is 6. After obtaining 6 clusters, then all the data is allocated to the closest cluster. Proximity is determined based on the distance of the two data and the proximity of a data to a particular cluster is determined by the distance between the data to each cluster center. The closest distance between one data and one particular cluster will determine which data is entered in which cluster [26, 30, 31]. With clustering technique obtained 6 clusters of employees overview informal sector workers in the city of Bogor. Each
cluster illustrates the informal sector worker conditions under different conditions, according to the similarities present in some indicators, such as the example in cluster 1 below:
Figure 3. Determination of the number of clusters with the ElBow technique
Figure 4. Grouping data into certain clusters
Figure 5. Cluster 1
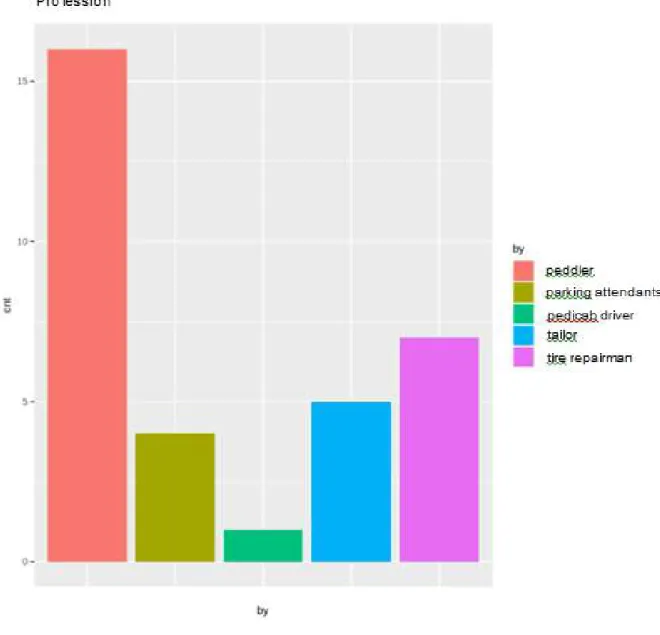
Cluster 1 is a cluster of respondents whose male sex is married and has a dependency of more than three people (> 3 people), in terms of income that is saved in this group is dominated by respondents who save and who do not combine their income, the amount of income combined dominated by the amount ≤ Rp. 100,000, -, with monthly income ≥ Rp. 2,501,000, - , the highest educational background at the junior secondary level, then at the elementary and senior secondary level, in terms of BPJS ownership this group is dominated by respondents who do not have BPJS, with the most dominant reason being that they have not had time. The informal sector workers included in cluster 1 are those who have a profession as traveling vendors, tire patchers, tailors, and parking assistants. Following are the results of the clustering process that have been summarized in tabular form, it can be seen an overview of informal sector workers in each cluster as shown in Table 3 below:
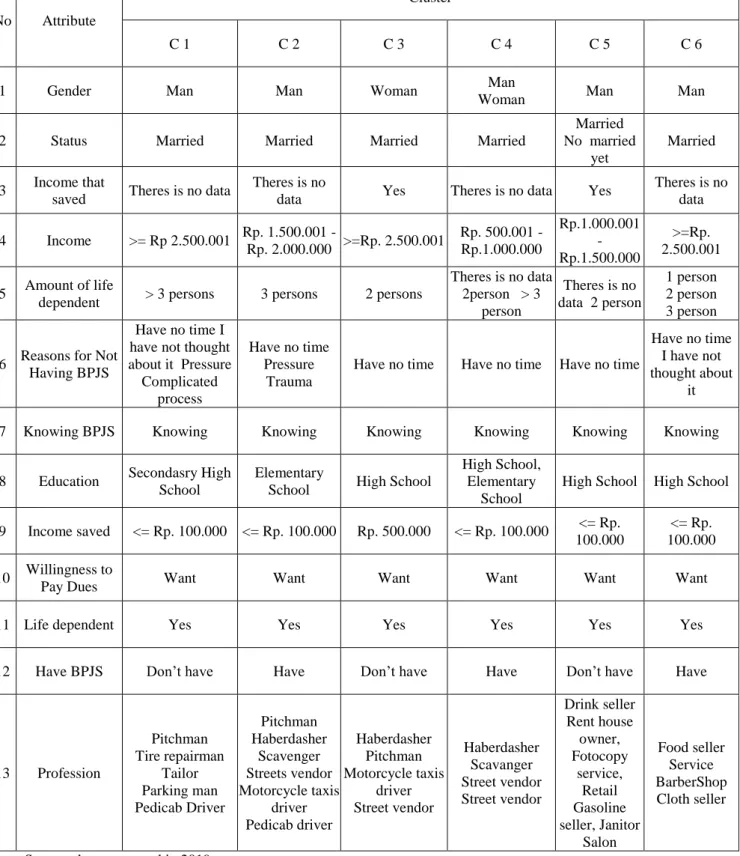
Table 3. Profile of Informal Sector Workers in Each Cluster
No Attribute
Cluster
C 1 C 2 C 3 C 4 C 5 C 6
1 Gender Man Man Woman Man
Woman Man Man
2 Status Married Married Married Married
Married No married
yet
Married
3 Income that
saved Theres is no data Theres is no
data Yes Theres is no data Yes Theres is no
data 4 Income >= Rp 2.500.001 Rp. 1.500.001 -
Rp. 2.000.000 >=Rp. 2.500.001 Rp. 500.001 - Rp.1.000.000
Rp.1.000.001 - Rp.1.500.000
>=Rp.
2.500.001 5 Amount of life
dependent > 3 persons 3 persons 2 persons
Theres is no data 2person > 3
person
Theres is no data 2 person
1 person 2 person 3 person
6 Reasons for Not Having BPJS
Have no time I have not thought about it Pressure
Complicated process
Have no time Pressure
Trauma
Have no time Have no time Have no time
Have no time I have not
thought about it
7 Knowing BPJS Knowing Knowing Knowing Knowing Knowing Knowing
8 Education Secondasry High School
Elementary
School High School
High School, Elementary
School
High School High School
9 Income saved <= Rp. 100.000 <= Rp. 100.000 Rp. 500.000 <= Rp. 100.000 <= Rp.
100.000
<= Rp.
100.000 10 Willingness to
Pay Dues Want Want Want Want Want Want
11 Life dependent Yes Yes Yes Yes Yes Yes
12 Have BPJS Don’t have Have Don’t have Have Don’t have Have
13 Profession
Pitchman Tire repairman
Tailor Parking man Pedicab Driver
Pitchman Haberdasher
Scavenger Streets vendor Motorcycle taxis
driver Pedicab driver
Haberdasher Pitchman Motorcycle taxis
driver Street vendor
Haberdasher Scavanger Street vendor Street vendor
Drink seller Rent house
owner, Fotocopy
service, Retail
Gasoline
seller, Janitor Salon
Food seller
Service BarberShop Cloth seller
Source: data processed in 2019.
The description of the number of informal sector workers in each cluster from the above results is shown in Table 4 below:
Table 4. The description of the number of informal sector workers in each cluster
No. Profession C 1 C 2 C 3 C 4 C 5 C 6 Amount of worker each profession
1 Pitchman 16 16
2 Tire repairman 7 7
3 Tailor 5 5
4 Parking Man 4 4
5 Pedicab Driver 1 1 2
6 Hawker / Paddler 6 6 2 14
7 Hawker 5 7 4 16
8 Scavenger 3 3 6
9 Motorcycle taxis driver 2 3 5
10 Street vendor 2 1 1 4
11 Drink seller 6 6
12 Rent house owner 2 2
13 photocopy servicer 1 1
14 Retail gasoline seller 1 1
15 Janitor 1 1
16 Salon 1 1
17 Food seller 4 4
18 Service seller 3 3
19 Cloth seller 1 1
20 BarberShop 1 1
Total worker per Cluster 33 19 17 10 12 9 100
Source: data processed 2019.
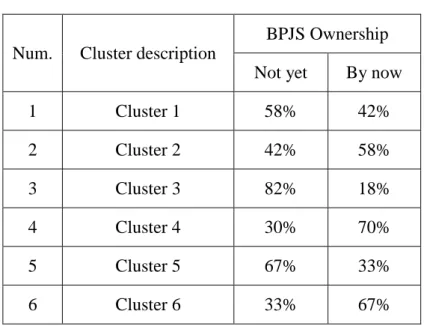
In addition to the number of informal sector workers in each cluster, it can also be seen the ownership percentage of BPJS in each cluster as follows:
Table 5. BPJS Ownership in Each Cluster
Num. Cluster description
BPJS Ownership Not yet By now
1 Cluster 1 58% 42%
2 Cluster 2 42% 58%
3 Cluster 3 82% 18%
4 Cluster 4 30% 70%
5 Cluster 5 67% 33%
6 Cluster 6 33% 67%
Source: data processed 2019.
The table shows the ownership of BPJS is still small in cluster 1 with the percentage of workers who do not have BPJS of 58%, in cluster 3 with the percentage of workers who do not have BPJS of 82% and in cluster 5 with 67% of workers who do not have BPJS.
The number of informal sector workers who do not have BPJS in cluster 1 can be analyzed from the type of respondents in this cluster. Cluster 1 is dominated by male respondents with a family status or marriage and has a dependency on life above three people (> 3 people). In terms of income generated 28% of respondents have income ≥ Rp. 2,501,000, - and 42% have an income of Rp. 500,000 - Rp. 2,000,000. With such income and the number of dependents above 3 people, then the existing income is only used up to finance daily basic needs [9; 27]. This is also made clear by the amount of income set aside for saving, as many as 52% of respondents did not set aside their income to save, and 48% only set aside ≤ Rp. 100,000, - per month.
Cluster 3 has 82% of respondents who do not have BPJS. This cluster is dominated by workers with a female gender of 53% with marital status and the number of dependents as much as 2 people by 35% with income obtained at ≥ Rp. 2,501,000. Respondents in this cluster have income saved per month of Rp. 500,000. The type of respondent in this cluster is the potential respondent to be employed in the ownership of the BPJS because it has a monthly income of up to Rp. 500 thousand, but in fact, with this income, they do not have BPJS. This can be due to gender dominating the cluster, namely married women or housewives, where they work to help their husbands in fulfilling their daily needs or to obtain additional income [27].
Cluster 5 with the percentage of respondents who do not have BPJS as much as 67%, dominated by men by 75% which is divided into two statuses which are 42% with married status and 33% have single status. Revenues owned by respondents in this cluster are in the range of Rp. 1,001,000 - Rp. 1,500,000, - no amount of income set aside for savings.
Figure 6. Model Variability Mapping Constraints for Financing the Health Insurance of Informal Sector Workers in Bogor City
PBI Non PBI
Informal Worker Sector
BPJS with high healthcare ownership
BPJS with low healthcare ownership
O B S T A C L E S Dependant > 3
persons
Women as household decision makers
Low income: 1 million - 1.5 million / Month Solution :
Program optimization to achieve max benefit
Solution : Entrance to PBI
scheme
Solution:
Development of program socialization to mothers who act as head
of the household
Solution:
Community Empowerment
The number of dependents in this cluster is 42% without dependents and 33% has 2 dependents. Looking at the types of respondents in this cluster, the lack of BPJS is due to the very small amount of income [10; 28] where it is only enough for a month's food needs for those who are single, while for those who are married with the responsibility of as many as 2 people very far from enough words can even be said to be very lacking.
Based on the analysis of the three clusters above, it can be concluded that there are several attributes which are constraints in financing health insurance for informal sector workers, among others: Gender, Status, Amount of Dependent Life, and Income. Attributes that are the constraints above are similar to the results of the hypothesis testing of several attributes that correlate with each other and are related to BPJS ownership using the chi-square technique.
The constraints faced by each cluster are different [5], in cluster 1 the obstacles faced are a large number of living dependents, cluster 3 related to gender, and in cluster 5 constraints from the small income side.
Recommend overcoming the constraints on cluster 1: by registering workers in this cluster as recipients of the national health insurance contribution (PBI JKN) for which contributions will be paid by the government [3; 4]. Cluster 3: socializing JKN to mothers so that they are motivated to continue saving for the health of their families [3]. Cluster 5: include workers in the informal worker community according to their profession. The existence of a community of informal sector workers to help expand the participation of health insurance programs is very necessary [4, 23]. The results of the study [23] showed that community formation in accordance with the profession of the informal sector workers [29] was able to help increase the participation of BPJS, that is 60% of the community of informal sector workers already had BPJS health cards.
The recommendations for resolving various health insurance financing constraints for informal sector workers above can be used as a solution for the Bogor BPJS health organizers, through the different forms of constraints and treatment solutions for each cluster. These recommendations are detailed in the form of a model, Figure 6.
5. CONCLUSIONS
Implementation of the concept of big data with data mining for mapping the variability of financing constraints for health insurance informal sector workers produce 6 clusters of informal sector workers with different types in each cluster of sex attributes, status, income saved, income, number of dependents, reasons do not have a BPJS, know the BPJS, education, the amount saved, the willingness to pay contributions, live dependents, and have a BPJS.
Through this clustering process, 3 clusters were obtained with a low level of ownership of BPJS, namely cluster 1, cluster 3, and cluster 5. The three clusters provide attributes that are constraints in financing health insurance for informal sector workers similar to attributes that affect BPJS ownership. Obtained from the results of hypothesis testing with chi-square technique, namely status, income earned, amount of income saved, number of dependents, and gender. Each cluster has recommendations for resolving different constraints, namely for cluster 1 by registering workers in JKN contribution recipients (cluster PBI), cluster 2 by giving out socialization to women who have only been focused on men, and for clusters 5 by involving the community as a forum for empowering informal sector workers.
Acknowledgements
1) Research Institute and Community Service of Pakuan University as the grant fund for this research.
2) The Management Department of Faculty of Economics, Pakuan University for providing support and facilitating lecturers to participate in the grant program.
References
[1] Arifianto, A. 2006. The New Indonesian Social Security Law: A Blessing or Curve for Indonesians?. ASEAN Economic Bulletin, Vol. 23, No. 1, pp. 57-74.
[2] Yustina, E.W., Budisarwo, J., Wiwoho, L.E. 2017. The Implementation of The National Health Insurance Based on Gotong-Royong Principle as the Efforts of Enhancing the Welfare. International Journal of Social Science and Humanity. Vol 7, No. 5.
[3] Andria, F., Kusnadi, N. 2018. Alternative Models of Contribution of Health Insurance Funds for Informal Sector Workers (Case Study in Bogor City). Pakuan Law Review Vol. 4, No 2, 175-215.
[4] Lestari, F.H., Djamaludin, M.D. 2017. Perception and Motivation of National Health Insurance Program Participation in Bogor. Journal of Consumer Sciences Vol. 2 No. 1, 39-50.
[5] Wang, Y., Kung, Lee, Ann., and Byrd, TA. 2016. Big Data Analytics : Understanding Its Capabilities and Potential Benefit for Healtcare Organization. Technological Forecasting & Social Change, An International Journal 126 (2016) 3-13.
[6] Thabrany, H., Gani, A., Pujianto, Mayanda, L., Mahlil, and Budi, B.S. 2003. Social Health Insurance in Indonesia: Current Status and the Plan for a National Health Insurance. Social Health Insurance Workshop, New Delhi: Who SEARO.
[7] Mboi, N. 2015. Indonesia: On the way the Universal Health Care. Health Systems &
Reform, Vol. 1 (2), pp. 91-97.
[8] Odeyemi, I OA. 2014. Community-based health insurance programmes and the national health insurance scheme of Nigeria: challenges to uptake and integration. J of Equility in Health 13: 20.
[9] Shafie AA, Hassali MA. 2013. Willingness to pay for voluntary community-based health insurance: Findings from an exploratory study in the state of Penang, Malaysia.
Social Science & Medicine 96 (2013) 272-276.
[10] Sims, J.M. 2018. Communities of Practice: Telemedicine and Online Medical Communities. Technological Forecasting & Social Change, vol. 126, p. 53-63.
[11] Milner, H. V., and Rudra, N. 2015. Globalization and the Political Benefits of the Informal Economy. International Studies Review, pp. 664-669.
[12] Igudia, E., Ackrill, R., Coleman, S., Dobson, C. 2016. Determinants of the informal economy of an emerging economy: a multiple indicator, multiple causes (MIMIC) approach. International Journal of Entrepreneurship and Small Business, Vol. 28 (2/3), pp. 154-177.
[13] Saraswathi, K., Ganesh, B.V. 2015. A survey on data mining trends, applications and techniques. Discovery 30(135), 383-389.
[14] Sanchez, D., Martin-Bautista, M.J., Blanco, I., Justicia de la Torre. 2008. Text Knowledge Mining: An Alternative to Text Data Mining. Workshops Proceedings of the 8th IEEE International Conference on Data Mining (ICDM 2008), December 15-19, 2008, Pisa, Italy.
[15] Feng, C., Pan, D., Jiafu, W., Dhaqiang, Z., Athanasios, V.V., Xiaohui, R. 2015. Data Mining for the Internet of Things: Literature Review and Challenges. International Journal of Distributed Sensor Networks. Vol. 11, Issue: 8.
http://dx.doi.org/10.1155/2015/431047
[16] Smita, S. Priti. 2014. Use of Data Mining in Various Field: A Survey Paper. IOSR Journal of Computer Engineering Vol, 16(3), pp. 18-21.
[17] Brijesh, K.B. 2011. Mining Educational Data to Analyze Students Performance.
International Journal of Advanced Computer Science and Applications 2 (6).
[18] Shital, H.B., Nirav, B. 2016. Data Mining Techniques and Trends – A Review. Global Journal for Research Analysis, Vol. 5(5), pp. 252-254
[19] Yaqoob, I., Hashem, I. A. T., Gani, A., Mokhtar, S., Ahmed, E., Anuar, N. B.,
Vasilakos, A. V. 2016. Big Data: From Beginning to Future. International Journal of Information Management, Vol. 36, pp. 1231-1247.
[20] Barry, L. 2010. An introduction to data mining and other techniques for advanced analytics. Data and Digital Marketing Practice, 12(2), 137–153.
doi:10.1057/dddmp.2010.35.
[21] Sohrab Md, M., Mostafizer Md, R., Nasim Md, A. 2012. Improvement of K-means clustering algorithm with better initial centroids based on weighted average. Electrical
& Computer Engineering (ICECE), 2012 7th International Conference.
[22] Bangoria, B.M. 2014. Enhanced K-Means Clustering Algorithm to Reduce Time Complexity for Numeric Values. International Journal of Computer Science and Information Technologies 5 (1), 876-879.
[23] Andria, F., Tosida, E.T., Kusnadi, N. and Andriani, S. 2019. Prediction Model of Health Insurance membership for Informal Workers. American Journal of Humanities and Social Sciences Research Vol. 3, Issued 4 (April 2019), pp-236-246.
[24] Jyoti, Y., Monika, S. 2013. A Review of K-mean Algorithm. International Journal of Engineering Trends and Technology Vol. 4, Issue. 7, pp. 2972-2976.
[25] Yu, Z., Haghighat, F., Fung, B.C.M. 2016. Advances and Challenges in Building Engineering and Data Mining Applications for Energy-Efficient Communities.
Sustainable Cities and Society, Vol. 25, pp. 33-38.
[26] Tosida, E.T., Hairlangga, O., Amirudin, F., and Ridwanah, M. 2018. Application of Decision Rules for Empowering of Indonesian Telematics Service SMEs. IOP Conference Series: Materials Sciences and Engineering 332 (1), 012018.
[27] Rolindrawan, Djoni. 2015. The Impact of BPJS Health Implementation for Poor and Near Poor on the Use of Health Facility. Procedia - Social and Behavioral Sciences 211, 550-559.
[28] Sparrow, R., Budiyati, S., Yumna, A., Warda, N., Suryahadi, A., Bedi, A.S. 2017. Sub- national Health Care Financing Reforms in Indonesia. Health Policy and Planning, Vol.
32, pp. 91-101.
[29] Mahendradhata, Y., Trisnantoro, L., Listyadewi, S., Soewondo, P., Harimurti, P., Prawira, J. 2017. The Republic of Indonesia Health System Review. Health System in Transition Vol. 7, No. 1.
[30] Ichikawa, D., Saito, T., and Oyama, H. 2017. Impact of Prediction Health-Guidance Candidates Using Massive Health Check-up Data: A Data-driven Analysis.
International Journal of Medical Informatics, vol. 106, pp. 32-36.
[31] Dhanachandra, N., Manglem, K., Chanu, Y. J. 2015. Image Segmentation using K- Means Clustering Algorithm and Subtractive Clustering Algorithm. Procedia Computer Science, Vol. 54, pp. 764-771.