YOUNG AND HOMELESS IN NASHVILLE: THE SCOPE OF RUNAWAY AND THROWAWAY YOUTH AND
THE EXPERIENCES OF HOMELESS YOUTH
By Cheri Hoffman
Dissertation
Submitted to the Faculty of the Graduate School of Vanderbilt University
in partial fulfillment of the requirements for the degree of
DOCTOR OF PHILOSOPHY in
Community Research and Action December, 2009
Nashville, Tennessee
Approved:
Craig Anne Heflinger, Chair Marybeth Shinn Carolyn Hughes Laura Carpenter
Copyright © 2009 by Cheri Hoffman All Rights Reserved
To the young people of Nashville who inspired me with their hope and optimism and taught me what it means to never give up
ACKNOWLEDGMENTS
Although it is my name on the front cover of this work, it would not have been possible without the help and support of a great many people, to whom I owe a significant debt of gratitude. It is almost an overwhelming task to thank them all. Primarily I want to acknowledge the young people themselves who are the subject of this dissertation. Those youth who served as part of the Youth Advisory Panel for the study were valuable sources of information and
assistance, as well as a constant source of inspiration, encouragement, laughter, and a few tears.
Words are not enough to thank them and the additional youth who allowed me to interview them for their willingness to share their stories and their lives with me. To see your hope in the face of overwhelming odds was a life-changing experience that I will never forget. I hope that the action that results from this research will be sufficient repayment for your efforts.
This work was primarily funded by a Dissertation Fellowship Award from the Vanderbilt Center for Nashville Studies, with additional funding from the Metropolitan Nashville
Homelessness Commission. I appreciate the faith in me to produce a work worthy of your financial support.
The members of my dissertation committee provided valuable insight throughout the process of constructing, carrying out, and reporting the results of the study. I would particularly like to thank Craig Anne Heflinger, the chair of my committee and my academic advisor and mentor. Her commitment to my development as an excellent researcher and respected
community partner has made a significant contribution to my career and life. Following in her tremendous footsteps is both a privilege and an honor. Beth Shinn‟s constructive feedback was
Many organizations in the Nashville area assisted in recruiting young people to give input into and/or be interviewed for this project. The Homeless Youth Outreach program at the Oasis Center was particularly helpful in recruiting the Youth Advisory Panel and providing constant feedback regarding the current state of homeless youth in Nashville, as well as opportunities to engage and interact with young people. I especially want to thank Ben Griffith for his consistent willingness to help and constant encouragement. Mary Virginia Settle at Rocketown, Deb Hill with Youth Links, and Jenny Gray with the Oasis Transitional Living Program were also extremely helpful in recruiting homeless youth for the interviews.
The Davidson County Runaway and Homeless Youth Coalition formed at just the right time to give me the opportunity to develop the idea for this study and the opportunity to
complete it. I am extremely thankful for the guidance and leadership of Danielle Mezera as the founder of the coalition and a personal mentor to me.
The Metropolitan Nashville Public School‟s Office of Research and Assessment made the school survey reported in this work possible. I am so grateful for the assistance of Pat
McDonald and Jack Willis in getting the survey approved, recruiting the participation of 17 local high schools, pulling the classroom samples, and scanning the results for analysis. I am also thankful to the Students Taking a Right Stand and the United Neighborhood Health Services programs, led by Stephanie Davis, for providing contact persons within each of the schools to ease the process of surveying selected classrooms.
Many of my colleagues from the Community Research and Action doctoral program and the Community Development and Action program supported this project with their time by assisting me in the actual surveying of the schools, for which I am grateful. Laurel Lunn served
to help and the outstanding job she did. Professor Andy VanSchaack allowed students in his undergraduate research methods class to receive extra credit for participating in “real world research” as part of this process, and I cannot come close to expressing my gratitude for the over 100 student volunteers this provided. I sincerely could not have accomplished this without his (and their) help. The Metropolitan Homelessness Commission and the Oasis Center generously shared their volunteers with me. Finally, several close personal friends volunteered their time, often at an ungodly early hour, to be part of this survey process, and that meant more to me than they can imagine – thank you Michele Athay, Don England, Jennifer Garrett, Nichole
Huddleston, Tami Walker, and the members of The Guild from the Oasis Church.
Attempting to thank friends and family for their unending support and encouragement is an especially overwhelming task. I must thank my CRA compatriots, one and all, for taking on this crazy task together and being committed to seeing one another through all the ups and downs. I am especially grateful to Kelly Taylor as a mentor, friend and travel companion, Mike Pullmann for his statistical consults and consistently soothing effect on my professional and personal life, and Sarah Van Hooser for her wisdom on matters of qualitative data analysis and her friendship and support which she provided with the grace that defines her.
Many of my friends put up with my constant absorption in matters of grad school and sometimes my inability to think or talk about anything else. I appreciate that you are still here for me five years later! Special thanks to Jeniffer Dake, Jennifer Garrett and Tami Walker for being the most amazing girlfriends that any graduate student could ask for. Your consistent
encouragement and unwavering belief in me meant more than you can possibly realize – and I look forward to celebrating this achievement with you in Cabo!
Finally, to my amazing family, who cannot be thanked enough for seeing me through this and every other endeavor in my life. First to my grandparents, Carl and Alice Cooke who taught me that education is worth more than an ounce of gold and supported my achievements every step of the way, and Marge Hoffman who inspired me by the example of being a teacher and lifelong learner. My sister, Cindy Wiener, her husband Rob, and my beautiful nieces Danielle and Lauren and handsome nephew Matthew provided me with consistent emotional support, and the much needed breaks where I could just be “Aunt Cheri” and forget about everything else for a while.
My parents, Cris and Judy Hoffman, gave me the kind of home and upbringing that the young people I interviewed never had, but each deserved. I can only wish that all young people knew what it meant to be unconditionally loved the way that I was (and still am) and brought up knowing that you can do anything you want to do as long as you set your mind to it and always give it your best. On the day that they left me at Syracuse University for my first college
experience, my dad gave me the advice his father had given him on that day – “Give „em hell.” I think that I have, Dad, and I hope that I have followed your example as an educator and a learner and one who does everything with a standard of excellence. My mom will probably never know how many times her two great pieces of advice – “This too shall pass” and “Things will look better in the morning” were of great consolation to me, not to mention being true. Mom, your friendship and example as a woman who took adversity and turned it into triumph have inspired me every day.
Finally, thanks be to God who always causes me to triumph. May this be another step towards accomplishing your purpose and calling for my life. Thank you.
TABLE OF CONTENTS
Page
DEDICATION ... iii
ACKNOWLEDGMENTS ... iv
LIST OF TABLES ... xi
LIST OF FIGURES ... xii
Chapter I. COUNTING RUNAWAY AND HOMELESS YOUTH IN NASHVILLE ...1
Introduction and Overview ...1
Methodology Summary ...3
Research Questions ...4
Defining Homeless Youth ...5
Previous Research on Counting Homeless Youth ...5
The 2009 Runaway and Homeless Youth Survey ...7
Survey Design ...7
Sampling ...9
Survey Procedures ...11
Data Analysis ...11
Results ...12
Discussion ...24
Limitations ...26
Implications ...27
Practice ...27
Policy ...28
Research ...28
References ...30
II. SERVICE USE AND SERVICE AVOIDANCE...36
Theoretical Background ...36
Page
Service Use ...38
Barriers to Service Use ...38
Facilitators of Service Use ...40
Study Design ...42
Interview Instrument ...43
Data Analysis ...43
Interview Sample ...44
Results ...47
Shelter ...48
Food Services ...50
Homeless Youth Outreach Program ...54
Church Programs ...54
Safe Spaces ...56
Mental Health Services ...57
Education Services ...59
Employment Services ...61
Physical Health Services ...62
Service Avoidance ...64
Negative Experiences ...65
Independence ...67
Relationship Issues ...69
Location ...70
Rules ...71
Discussion ...71
Limitations ...74
Implications ...75
References ...76
III. “NEVER GIVE UP. EVER.”: STRENGTHS OF HOMELESS YOUTH ...82
Background ...82
Methods ...86
Design ...86
Interview Instrument ...87
Data Analysis ...88
Interview Sample ...88
Results ...91
Optimistic ...91
Self-Reliant ...93
Strong-Willed ...95
Altruistic ...99
Page
Friendly ...104
Youth ...105
Relationships ...107
Faith ...113
Discussion ...115
Limitations ...117
Implications ...117
References ...119
IV. CONCLUSION...125
Implications ...126
Practice ...126
Policy ...127
Research ...128
Appendix A. 2009 RUNAWAY AND HOMELESS YOUTH SURVEY ...129
B. HOMELESS YOUTH INTERVIEW GUIDE ...130
C. COMMUNITY BASED PARTICIPATORY RESEARCH ...132
LIST OF TABLES
Page
Table 1. Survey sampling and return rate ...11
Table 2. MNPS sample demographics ...13
Table 3. Primary nighttime residence ...14
Table 4. 12-month runaway/throwaway experience vs. none ...15
Table 5. Differences in runaway and throwaway youth by grade level ...16
Table 6. Differences in current primary nighttime residence between youth with a runaway/throwaway experience in the last 12 months and those with none ...17
Table 7. Demographic differences by grade for those with a lifetime runaway and/or throwaway experience and those without ...18
Table 8. Demographic differences between youth with a homeless experience and youth without a homeless experience ...20
Table 9. All places stayed by category of homeless experience ...21
Table 10. Differences in places stayed by gender, race and grade level ...23
Table 11. Demographic information for homeless youth sample by category ...45
Table 12. Demographic information for homeless youth sample by individual, family, and system involvement characteristics ...90
LIST OF FIGURES
Page Figure 1. Services used by homeless youth, by category………..4
CHAPTER I
COUNTING RUNAWAY AND HOMELESS YOUTH IN NASHVILLE
Introduction and Overview
Homeless youth are a population at great risk. They are more likely than their peers who have stable residences to suffer from health complications, victimization, substance abuse, and mental health problems (Toro, Dworsky, & Fowler, 2007). They are also a population that seems to be growing in size and in difficulty, with homeless youth service providers reporting seeing increasingly troubled clients with multiple risk factors operating in their lives (Slesnick, Meyers, Meade, & Segelken, 2000).
Estimating the actual size of the population of homeless youth is a difficult task. Three major surveys, the Youth Risk Behavior Survey (Ringwalt, Greene, Robertson, & McPheeters, 1998), the 2002 National Survey on Drug Use and Health (SAMHSA, 2004), and the second National Incidence Study of Missing, Abducted, Runaway and Thrownaway Children (In) (Hammer, Finkelhor, & Sedlak, 2002) had reasonably similar results, estimating that 1.6 to 1.7 million youth experience a homeless episode consisting of at least one night on their own within a year. Ringwalt, et al. (1998) found that 7.6% of youth aged 12-17 had been homeless for at least one night in the 12 months prior to their study, staying in a location such as a shelter, public place, abandoned building, outdoors, underground, or with a stranger. The SAMSHA survey also counted those youth with a “street experience.” However, these studies both likely underestimate the true number of youth who experience a runaway or throwaway episode by not including those who stay with a family member, friend, or friend of the family. These are youth who
become known as “couchsurfers” when repeated or longer-term instances of this behavior occur, meaning they have no stable place of residence but instead move from home to home and likely remain at risk in many ways even though they are sleeping indoors on most nights (Toro, et al., 2007). The NISMART-II study did include these youth and estimated that 1,682,900 of children aged 7-17 (3.9% of the total US population of that age in 1999) had a runaway or throwaway episode lasting at least one night (Hammer, et al., 2002).
The Davidson County Runaway and Homeless Youth Coalition (RHYC) formed in 2007 for the purpose of developing and implementing a county-wide strategic plan that will end homelessness among youth and dramatically reduce the number of first-time and chronic runaway youth by identifying and addressing the root causes that lead youth to run away and/or seek alternative, temporary living situations. Members of the RHYC represent various agencies in the Nashville, Tennessee metropolitan area that serve homeless youth, either with programs specifically designed for that population, such as a youth shelter or a homeless youth outreach program, or through programs intended for a broader population of youth that subsequently serve runaway and homeless youth, such as the public health department, physical and mental health clinics, juvenile justice and the police department.
In order to marshal the resources necessary to complete its task, the RHYC required an idea of how many runaway and homeless youth there are in the Nashville area. Limited sources of data on the issue do exist; for example, it was known that the Metropolitan Nashville Police Department reported 2,071 incidents of runaway youth in Nashville between June 1, 2006 and May 31, 2007. The Oasis Center served 250 street youth in Nashville in 2007. The emergency shelter they operate served 275 youth with an average stay of 14 days. In the 2008-2009 school year, the Metropolitan Nashville Public Schools Homeless Education (MNPS Heroes) Program
served about 300 homeless youth in grades 9-12, which includes youth who are homeless with their families.
Members of the RHYC felt that while these service snapshots provided helpful
information, they did not provide a complete picture of the true number of Nashville youth who were experiencing a “homeless episode” as a result of running away or being kicked out of their homes, in addition to those who were literally homeless. It was decided that a survey of a representative sample of local high school youth (grades 9-12) was the most feasible and accurate way to establish the scope of the issue. This report reflects the results of that survey.
Furthermore, because the coalition desired additional context for understanding the experience of youth “on their own” in this sense, an online survey was created to gather more in-depth
information about the experience of young people, and this report also reflects the results of that research effort.
Methodology Summary
This report reflects primary analyses from a district-wide survey of a representative sample of 9th -12th graders in Metropolitan Nashville Public Schools (MNPS). The Survey used a random cluster sampling procedure to identify specific classrooms, stratified by grade level.
Surveys were completed by 2,169 youth, a 69.8% response rate out of those sampled and representing approximately 11% of all MNPS 9th-12th graders at the time of the survey. Details of the sample design and response rate calculations are provided in this report.
All surveys are subject to important limitations. Those relevant to this study are also reviewed in this report. Analysis of the data collected by this study was reviewed, approved, and monitored by the Vanderbilt University Institutional Review Board (IRB).
Research Questions
The primary purpose of this study was to estimate the number of youth in the Nashville area (Davidson County) who have experienced a runaway or throwaway episode or been literally homeless at any point in their lifetime. For the purposes of this project, those terms were defined as follows:
runaway – a high school youth (grade 9-12) who ran away from their parent or guardian‟s home and spent at least one night away without permission, staying either with a relative, friend, friend of the family, a stranger, in a shelter, or in a street location such as a public place, abandoned building, outside, or in a car;
throwaway – a high school youth (grade 9-12) who was kicked out of or asked to leave their parent or guardian‟s home and spent at least one night away, staying either with a relative, friend, friend of the family, a stranger, in a shelter, or in a street location such as a public place, abandoned building, outside, or in a car;
homeless – a high school youth (grade 9-12) who indicates that their current primary nighttime residence is a public location, hotel/motel, or in a shelter without their parent or guardian.
To assist in creating this estimate and further our understanding of the scope of the problem in Nashville, the Runaway and Homeless Youth Coalition asked:
1) How many youth have experienced a runaway/throwaway episode, either in the past year or in their lifetime?
2) What are the demographics of those who experience these episodes?
3) Where do these youth stay during one of these episodes?
Defining Homeless Youth
One major hurdle in doing research on homeless youth is the difficulty in defining them.
A review of the existing literature revealed at least 44 different definitions used to qualify youth for participation in the research reported (Hoffman, 2008). The RHYC sought a definition broad enough to provide a complete picture of those youth believed to be at an elevated risk of negative outcomes in relationship to their experiences “on their own.” The definitions used by the federal government‟s Agency for Children Youth and Families (ACYF) in their Youth with Runaway, Throwaway, and Homeless Experiences Study in 1995 (as described in Greene, et. al., 2003) were deemed to be the best fit to provide the information desired by the RHYC.
The ACYF study defined runaways as: “those who spent at least one night away from home before the age of 18 when they left home even though their parent or someone who helped raise them did not give them permission to go or want them to go; they left home with
permission but did not return home when expected; or they left an institutional setting without permission and stayed away overnight” (Greene, et al., 2003, p. 2-2). Throwaways were defined as: “those who spent at least one night living away from home before they turned 18 when their parent or someone who helped raise them knew they were leaving but did not care whether they left or not; or because they were told to leave” (p. 2-2). Homeless youth were those who were
“unaccompanied by their families and lack stable housing, such as those living on the street, in shelters, or in unstable residences with friends or acquaintances” (p. 2-2).
Previous Research on Counting Homeless Youth
Completing a homeless youth “count” is a notoriously difficult task. Several locations have undertaken these counts in the past. In Las Vegas, NV (Strategic Solutions, 2006),
volunteers canvassed assigned areas of the city on one identified night and physically counted the number of homeless youth they saw. This is known as a point prevalence method, calculating results from those who are found to be runaway or homeless at a given point in time, usually one day (Greene et al., 2003). These methods can be biased toward describing individuals with longer periods of homelessness, in contrast to the typical youth who experiences episodic homelessness as opposed to chronic (Ringwalt et al., 1998). The service providers most familiar with the homeless youth in Nashville felt strongly that a point prevalence count would be an extremely ineffective way to count these young people because of the hidden nature of the problem, likely producing a biased and low number that would significantly under-represent the true extent of the homeless youth population in the area.
A period prevalence estimate is likely a more accurate way to count the population (Greene, et al., 2003). A national attempt at this occurred in 1992 by adding a question to the Youth Risk Behavior Study, a survey that used a national household probability sample, reaching youth at home by telephone (Ringwalt et al., 1998). This sampling method has obvious
limitations in that it could miss youth who are currently experiencing a homeless episode.
However, this strategy has been used in previous research to estimate homelessness rates because household interviews can capture a nationally representative sample of formerly homeless people who may have been hidden while homeless. Given that youth are even more inclined to be hidden than the adult homeless population, due to fears of being arrested or reported to child welfare authorities, this strategy is likely appropriate for this population. This method is also more likely to capture those with episodic experience of homelessness rather than chronic, which youth are more likely to experience.
The 2009 Runaway and Homeless Youth Survey
Given the likelihood that a period prevalence estimate is a more accurate “count” of homeless youth, and that service providers familiar with local youth were much more in favor of this method, the RHYC chose to proceed with a survey of a representative sample of youth to establish an overall number of runaway, throwaway and homeless youth. The most feasible and representative location for this survey was determined to be the Metropolitan Nashville Public Schools (MNPS).
Some may question why a “homeless” youth survey would be undertaken in public schools, when conventional wisdom would suggest that such young people would not be enrolled in schools. In fact, much published research on homeless youth shows that a high percentage of those under the age of 18 continue attending school (Baer, Ginzler, & Peterson, 2003; Cauce et al., 2000; Levin, Bax, McKean, & Schoggen, 2005; Monterey, 2002). In addition, the intent of this survey was to discover not only the number of youth who would meet a stringent definition of homelessness based on the primary nighttime residence of the student, such as the one used in the McKinney-Vento legislation that governs educational services for homeless children (U.S.
Department of Education, 2004), but also the number of youth who had experienced a runaway or throwaway episode as brief as one night. Given that over 90% of youth who run away return home within a month and more than 99% return home within twelve months (Hammer et al., 2002), it was expected that most high school age youth with a runaway or throwaway experience were as likely to be present in a school setting as any other youth.
Survey Design
The RHYC designed the survey with input from a Youth Advisory Panel (see Appendix C for more information about recruiting this group) of currently or formerly homeless youth.
These young people assisted in the development of survey items, wording, and generating a list of options for where youth might stay during a runaway, throwaway, or homeless episode. The survey questions were written at below a fifth-grade reading level to ensure that the vast majority of public high school students would be able to read and understand the survey without
assistance.
The survey was designed to be completely anonymous, but included questions about four demographic factors: gender, race, ethnicity, and grade level. To generate a number of currently homeless youth, a question about the young person‟s “primary nighttime residence” was asked, in accordance with the language of the McKinney-Vento legislation (U.S. Department of
Education, 2004). The wording of the question added to the Youth Risk Behavior Survey in 1992 (Ringwalt, et al., 1998) was adapted to provide answers to whether youth had experienced a runaway or throwaway episode in the last 12 months that resulted in at least one night away from their parent or guardian‟s home. Utilizing the 12 month timeframe and the qualifier of “at least one night,” along with asking about the various locations where youth stayed during these episodes, would allow for comparisons to the often quoted national statistic indicating that 7.6%
of youth are homeless for at least one night each year. Because research has shown that the experiences of runaway and throwaway youth can differ significantly (MacLean, Embry, &
Cauce, 1999; Ringwalt, Greene, & Robertson, 1998), the survey asked students to specify whether in the last 12 months they had run away from home, or if they had been kicked out or asked to leave. To gain a more complete picture of the experience of Nashville youth, a question was added about whether they had ever experienced a runaway or throwaway episode (or both) in their lifetime. Finally, youth were asked to choose from a list of options to indicate where they stayed when they ran away, including all of the options identified in the YRBS (except for
“underground” because there is no subway system in Nashville), as well as options identified as the most likely places to stay by the Advisory Panel (such as with a relative, with a friend, or with a friend of the family).
Members of the RHYC worked with the Metropolitan Nashville Public Schools (MNPS) Office of Research and Assessment (ORA) to refine the survey to meet district standards, and to plan the process of the survey, which was done in a similar fashion to the ORA‟s administration of the Youth Risk Behavior Survey in prior years. An official research proposal was submitted to the ORA and approved.
Sampling
Feasibility constraints required that the survey take place only in high schools, rather than junior high and high schools, which would have more closely replicated the age range of the previous national survey. The only high schools excluded from participation were those with overall enrollment numbers too small to make surveying them feasible, or those special education schools in which the reading level of the survey would be prohibitive. The MNPS Assistant Superintendent for Student Services requested participation from the principals of the remaining 17 local high schools. All agreed to participate. Contact persons, either an assistant principal or an embedded youth agency staff person, were identified to assist with survey procedures.
The survey used a random cluster sampling procedure. The clusters were intact
“homeroom” classrooms, also known at some schools as advisor/advisee periods. The rationale of sampling for descriptive studies provided by Gay & Airasian (2002) was used to set the sample size initially. These authors say that a sample size between 10% and 20% of the population is adequate for descriptive studies, and for population sizes greater than 5,000, a
sample size of 400 is adequate. Because of the desire to generalize to the entire population of MNPS high school students in grades 9-12, it was decided to pursue a sample size of 10%-20%
as suggested by Gay and Airasian.
The actual number of students sampled would depend on two factors: the RHYC‟s ability to recruit volunteers to administer the survey during the selected homerooms, and the expected completion rate of surveys. Based on the district's experience with the YRBS, it was
recommended that a 75% completion or "return rate" should be used. Weitzman, Guttmacher, Weinberg and Kapachia (2003) suggest that a response rate of 70% or above is sufficient for not biasing results of adolescent risk-behavior surveys, given that schools with a response rate below that are more likely to have more at-risk students absent from the survey.
The ORA determined that the high school enrollment at the 17 selected high schools was 19,622 on February 11, 2009. A 12% sample of this enrollment, using the 75% rate of return, resulted in a needed sample of 3,140 students. With an average homeroom class size of 18, the number of classrooms needed was 175. This was at the limit of feasibility the RHYC had established for a three-week time period in which to complete all the surveys. The individual classrooms (clusters) were listed in a column on an Excel spreadsheet, along with identifying codes, their class enrollment and their respective schools. The Excel random number function assigned each cluster a random six-digit number. The file was then sorted by the random number and clusters were picked until the target sample size of 3,140 students was reached or exceeded.
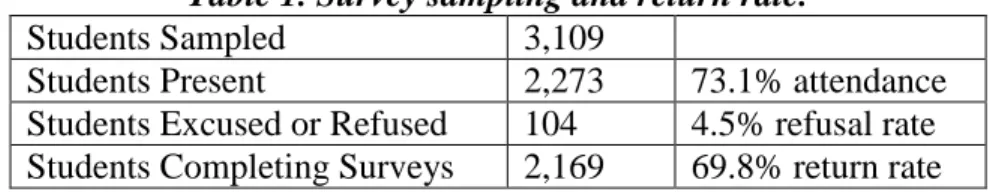
Changes in classrooms to be surveyed mandated by principals resulted in a final sample size of 3,109 students. A total of 2,169 students completed the survey, for a sample size equal to 11% of the students enrolled in MNPS high schools on that date, which falls within the adequate range of 10-20% of the population. Information on the overall return rate is provided in Table 1 below.
Table 1. Survey sampling and return rate.
Survey Procedures
The RHYC recruited volunteers from undergraduate research methods courses and graduate programs at Vanderbilt University, local homeless service organizations, and member agencies of the coalition to assist with completing the surveys. All 17 selected high schools were surveyed between March 23 and April 9, 2009. Passive permission forms were delivered to the selected advisor/advisee or homeroom classes at least a week prior to the survey date to allow parents the opportunity to opt out of their child completing the survey. RHYC volunteers
attended the classrooms on the scheduled days, explained the survey and the voluntary nature of it, distributed and collected the survey forms, preserving the confidential nature of the data. No identifying information was collected from the students. These surveys were then scanned and the results entered into an Excel spreadsheet for transfer into SPSS for analysis.
Data Analysis
The 2,169 total responses were analyzed in SPSS, using a chi-square test of significance.
The sample size was sufficient for a minimum detectable effect size of “large” (Cohen, 1992) with traditional assumptions (p < .05, two-tailed, at 80% power). In addition, 95% confidence intervals show the likely range of the true percentage of youth in the various categories.
Typically, statistically significant differences correspond to non-overlapping confidence intervals (see Table 4 for an example).
Students Sampled 3,109
Students Present 2,273 73.1% attendance
Students Excused or Refused 104 4.5% refusal rate Students Completing Surveys 2,169 69.8% return rate
The analyses compared several groups of youth: 1) those who had run away or been thrown away in the past 12 months with those who had not; 2) those with a lifetime experience with those who had not; and 3) youth with any type of “homeless experience” – including a runaway or throwaway episode in the past 12 months or in their lifetime, and those who reported being currently homeless (i.e., living in a shelter or a public location without parental
supervision) – were compared to youth with no homeless experience. Frequencies were used to determine the rates at which youth with runaway, throwaway and/or homeless experiences stayed in various possible locations, as well as chi-square analyses to look for differences in those locations by gender, race, and grade level.
Results
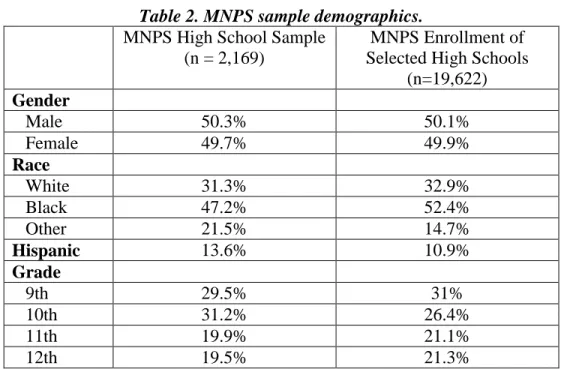
Demographic information. The survey was completed by 2,169 students. Demographic information from the overall sample, as reported in Table 2 below, reflects closely the total population of the surveyed high schools and Metro Nashville Public Schools overall (MNPS, 2008). The sample was almost evenly split between male (50.3%) and female (49.7%). Almost half of the youth (47.2%) identified as black, 31.3% were white, and 21.5% were “other,”
including Asian, American Indian/Alaskan Native, Hawaiian/ Pacific Islander, and bi- or multi- racial. Hispanic youth made up 13.6% of the sample. The breakdown in grade levels was 29.5%
ninth graders, 31.2% tenth graders, 19.9% eleventh graders and 19.5% twelfth graders. A decline in enrollment is expected in the higher grades due to increased dropouts with age. This does represent a slight oversampling of 10th graders in comparison to the MNPS overall enrollment.
Table 2. MNPS sample demographics.
MNPS High School Sample (n = 2,169)
MNPS Enrollment of Selected High Schools
(n=19,622) Gender
Male 50.3% 50.1%
Female 49.7% 49.9%
Race
White 31.3% 32.9%
Black 47.2% 52.4%
Other 21.5% 14.7%
Hispanic 13.6% 10.9%
Grade
9th 29.5% 31%
10th 31.2% 26.4%
11th 19.9% 21.1%
12th 19.5% 21.3%
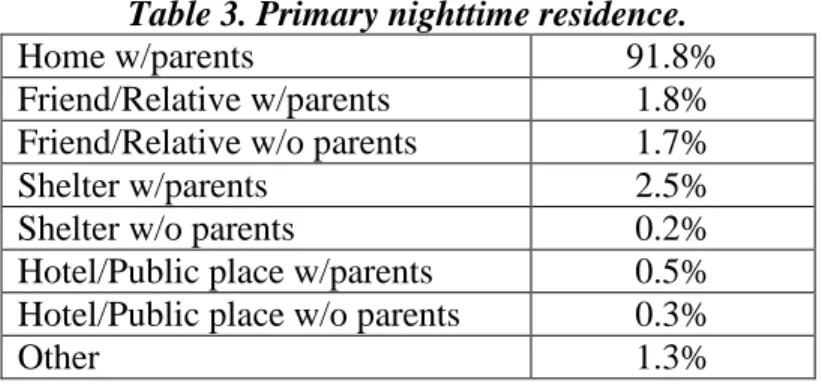
Primary nighttime residence. Table 3 reports results from the full sample regarding the primary nighttime residence of the youth, as they reported on the day of the survey. Most youth (91.8%) indicated that the place where they typically slept at night was at home with their parents or guardians. This option specifically stated that foster parents were included. Another (4.8%) stated that they stayed primarily with their parents, but not in their own home - either with a friend or relative (1.8%), in a shelter (2.5%), or in a hotel, motel, car, park, or other public place (0.5%). About 2.2% of youth reported being away from their parents, either living one their own with a friend or relative (1.7%), in a shelter (0.2%), or in a hotel, motel, car, park or other public place (0.3%).
Table 3. Primary nighttime residence.
Home w/parents 91.8%
Friend/Relative w/parents 1.8%
Friend/Relative w/o parents 1.7%
Shelter w/parents 2.5%
Shelter w/o parents 0.2%
Hotel/Public place w/parents 0.5%
Hotel/Public place w/o parents 0.3%
Other 1.3%
Runaway/Throwaway episode in the past 12 months. In this study, 6.3% of youth (n = 135) said that they had run away from home and stayed out for at least one night without permission of their parent or guardian in the past 12 months. An additional 7.3% of youth (n = 156) responded that they had been kicked out of or asked to leave the home of their parent or guardian in the last twelve months. This is a total of 13.6% -- or more than one in six – of Nashville public high school youth who would meet this study‟s definitional criteria of being homeless for at least one night.
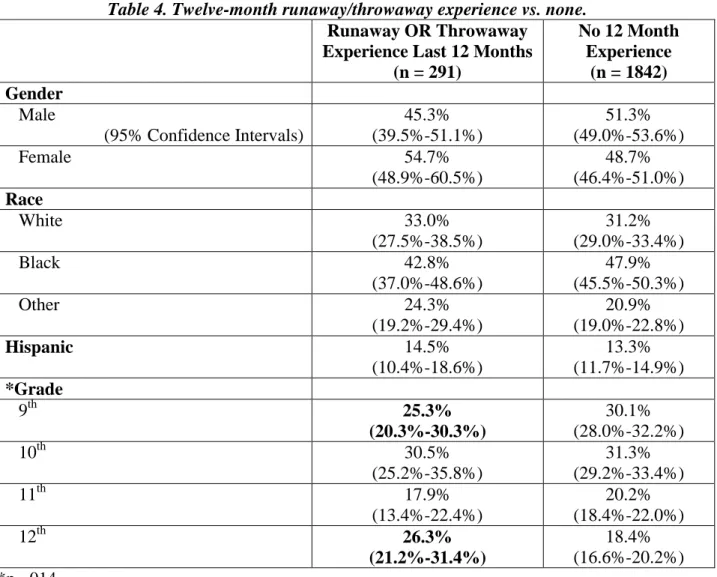
Table 4 reports the demographic differences between youth who had a runaway or a throwaway episode in the last 12 months and those who did not.
Table 4. Twelve-month runaway/throwaway experience vs. none.
Runaway OR Throwaway Experience Last 12 Months
(n = 291)
No 12 Month Experience
(n = 1842) Gender
Male
(95% Confidence Intervals)
45.3%
(39.5%-51.1%)
51.3%
(49.0%-53.6%)
Female 54.7%
(48.9%-60.5%)
48.7%
(46.4%-51.0%) Race
White 33.0%
(27.5%-38.5%)
31.2%
(29.0%-33.4%)
Black 42.8%
(37.0%-48.6%)
47.9%
(45.5%-50.3%)
Other 24.3%
(19.2%-29.4%)
20.9%
(19.0%-22.8%)
Hispanic 14.5%
(10.4%-18.6%)
13.3%
(11.7%-14.9%)
*Grade
9th 25.3%
(20.3%-30.3%)
30.1%
(28.0%-32.2%)
10th 30.5%
(25.2%-35.8%)
31.3%
(29.2%-33.4%)
11th 17.9%
(13.4%-22.4%)
20.2%
(18.4%-22.0%)
12th 26.3%
(21.2%-31.4%)
18.4%
(16.6%-20.2%)
*p=.014
Ninth graders were significantly less likely to experience a runaway/throwaway episode in the past twelve months, and seniors significantly more likely. A logistic regression predicting the chances of having a runaway/throwaway episode in the past 12 months, comparing seniors to all other grade levels, showed that a senior‟s odds of having a recent episode were almost 59%
higher than youth in the other grades (Exp(B) = 1.588).
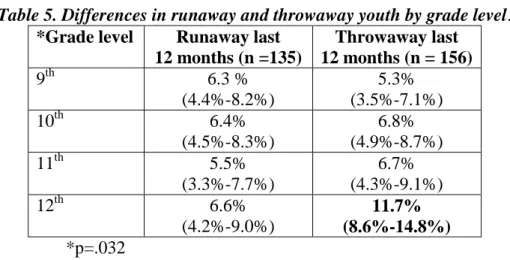
When considered as a percentage of the sample as a whole, Table 5 shows that throwaway youth are significantly more likely to be 12th graders.
Table 5. Differences in runaway and throwaway youth by grade level.
*Grade level Runaway last 12 months (n =135)
Throwaway last 12 months (n = 156)
9th 6.3 %
(4.4%-8.2%)
5.3%
(3.5%-7.1%)
10th 6.4%
(4.5%-8.3%)
6.8%
(4.9%-8.7%)
11th 5.5%
(3.3%-7.7%)
6.7%
(4.3%-9.1%)
12th 6.6%
(4.2%-9.0%)
11.7%
(8.6%-14.8%)
*p=.032
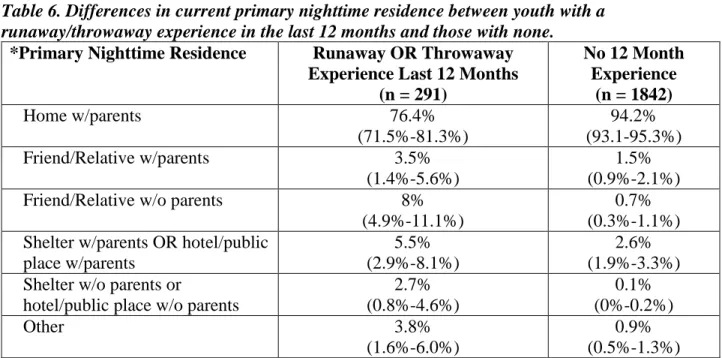
Table 6 shows that there are significant differences between where those youth with a runaway/throwaway experience in the last 12 months and those without one are currently living.
As might be expected, significantly fewer youth with an episode in the last year are currently living at home with their parents (76.4% vs. 94.2%). Youth with a runaway/throwaway experience in the last 12 months are significantly more likely to be living in any of the other possible situations, even those with their parents, such as with a friend or relative with their parents, or in a shelter or hotel/public place with their parents.
Table 6. Differences in current primary nighttime residence between youth with a runaway/throwaway experience in the last 12 months and those with none.
*Primary Nighttime Residence Runaway OR Throwaway Experience Last 12 Months
(n = 291)
No 12 Month Experience
(n = 1842)
Home w/parents 76.4%
(71.5%-81.3%)
94.2%
(93.1-95.3%)
Friend/Relative w/parents 3.5%
(1.4%-5.6%)
1.5%
(0.9%-2.1%)
Friend/Relative w/o parents 8%
(4.9%-11.1%)
0.7%
(0.3%-1.1%) Shelter w/parents OR hotel/public
place w/parents
5.5%
(2.9%-8.1%)
2.6%
(1.9%-3.3%) Shelter w/o parents or
hotel/public place w/o parents
2.7%
(0.8%-4.6%)
0.1%
(0%-0.2%)
Other 3.8%
(1.6%-6.0%)
0.9%
(0.5%-1.3%)
*p<.001
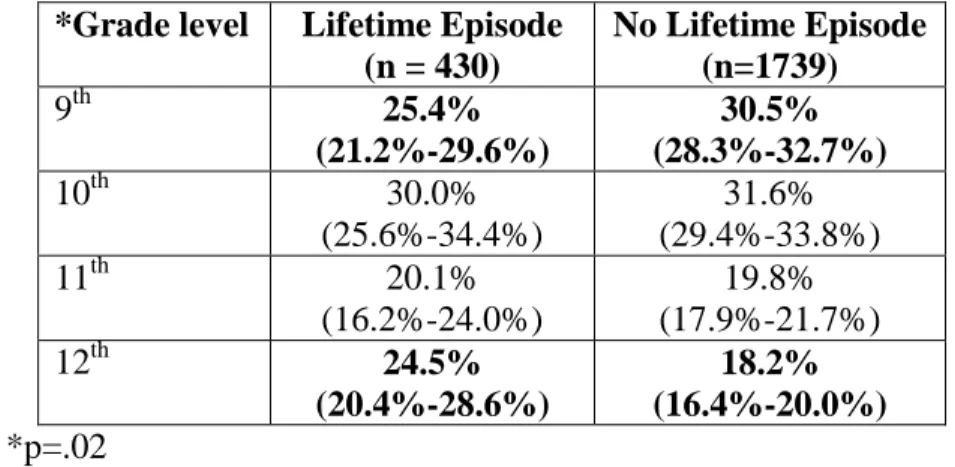
Lifetime episode. Nearly one in five of all Nashville high school youth (19.6%) of youth indicated that they had either run away (8.6%), been kicked out (7.8%) or both (3.2%) over the course of their lifetime. The only significant demographic variation for youth in this category from youth without an episode in their lifetime is that, similar to the 12-month episode rate, those with a lifetime episode were less likely to be freshmen and more likely to be seniors (see Table 7). This result makes sense given the chronological age difference.
Table 7. Differences by grade for those with a lifetime runaway and/or throwaway episode and those without.
*Grade level Lifetime Episode (n = 430)
No Lifetime Episode (n=1739)
9th 25.4%
(21.2%-29.6%)
30.5%
(28.3%-32.7%)
10th 30.0%
(25.6%-34.4%)
31.6%
(29.4%-33.8%)
11th 20.1%
(16.2%-24.0%)
19.8%
(17.9%-21.7%)
12th 24.5%
(20.4%-28.6%)
18.2%
(16.4%-20.0%)
*p=.02
Homeless “experience.” For the purposes of this study, a homeless experience was defined as a young person who reported being a runaway or a throwaway, either in the past 12 months or in their lifetime, or who indicated that their current primary nighttime residence was in a literally homeless setting, such as in a shelter or a public place without their parent or guardian.
Slightly more than 1 in 5 youth surveyed (20.5%) indicated that they had a homeless experience meeting these criteria of being “on their own.”
Several youth indicated that they lived in situations that may or may not qualify them as homeless, such as with a friend or relative either with or without their parents, depending upon the reasons for being “doubled up.” Youth who said they primarily stayed with a friend or relative without their parents but who had not indicated a runaway or throwaway experience were not counted as homeless because we could not determine whether this was due to a runaway/throwaway episode or for other reasons. Youth who indicated that they lived with a friend or relative with their parents were not counted as homeless because they remained under the supervision of their parents/guardians. The same applies to those youth who responded that they lived in a shelter with their parents or in a hotel/motel, car, park, campground, or other
public place with their parents/guardians, which totaled 3% of the youth completing the survey.
While those young people would likely be considered part of a homeless family and would be, for example, eligible to receive services from the MNPS Homeless Education Program, they were not considered a homeless youth in this study because they were not “on their own.” Only those youth who responded that they were currently living in a shelter without their parents (0.2%), or staying in a hotel/motel or other public place without their parents (0.3%) were considered literally homeless youth in this study, for a total of 11 youth, or 0.5% of the sample.
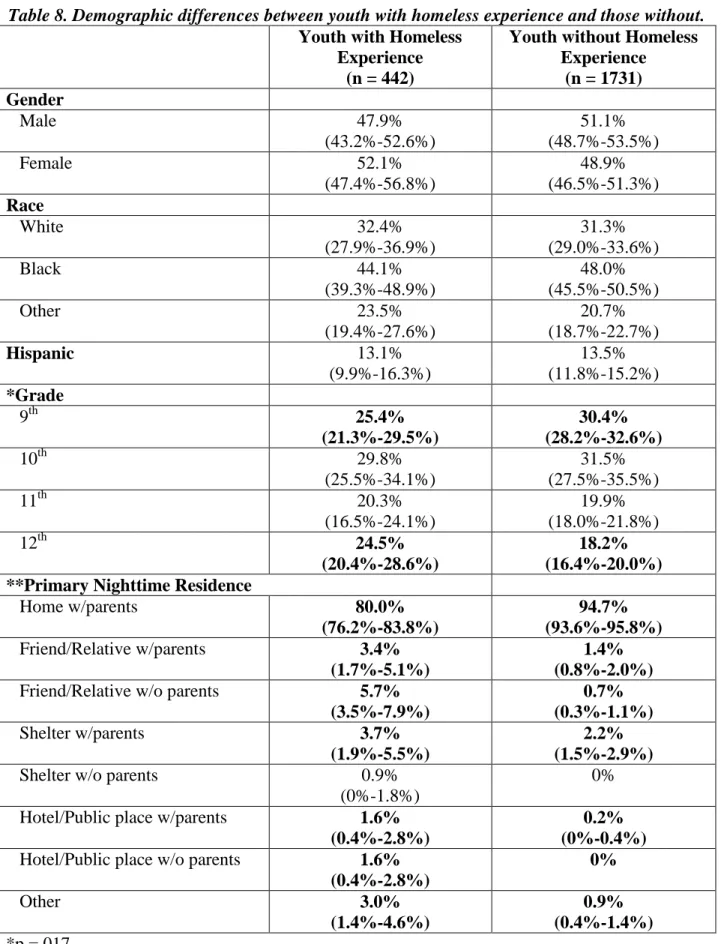
Table 8 compares all youth with any reported experience of being homeless on their own with those who had no such experience on all demographic variables, including primary
nighttime residence. Similar to previous findings in this study, there are differences by grade level, with fewer ninth graders and more twelfth graders (relative to their class size in the sample) having homeless experience. As expected, and similar to youth with a 12-month
runaway/throwaway episode, significantly fewer youth with homeless experience reported living at home with their parents at the time of the survey (80% vs. 94.7%), and significantly more were living in each of the remaining situations.
Table 8. Demographic differences between youth with homeless experience and those without.
Youth with Homeless Experience
(n = 442)
Youth without Homeless Experience
(n = 1731) Gender
Male 47.9%
(43.2%-52.6%)
51.1%
(48.7%-53.5%)
Female 52.1%
(47.4%-56.8%)
48.9%
(46.5%-51.3%) Race
White 32.4%
(27.9%-36.9%)
31.3%
(29.0%-33.6%)
Black 44.1%
(39.3%-48.9%)
48.0%
(45.5%-50.5%)
Other 23.5%
(19.4%-27.6%)
20.7%
(18.7%-22.7%)
Hispanic 13.1%
(9.9%-16.3%)
13.5%
(11.8%-15.2%)
*Grade
9th 25.4%
(21.3%-29.5%)
30.4%
(28.2%-32.6%)
10th 29.8%
(25.5%-34.1%)
31.5%
(27.5%-35.5%)
11th 20.3%
(16.5%-24.1%)
19.9%
(18.0%-21.8%)
12th 24.5%
(20.4%-28.6%)
18.2%
(16.4%-20.0%)
**Primary Nighttime Residence
Home w/parents 80.0%
(76.2%-83.8%)
94.7%
(93.6%-95.8%)
Friend/Relative w/parents 3.4%
(1.7%-5.1%)
1.4%
(0.8%-2.0%)
Friend/Relative w/o parents 5.7%
(3.5%-7.9%)
0.7%
(0.3%-1.1%)
Shelter w/parents 3.7%
(1.9%-5.5%)
2.2%
(1.5%-2.9%)
Shelter w/o parents 0.9%
(0%-1.8%)
0%
Hotel/Public place w/parents 1.6%
(0.4%-2.8%)
0.2%
(0%-0.4%) Hotel/Public place w/o parents 1.6%
(0.4%-2.8%)
0%
Other 3.0%
(1.4%-4.6%)
0.9%
(0.4%-1.4%)
*p =.017
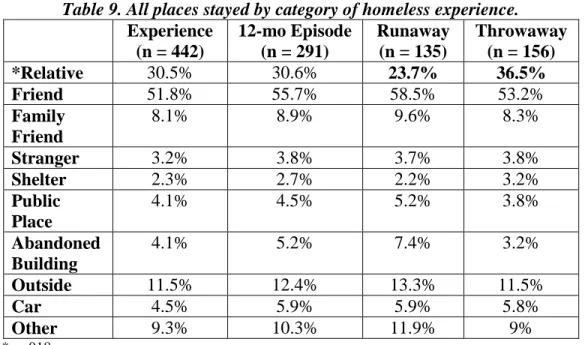
Places stayed. Youth indicated staying in a variety of locations while experiencing a homeless episode. Table 9 shows the percentages of youth who stayed in the various locations provided as survey choices, based on the type of experience they indicated. Youth could check more than one option, so the percentages may add up to more than 100% in each column.
Table 9. All places stayed by category of homeless experience.
Experience (n = 442)
12-mo Episode (n = 291)
Runaway (n = 135)
Throwaway (n = 156)
*Relative 30.5% 30.6% 23.7% 36.5%
Friend 51.8% 55.7% 58.5% 53.2%
Family Friend
8.1% 8.9% 9.6% 8.3%
Stranger 3.2% 3.8% 3.7% 3.8%
Shelter 2.3% 2.7% 2.2% 3.2%
Public Place
4.1% 4.5% 5.2% 3.8%
Abandoned Building
4.1% 5.2% 7.4% 3.2%
Outside 11.5% 12.4% 13.3% 11.5%
Car 4.5% 5.9% 5.9% 5.8%
Other 9.3% 10.3% 11.9% 9%
*p=.018
Note: Percentages will add up to more than 100% because youth could indicate staying in multiple locations.
Across all categories of homeless experience, youth were most likely to report staying with a friend (51.8% for youth with any homeless experience) when they were out of their parent or guardians home, with more than half of each category reporting this. The second most likely option for youth in all categories was to stay with a relative (30.5% of youth with any homeless experience). Youth who were kicked out were significantly more likely to stay with a relative (36.5%) than those who ran away (23.7%).
The next highest percentage for youth with any homeless experience was outside
friend (8.1%), in a car (4.5%), an abandoned building (4.1%), a public place (4.1%), such as a train or a bus station, restaurant or office building, with a stranger (3.2%), or in a shelter (2.3%), either youth or adult. About 10% of youth across the categories reported staying in a location
“other” than those listed, but few filled in answers to explain. One young person who had checked nearly all of the available options wrote poignantly “There are others…” in reference to additional locations where she stayed.
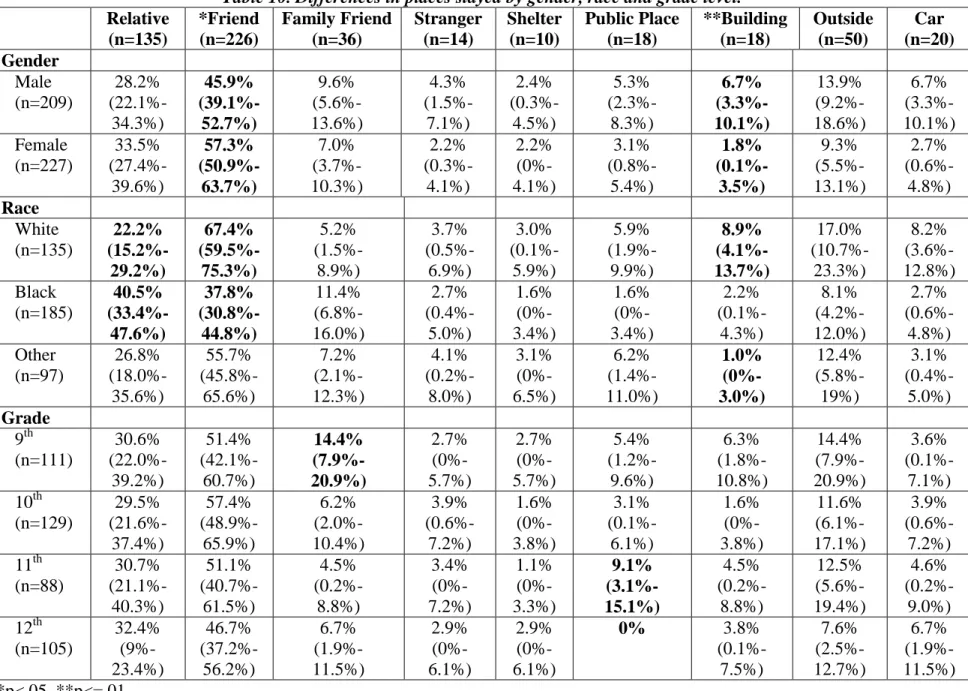
Table 10 shows the differences in places stayed for all youth with any homeless
experience, based on gender, race, and grade level. Comparisons were made within each of these groups between to those with homeless experience who stayed in each of the various locations and those who did not stay in those locations. Youth with homeless experience who stayed with relatives were significantly more likely to be black (40.5%) and significantly less likely to be white (22.2%). Those youth who stayed with friends were significantly more likely to be females (57.3%) and significantly less likely to be males (45.9%), as well as significantly more likely to be white (67.4%) than black (37.8%). Youth who stayed in an abandoned building were
significantly more likely to be male (6.7%) and to be white (8.9%), and significantly less likely to be youth of “other” race (1.0%). Those who stayed with a family friend were significantly more likely to be ninth graders (14.4%), and those who stayed in a public place were
significantly more likely to be in eleventh grade (11.1%), whereas no seniors had done so.
Table 10. Differences in places stayed by gender, race and grade level.
Relative (n=135)
*Friend (n=226)
Family Friend (n=36)
Stranger (n=14)
Shelter (n=10)
Public Place (n=18)
**Building (n=18)
Outside (n=50)
Car (n=20) Gender
Male (n=209)
28.2%
(22.1%- 34.3%)
45.9%
(39.1%- 52.7%)
9.6%
(5.6%- 13.6%)
4.3%
(1.5%- 7.1%)
2.4%
(0.3%- 4.5%)
5.3%
(2.3%- 8.3%)
6.7%
(3.3%- 10.1%)
13.9%
(9.2%- 18.6%)
6.7%
(3.3%- 10.1%) Female
(n=227)
33.5%
(27.4%- 39.6%)
57.3%
(50.9%- 63.7%)
7.0%
(3.7%- 10.3%)
2.2%
(0.3%- 4.1%)
2.2%
(0%- 4.1%)
3.1%
(0.8%- 5.4%)
1.8%
(0.1%- 3.5%)
9.3%
(5.5%- 13.1%)
2.7%
(0.6%- 4.8%) Race
White (n=135)
22.2%
(15.2%- 29.2%)
67.4%
(59.5%- 75.3%)
5.2%
(1.5%- 8.9%)
3.7%
(0.5%- 6.9%)
3.0%
(0.1%- 5.9%)
5.9%
(1.9%- 9.9%)
8.9%
(4.1%- 13.7%)
17.0%
(10.7%- 23.3%)
8.2%
(3.6%- 12.8%) Black
(n=185)
40.5%
(33.4%- 47.6%)
37.8%
(30.8%- 44.8%)
11.4%
(6.8%- 16.0%)
2.7%
(0.4%- 5.0%)
1.6%
(0%- 3.4%)
1.6%
(0%- 3.4%)
2.2%
(0.1%- 4.3%)
8.1%
(4.2%- 12.0%)
2.7%
(0.6%- 4.8%) Other
(n=97)
26.8%
(18.0%- 35.6%)
55.7%
(45.8%- 65.6%)
7.2%
(2.1%- 12.3%)
4.1%
(0.2%- 8.0%)
3.1%
(0%- 6.5%)
6.2%
(1.4%- 11.0%)
1.0%
(0%- 3.0%)
12.4%
(5.8%- 19%)
3.1%
(0.4%- 5.0%) Grade
9th (n=111)
30.6%
(22.0%- 39.2%)
51.4%
(42.1%- 60.7%)
14.4%
(7.9%- 20.9%)
2.7%
(0%- 5.7%)
2.7%
(0%- 5.7%)
5.4%
(1.2%- 9.6%)
6.3%
(1.8%- 10.8%)
14.4%
(7.9%- 20.9%)
3.6%
(0.1%- 7.1%) 10th
(n=129)
29.5%
(21.6%- 37.4%)
57.4%
(48.9%- 65.9%)
6.2%
(2.0%- 10.4%)
3.9%
(0.6%- 7.2%)
1.6%
(0%- 3.8%)
3.1%
(0.1%- 6.1%)
1.6%
(0%- 3.8%)
11.6%
(6.1%- 17.1%)
3.9%
(0.6%- 7.2%) 11th
(n=88)
30.7%
(21.1%- 40.3%)
51.1%
(40.7%- 61.5%)
4.5%
(0.2%- 8.8%)
3.4%
(0%- 7.2%)
1.1%
(0%- 3.3%)
9.1%
(3.1%- 15.1%)
4.5%
(0.2%- 8.8%)
12.5%
(5.6%- 19.4%)
4.6%
(0.2%- 9.0%) 12th
(n=105)
32.4%
(9%-
46.7%
(37.2%-
6.7%
(1.9%-
2.9%
(0%-
2.9%
(0%-
0% 3.8%
(0.1%-
7.6%
(2.5%-
6.7%
(1.9%-
Discussion
High school youth in Davidson County appear to be experiencing homelessness at an alarming rate. Within the past year alone, 13.6% of young people were on their own for at least one night due to a runaway or throwaway episode. Translated to the population of the MNPS high schools surveyed (n=19,622), that means that approximately 1,236 MNPS high school students ran away and 1,432 were thrown away for at least one night in the last year.
Limiting the analyses in this study to youth who reported staying in the same locations (shelter, public place, abandoned building, outside, underground, or a stranger‟s home) as the 1992 Youth Risk Behavior Survey (Greene, et al., 1998) resulted in about 3% of youth who would have met this definition for homelessness – or less than half of the 7.6% national rate reported by that study. It is possible that the YRBS study could have included youth who stayed in one of these locations with their families, although the survey asked about runaway behavior.
If those youth who indicated that their primary nighttime residence was in a shelter or a public place with their parents (3% of youth in this study) were included, then the overall homeless rate would equal 6% or nearly equivalent to the national study.
While a 3% rate of literal homelessness in the past year for Nashville youth is well below the national statistic, it is still concerning, considering that it represents nearly 600 Metro
Nashville high school youth who experienced at least one night literally homeless. We know from this study that 1 in 8 youth with a homeless experience (12.5%) stayed outside (in a public park, on the street, under a bridge, on a rooftop, etc.), 7% stayed in a car, about 4% each stayed in an abandoned building or a public place (train/bus station, restaurant, office building, etc.), and just over 3% stayed with someone they did not know. Each time a student stayed in one of
these locations, they placed themselves at significant risk. (The same youth could be represented in multiple categories, as many youth indicated staying in more than one of these locations.)
The last 12-month runaway/throwaway result of this study (13.6%) is concerning, as is the overall homeless experience rate of 20.5%, which represents over 4,000 MNPS high school youth who have been “on their own” at some point. The youth who served on the Advisory Panel for the study and the local homeless youth service providers felt strongly that staying in locations such as with a relative, a friend, or a friend of the family still qualified a young person as a runaway or throwaway youth, particularly given the young age of these respondents (18 and under), and that excluding them would severely under-report the incidence of young people who face additional risk. Furthermore, numerous studies of homeless youth define homelessness not by where the youth stayed while they were gone from home, but by the fact that they ran away from or were kicked out of or asked to leave the home of their parents/guardians and were then on their own for a period of time (Carlson, Sugano, Millstein, & Auerswald, 2006; Cauce et al., 2000; Gaetz, 2004; Gwadz, Nish, Leonard, & Strauss, 2006; Mallett, Rosenthal, Myers, Milburn,
& Rotheram-Borus, 2004; Solorio, Milburn, Andersen, Trifskin, & Gelberg, 2006; Taylor- Seehafer et al., 2007; Votta & Manion, 2004).
The fact that there were significant differences in homeless experience reported by age but not by racial and ethnic categories is supported by previous research. Sanchez, Waller and Greene (2006) also found that older students were more likely to run away than younger
students. Because high school seniors appear to be the most likely age group to get kicked out of or asked to leave their homes, there should be special attention paid to this group in terms of designing programs or increasing supportive services at this developmental stage. It is possible that more seniors experience being thrown away because they turn 18 years old during this year,
and their families may expect them to be independent at that time. Research has consistently shown that adolescence has extended in recent generations, meaning that today‟s youth are not as socially, emotionally, mentally or psychologically prepared to handle life on their own at the age of eighteen as they may have been in the past (Arnett, 2000). This time just prior to high school graduation and the accomplishment of that milestone, crucial to successful outcomes in post- secondary education and employment, should be carefully guarded so as to provide youth with as many opportunities for future success as possible.
Published research on homeless youth indicates that youth who are in street locations are more likely to be male, and those in shelter locations more likely to be female (K. D. Johnson, Whitbeck, & Hoyt, 2005; Klein et al., 2000; O'Grady & Gaetz, 2004; Witkin et al., 2005). This study had similar results, indicating that youth with homeless experience who stayed in
abandoned buildings were more likely to be males, and those who stayed with friends were more likely to be females. Differences in places stayed were also indicated along racial lines, which to the author‟s knowledge has not been found in previous research. Youth with homeless
experience who stayed with relatives tended to be black and those who stayed with friends tended to be white, perhaps speaking to the stronger family ties that have been reported among African-American families. White youth also tended towards more outdoor locations, such as an abandoned building, although the differences between white and black youth who stayed in outdoor locations and cars were not quite statistically significant (p=.057).
Limitations
All data in this study is self-reported, leaving it open to recall error or false reporting.
However, the effects of the few individuals who might be expected to answer incorrectly or dishonestly should be negated by the large sample size. Although the sample size for this study is
large enough to be representative of youth in Metro Nashville Public High Schools and provide confidence in the generalizability of the results to the population surveyed, some of the analyses performed were on subsets of the data with small sample sizes. These small sample sizes can make it difficult to detect true differences between groups. Because the sample is specific to one school district in one county, the results cannot be generalized beyond that population of public high school youth. This data is primarily descriptive and does not speak to causality of homeless experience among youth. For example, although research tells us that family conflict is a primary reason why youth experience homelessness, these data do not speak to any reasons why the youth surveyed reported a homeless experience.
Implications
This report provides new and important information about the scope of the runaway, throwaway and homeless youth issue in Nashville, Tennessee. With this understanding that more than 1 in 5 public high school youth have experienced homelessness for at least one night, much work remains to be done.
Practice
Intervening now with youth who have or who are likely to experience a homeless episode is a wise step toward reducing problems in the future. Research shows that being homeless as a youth is a strong predictor of being homeless as an adult, which leads to added burden on city, state and federal funding sources that serve the homeless population (Whitbeck & Hoyt, 1999).
Because of the evidence that high school seniors are more at risk of a throwaway episode, programs should be considered that could educate families on the continuing developmental needs of young people as they approach the age of eighteen, and that offer resources to aid in the
resolution of family conflicts that may arise at this stage. Targeting the youth alone is not enough – families and communities must also understand the needs of a young person and this time and be prepared to offer the support necessary to keep that young person in a safe, supportive environment until he or she is prepared to be successful on his or her own.
Policy
Realizing that more than 20% of our public high school youth have experienced at least one night in a homeless situation should move policymakers toward funding successful
prevention and intervention programming. Considering ways to keep young people off the streets in the first place should be the primary concern of policymakers. Agencies, both public and private, that serve these young people should coordinate their efforts to identify young people who are at risk of experiencing a homeless episode and target appealing services to those individuals to prevent it. For those young people currently experiencing such an episode,
services must be accessible, appealing and non-threatening to the independence that is the young person‟s developmental task.
Research
Further research is needed to understand the factors that contribute to the likelihood that a youth will have a homeless experience in Nashville. We need to understand what puts a young person at risk for running away or being kicked out of their home. Not only do the factors leading to homelessness and the experiences themselves need further examination in terms of what contributes to differing outcomes, but the individual, family, and community characteristics that lead to positive outcomes also need further study so that these strengths might be built upon to improve the outcomes of more youth in broader contexts.
Research is also needed to determine the best programs for preventing episodes of youth homelessness, as well as the specific factors that make interventions successful for these young people. The research needs to move beyond understanding what leads young people to
homelessness to what it will take to lead them out of it, never to return again.
References
Auerswald, C. L., & Eyre, S. L. (2002). Youth homelessness in San Francisco: A life cycle approach. Social Science and Medicine, 54(10), 1497-1512.
Aviles, A., & Helfrich, C. (2004). Life skill service needs: Perspectives of homeless youth.
Journal of Youth and Adolescence, 33(4), 331-338.
Baer, J. S., Ginzler, J. A., & Peterson, P. L. (2003). DSM-IV alcohol and substance abuse and dependence in homeless youth. Journal of Studies on Alcohol, 64(1), 5-14.
Barkin, S. L., Balkrishnan, R., Manuel, J., Andersen, R. M., & Gelberg, L. (2003). Health care utilization among homeless adolescents and young adults. Journal of Adolescent Health, 32(4), 253-256.
Bender, K., Thompson, S. J., McManus, H., Lantry, J., & Flynn, P. M. (2007). Capacity for survival: Exploring strengths of homeless street youth. Child Youth Care Forum, 36, 25- 42.
Bernstein, N., & Foster, L. K. (2008). Voices From the Street: A Survey of Homeless Youth by Their Peers. California Research Bureau.
Bronfenbrenner, U. (1977). Toward an experimental ecology of human development. American Psychologist, July 1977, 513-531.
Brooks, R. A., Milburn, N. G., Rotheram-Borus, M. J., & Witkin, A. (2004). The system-of-care for homeless youth: Perceptions of service providers. Evaluation and Program Planning, 27(4), 443-451.
Carlson, J., Sugano, E., Millstein, S. G., & Auerswald, C. L. (2006). Service utilization and the life cycle of youth homelessness. Journal of Adolescent Health, 38, 624-627.
Cauce, A. M., Paradise, M., Ginzler, J. A., Embry, L. E., Morgan, C. J., Lohr, Y., et al. (2000).
The characteristics and mental health of homeless adolescents. Journal of Emotional and Behavioral Disorders, 8(4), 230-239.
Cauce, A. M., Stewart, A., Whitbeck, L. B., Paradise, M., & Hoyt, D. R. (Eds.). (2005). Girls on their Own: Homelessness in Female Adolescents. Issues in clinical child psychology.
New York, NY, US: Kluwer Academic / Plenum Publishers.
County of Monterey. (2002). Homeless Census and Homeless Youth/Foster Teen Study.
Dachner, N., & Tarasuk, V. (2002). Homeless "squeegee kids”: Food insecurity and daily survival. Social Science & Medicine, 54(7), 1039-1049.
DeRosa, C. J., Montgomery, S. B., Kipke, M. D., Iverson, E., Ma, J. L., & Unger, J. B. (1999).
Service utilization among homeless and runaway youth in Los Angeles, California: Rates and reasons. Journal of Adolescent Health, 24(3), 190-200.
Dostaler, T., & Nelson, G. (2003). A process and outcome evaluation of a shelter for homeless young women. Canadian Journal of Community Mental Health, 22(1), 99-112.
Ensign, J., & Bell, M. (2004). Illness Experiences of Homeless Youth. Qualitative Health Research, 14(9), 1239-1254.
Ferguson, K. M., Dabir, N., Dortzbach, K., Dyrness, G., & Spruijt Metz, D. (2006). Comparative analysis of faith-based programs serving homeless and street-living youth in Los
Angeles, Mumbai and Nairobi. Children and Youth Services Review, 28(12), 1512-1527.
Gaetz, S. (2004). Safe Streets for Whom? Homeless Youth, Social Exclusion, and Criminal Victimization. Canadian Journal of Criminology and Criminal Justice, 46(4), 423-455.
Greene, J. M., Sanchez, R. P., Harris, J., Cignetti, C., Akin, D., & Wheeless, S. (2003). Incidence and Prevalence of Homeless and Runaway Youth. U.S. Department of Health and Human Services.
Gwadz, M. V., Nish, D., Leonard, N. R., & Strauss, S. M. (2006). Gender differences in traumatic events and rates of posttraumatic stress disorder among homeless youth.
Journal of Adolescence, 30, 117-129.
Haber, M. G., & Toro, P. A. (2004). Homelessness among families, children and adolescents: An ecological-developmental perspective. Clinical Child and Family Psychology Review, 7(3), 123-164.
Haldenby, A. M., Berman, H., & Forchuk, C. (2007). Homelessness and health in adolescents.
Qualitative Health Research, 17(9), 1232-1244.
Hammer, H., Finkelhor, D., & Sedlak, A. J. (2002). Runaway/Thrownaway Children: National Estimates and Characteristics.
Higgit, N., Wingert, S., & Ristock, J. (2003). Voices from the Margins: Experiences of Street- Involved Youth in Winnipeg. Winnipeg Inner-city Research Alliance.
Hyde, J. (2005). From home to street: Understanding young people's transitions into homelessness. Journal of Adolescence, 28, 171-183.
Johnson, K. D., Whitbeck, L. B., & Hoyt, D. R. (2005). Predictors of social network composition among homeless and runaway adolescents. Journal of Adolescence, 28(2), 231-248.
Joniak, E. A. (2005). Exclusionary Practices and the Delegitimization of Client Voice: How Staff Create, Sustain, and Escalate Conflict in a Drop-In Center for Street Kids. American Behavioral Scientist, 48(8), 961-988.
Kelly, K., & Caputo, T. (2007). Health and street/homeless youth. Journal of Health Psychology, 12(5), 726-736.
Kidd, S. A. (2007). Youth homelessness and social stigma. Journal of Youth and Adolescence, 36, 291-299.
Kidd, S. A. (2003). Street Youth: Coping and Interventions. Child and Adolescent Social Work Journal, 20(4), 235-261.
Kidd, S. A., & Davidson, L. (2007). "You have to adapt because you have no other choice": The stories of strength and resilience of 208 homeless youth in New York City and Toronto.
Journal of Community Psychology, 35(2), 219-238.
Kidd, S. A., Miner, S., Walker, D., & Davidson, L. (2006). Stories of working with homeless youth: On being "mind-boggling". Children and Youth Services Review, 29, 16-34.
Klein, J. D., Woods, A. H., Wilson, K. M., Prospero, M., Greene, J. M., & Ringwalt, C. L.
(2000). Homeless and runaway youths' access to health care. Journal of Adolescent Health, 27(5), 331-339.
Kurtz, P. D., Lindsey, E. W., Jarvis, S., & Nackerud, L. (2000). How runaway and homeless youth navigate troubled waters: The role of formal and informal helpers. Child and Adolescent Social Work Journal, 17(5), 381-402.
Kushel, M. B., Yen, I. H., Gee, L., & Courtney, M. E. (2007). Homelessness and health care access after emancipation - Results from the midwest evaluation of adult functioning of former foster youth. Archives of Pediatrics & Adolescent Medicine, 161(10), 986-993.
Laursen, E. K., & Birmingham, S. M. (2003). Caring Relationships as a Protective Factor for At- Risk Youth: An Ethnographic Study. Families in Society, 84(2), 240-246.
Levin, R., Bax, E., McKean, L., & Schoggen, L. (2005, March). Wherever I Can Lay My Head:
Homeless Youth on Homelessness. Center for Impact Research.
Lindsey, E. W., Kurtz, P. D., Jarvis, S., Williams, N. R., & Nackerud, L. (2000). How runaway and homeless youth navigate troubled waters: Personal strengths and resources. Child and Adolescent Social Work Journal, 17(2), 115-140.
Lindsey, E. W., & Williams, N. R. (2002). How runaway and homeless youth survive adversity:
Implications for school social workers and educators. School Social Work Journal, 27(1), 1-22.