1
2
IIMK/WPS/152/STR/2014/10 Strategic Planning and Performance -
A Systematic Review of the Literature M.K. Nandakumar
1
1 Assistant Professor, Indian Institute of Management Kozhikode, IIMK Campus PO, Kozhikode–
673570, email: [email protected]
3
STRATEGIC PLANNING AND PERFORMANCE - A SYSTEMATIC REVIEW OF THE LITERATURE
A large number of empirical studies have been conducted examining the impact of strategic planning on organisational performance. Many studies have suggested that this relationship is influenced by various factors like the type of industry, environment, CEO characteristics and organisational systems. However researchers have not been able to provide conclusive evidence about the effectiveness of strategic planning to enhance performance.
In order to examine the current state of the literature and to summarise the findings from various empirical studies, a comprehensive literature review has been conducted by reviewing sixty eight papers published in leading academic journals. The framework followed by Podsakoff and Dalton (1987) was adapted to conduct the literature review.
1. INTRODUCTION
Formal strategic planning is an explicit and ongoing organisational process with several components, including establishment of goals and generation and evaluation of strategies (Armstrong, 1982; Steiner, 1979; Boyd, 1991). According to Ansoff (1991) strategic planning generally results in better alignment and financial performance than trial-and-error learning. However this view is challenged by a number of scholars and they argue that strategic planning causes too much rigidity. Empirical research conducted in the last three decades has not produced conclusive evidence to support either of these views (Mintzberg, 1991; Pearce, Freeman & Robinson, 1987). In order to examine the findings of previous studies a systematic literature review of the papers published in leading academic journals between 1975 and 2005 was conducted. The contents pages of the following journals were thoroughly searched for articles examining the relationship between strategic planning and performance: Strategic Management Journal; Academy of Management Journal; Academy of
Management Review; Journal of Management; Journal of Management Studies; Long Range Planning; and British Journal of Management.The electronic databases namely Business Source Complete, JSTOR and Emerald were also searched in the title, author supplied key words and abstract using the key words like
‘strategic planning’, ‘planning’, ‘strategy’ and ‘performance’. Following the guidelines provided by Podsakoff and Dalton (1987) the following details in the papers were examined:
(i) Type of firm / Industry sector, (ii) Sample size, (iii) Sampling technique, (iv) Country of
origin, (v) Aim of the study, (vi) Data collection method, (vii) Positions of the respondents,
(viii) Constructs used to measure strategic planning, (ix) Constructs used to measure
4
organisational performance, (x) Method(s) of analysis and (xi) Results. Altogether sixty seven studies were examined and the full literature review is provided in Appendices 1, 2 and 3. The main findings from the literature review are presented in the following sections.
2.1 TYPE OF FIRMS / INDUSTRY SECTOR
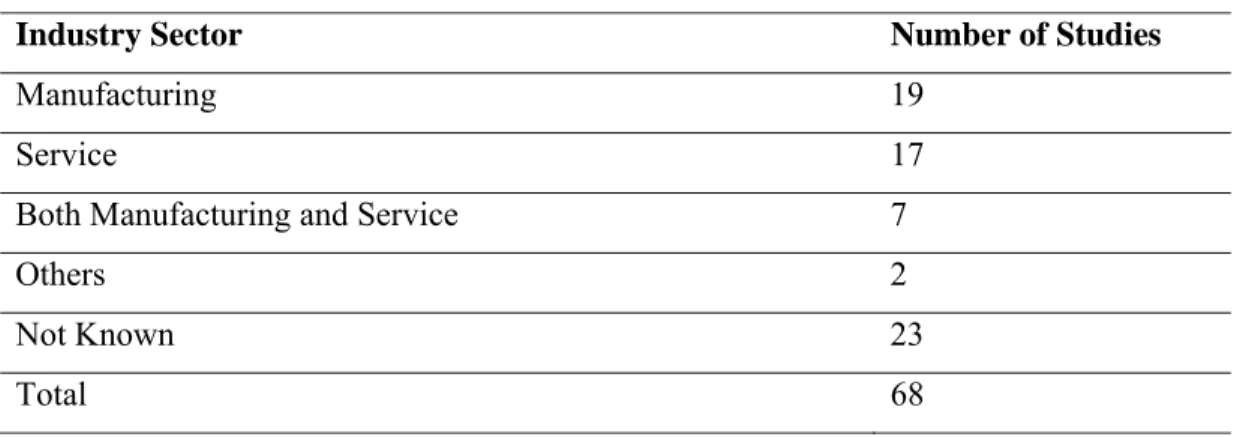
Organisations belonging to both manufacturing and service sectors were studied by the scholars. A number of studies were focussed only on either manufacturing firms or service firms. However in some studies both manufacturing and service organisations were included in the sample. Altogether twenty studies focussed on small firms, but many of them did not clearly define small firms and hence it is difficult to generalise the findings of these studies.
The industry sectors were not clearly specified in a number of studies and hence it is difficult to compare the findings. The number studies focusing on the manufacturing, service and other sectors are shown in Table 1.
Table 1: Number of Studies Focusing on Different Sectors
Industry Sector Number of Studies
Manufacturing 19 Service 17
Both Manufacturing and Service 7
Others 2
Not Known 23
Total 68
Among the studies focusing on manufacturing and service organisations the number of studies focusing on single industry and different industries are shown in Table 2.
Table 2: Studies Focusing on Single Industry and Different Industries
Manufacturing Firms Service Firms
Single Industry Different Industries Single Industry Different Industries
5 14 17 0
While there were only five studies focusing on single industry in the manufacturing sector, all
the studies in the service sector focused on single industry. Out of the seventeen studies in the
5
service sector, ten were based on financial organisations including commercial banks.
However among studies in the manufacturing sector, only five studies focused on engineering firms.
The above analysis indicates that a substantial number of studies did not clearly define the target industry sectors. In the studies focussing on service organisations, the sectors were clearly defined. There is a need to conduct more studies on the manufacturing organisations by clearly defining the industry sector. Hence this study will make a significant contribution to the literature by focusing on the manufacturing sector and targeting electrical and mechanical engineering firms.
2.2 SAMPLE SIZE
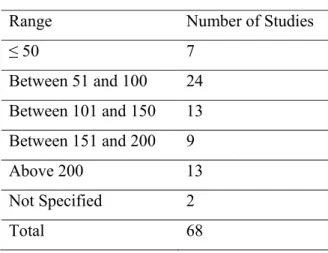
The sample size used in the studies are summarised in Table 3.
Table 3: Sample Size used
Range Number of Studies
≤ 50
7
Between 51 and 100 24 Between 101 and 150 13 Between 151 and 200 9
Above 200 13
Not Specified 2
Total 68
This table indicates that in thirty one studies out of sixty eight (nearly 50%) the sample size used was below 100. This may affect the accuracy of the findings.
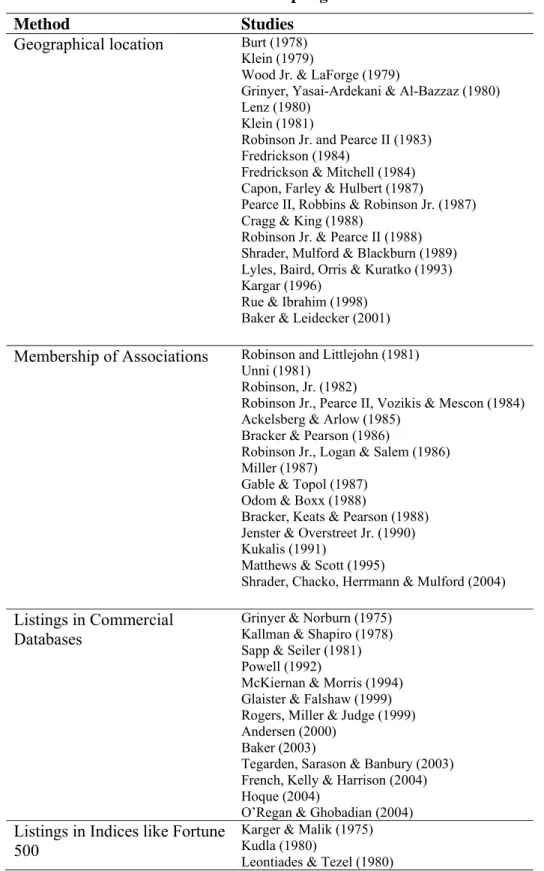
2.3 SAMPLING TECHNIQUE
The sampling technique used was specified in sixty six out of sixty eight studies. In most of
the studies the sampling frame was selected on the basis of a combination of criteria like
industry classification codes, geographical location and membership of associations like
credit unions. In order to identify the method of selecting samples in those studies a four-fold
classification scheme consisting of methods namely geographical location, membership of
associations, listings in commercial databases and listings in indices like Fortune 500, has
6
been developed. The studies have been classified under these four headings on the basis of the fundamental method used for generating samples and this classification is shown in Table 4.
Table 4: Sampling Methods
Method Studies
Geographical location
Burt (1978)Klein (1979)
Wood Jr. & LaForge (1979)
Grinyer, Yasai-Ardekani & Al-Bazzaz (1980) Lenz (1980)
Klein (1981)
Robinson Jr. and Pearce II (1983) Fredrickson (1984)
Fredrickson & Mitchell (1984) Capon, Farley & Hulbert (1987)
Pearce II, Robbins & Robinson Jr. (1987) Cragg & King (1988)
Robinson Jr. & Pearce II (1988) Shrader, Mulford & Blackburn (1989) Lyles, Baird, Orris & Kuratko (1993) Kargar (1996)
Rue & Ibrahim (1998) Baker & Leidecker (2001)
Membership of Associations
Robinson and Littlejohn (1981)Unni (1981) Robinson, Jr. (1982)
Robinson Jr., Pearce II, Vozikis & Mescon (1984) Ackelsberg & Arlow (1985)
Bracker & Pearson (1986)
Robinson Jr., Logan & Salem (1986) Miller (1987)
Gable & Topol (1987) Odom & Boxx (1988)
Bracker, Keats & Pearson (1988) Jenster & Overstreet Jr. (1990) Kukalis (1991)
Matthews & Scott (1995)
Shrader, Chacko, Herrmann & Mulford (2004)
Listings in Commercial
Databases
Grinyer & Norburn (1975) Kallman & Shapiro (1978) Sapp & Seiler (1981) Powell (1992)
McKiernan & Morris (1994) Glaister & Falshaw (1999) Rogers, Miller & Judge (1999) Andersen (2000)
Baker (2003)
Tegarden, Sarason & Banbury (2003) French, Kelly & Harrison (2004) Hoque (2004)
O’Regan & Ghobadian (2004)
Listings in Indices like Fortune
500
Karger & Malik (1975) Kudla (1980)
Leontiades & Tezel (1980)
7 Beard & Dess (1981)
Kudla (1981) Kudla & Cesta (1982) Jones (1982)
Welch (1984) Rhyne (1986)
Ramanujam, Venkatraman & Camillus (1986) Shuman & Seeger (1986)
Ramanujam & Venkatraman (1987a) Ramanujam & Venkatraman (1987b) Rhyne (1987)
Ramanujam & Venkatraman (1988) Olson & Bokor (1995)
Goll & Rasheed (1997) Gibson & Cassar (2002)
Others
Woodburn (1984)Orpen (1985) Orpen (1993)
Hopkins & Hopkins (1997)
In some of the studies organisations belonging to the whole sampling frame were included.
However when a large number of organisations is present in the sampling frame, authors have generated either a simple random sample or a stratified random sample. As shown in Table 4 most of the recent studies have used commercial databases for generating samples.
Arguably this is because of the increased availability of commercial databases in the recent years. In this study a simple random sample of organisations was generated from a leading commercial database.
2.4 AIMS OF THE STUDIES
Basically all the studies have examined the impact of strategic planning on organisational performance. The extent of planning carried out in organisations have been measured using various constructs (discussed in section 2.6) and its relationship with organisational performance measured using the constructs indicated in section 2.7 have been examined.
2.5 COUNTRY OF ORIGIN, DATA COLLECTION METHODS AND RESPONDENTS
Fifty four out of sixty eight studies have been conducted in the United States. Only seven studies have examined UK based organisations and hence there is a need for more studies focused on the UK.
In fifty four out of sixty eight studies, postal survey was used to collect primary data.
However in five of those studies postal survey data was augmented by interviews. Two
studies relied solely on secondary data.
8
In forty seven out of sixty eight studies Chief Executives and Senior Managers were the respondents. However in fourteen studies the positions of the respondents in the organisations were not specified. Other executives were the respondents in the remaining studies.
2.6 CONSTRUCTS USED TO MEASURE STRATEGIC PLANNING
Authors used a number of constructs to measure strategic planning while conducting these studies. These constructs are shown in Appendix 3. An examination of these constructs indicates that there are substantial differences in the constructs used by various authors in their studies. Boyd and Reuning-Elliott (1998), after examining several studies concluded that there was remarkably little consistency in the operationalisation of the strategic planning construct. The authors found that planning was defined in numerous ways in the studies. The dimensions used to define strategic planning in those studies were the following: formality, sophistication, effectiveness, comprehensiveness, extensiveness, completeness, importance, rationality, analysis, goal setting, scanning and analysis, process, factors, systems, openness, innovativeness, characteristics, capabilities and strategy. A vast majority of the studies have defined strategic planning as the formality or importance associated with its indicators (Pearce, Freeman and Robinson, 1987) a small number of studies used skills and abilities vs.
aspects or elements (e.g. Venkatraman and Ramanujam, 1987). Boyd and Reuning-Elliott (1998) defined strategic planning as a normative process and identified the following items as key indicators of strategic planning: mission statements, trend analysis, competitor analysis, long-term and annual goals, action plans and ongoing evaluation.
2.7 CONSTRUCTS USED TO MEASURE ORGANISATIONAL PERFORMANCE
The constructs used to measure organisational performance in the studies are shown in
Appendix 3. As indicated in this table, financial performance measures like financial ratios,
sales growth and profitability growth have been used in most of the studies. Return on Assets
(ROA), Return on Equity (ROE) and Return on Sales (ROS) are the most commonly used
financial ratios to measure performance. However Kudla (1981) used reduction of risk as a
performance measure. This is an important construct because the findings of Kudla (1981)
indicate that while the firms were engaged in strategic planning they were able to reduce the
risk. The literature review shows that only a few non-financial performance measures were
used in the studies linking strategic planning and performance.
9 2.8 METHODS OF DATA ANALYSIS
A number of analytical techniques like correlation analysis, regression analysis, t-test, ANOVA and Chi-Square test have been used in the studies. The extent of the use of these analytical techniques is summarised in Table 5.
Table 5: Analytical Techniques used Analytical Technique No. of times used
Correlation Analysis 24
Regression Analysis 14 Logistic Regression 1 Moderated Regression Analysis 1
t-test 23
Chi-Square test 15
Percentage Comparisons 8 Cross Tabulations 4
ANOVA 13 MANOVA 4 ANCOVA 1 Discriminant Analysis 6
Canonical Correlation Analysis 4 Kendall Tau Rank Correlation 2
Wilcoxon Test 1
Structural Equation Modelling 2
As indicated in Table 5 the most widely used analytical methods in examining the
relationship between strategic planning and performance are correlation analysis, regression
analysis, t-test, Chi-Square test and ANOVA. Regression analysis and correlation analysis
were used to determine the relationship between strategic planning on performance. The t-
test, ANOVA and Chi-Square test are mainly used to compare the performance of planners
and non-planners. Most of the studies have examined bivariate relationships and this could be
one of the main drawbacks of the studies. The relationships may change if more variables are
10
studied together. Structural equation modelling technique which could be used to examine multivariate causal relationships was used only twice. In this study, multivariate relationships are examined using partial least squares (PLS) which is a structural equation modelling technique.
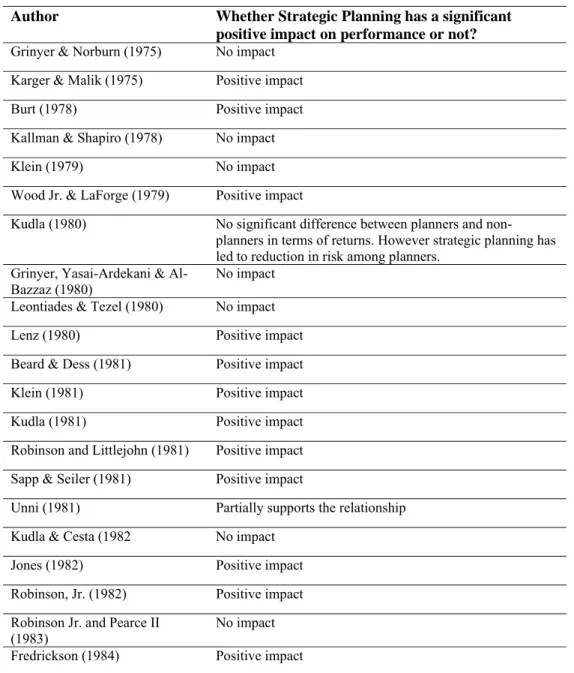
2.9 RESULTS OF THE STUDIES
The results of the studies examining the relationship between strategic planning and organisational performance are presented in Table 6.
Table 6: Results of the Studies
Author Whether Strategic Planning has a significant positive impact on performance or not?
Grinyer & Norburn (1975) No impact Karger & Malik (1975) Positive impact
Burt (1978) Positive impact
Kallman & Shapiro (1978) No impact
Klein (1979) No impact
Wood Jr. & LaForge (1979) Positive impact
Kudla (1980) No significant difference between planners and non- planners in terms of returns. However strategic planning has led to reduction in risk among planners.
Grinyer, Yasai-Ardekani & Al-
Bazzaz (1980) No impact
Leontiades & Tezel (1980) No impact
Lenz (1980) Positive impact
Beard & Dess (1981) Positive impact
Klein (1981) Positive impact
Kudla (1981) Positive impact
Robinson and Littlejohn (1981) Positive impact Sapp & Seiler (1981) Positive impact
Unni (1981) Partially supports the relationship Kudla & Cesta (1982 No impact
Jones (1982) Positive impact
Robinson, Jr. (1982) Positive impact Robinson Jr. and Pearce II
(1983) No impact
Fredrickson (1984) Positive impact
11 Fredrickson & Mitchell (1984) No impact
Robinson Jr., Pearce II, Vozikis
& Mescon (1984)
Positive impact
Welch (1984) Positive impact
Woodburn (1984) Positive impact
Ackelsberg and Arlow (1985) Positive impact
Orpen (1985) Positive impact
Rhyne (1986) Positive impact
Bracker and Pearson (1986) Positive impact Robinson Jr., Logan & Salem
(1986) Positive impact
Ramanujam, Venkatraman &
Camillus (1986) Positive impact
Shuman & Seeger (1986) Positive impact
Miller (1987) Positive impact
Ramanujam & Venkatraman
(1987a) Positive impact
Capon, Farley and Hulbert
(1987) Partially supports the relationship
Gable & Topol (1987) No impact Pearce II, Robbins & Robinson
Jr. (1987) Positive impact
Ramanujam & Venkatraman
(1987b) Positive impact
Rhyne (1987) Positive impact
Ramanujam & Venkatraman
(1988) Positive impact
Odom & Boxx (1988) Positive impact Bracker, Keats & Pearson (1988) Positive impact Cragg & King (1988) No impact Robinson Jr. & Pearce II (1988) Positive impact Shrader, Mulford & Blackburn
(1989) Positive impact
Jenster and Overstreet Jr. (1990) Positive impact
Kukalis (1991) Positive impact
Powell (1992) Relationship is industry dependent Lyles, Baird, Orris & Kuratko
(1993) Partially supports the relationship
Orpen (1993) Positive impact
McKiernan & Morris (1994) No impact
Matthews & Scott (1995) Strategic planning decreases if perceived environmental uncertainty increases
Olson & Bokor (1995) Positive impact
12 Kargar (1996) Partially supports the relationship
Goll and Rasheed (1997) Positive impact Hopkins & Hopkins (1997) Positive impact Rue & Ibrahim (1998) Positive impact
Glaister & Falshaw (1999) Partially supports the relationship Rogers, Miller & Judge (1999) Positive impact
Andersen (2000) Positive impact
Baker & Leidecker (2001) Positive impact Gibson & Cassar (2002) Positive impact
Baker (2003) Positive impact
Tegarden, Sarason & Banbury
(2003) Partially supports the relationship
French, Kelly & Harrison (2004) Partially supports the relationship Shrader, Chacko, Herrmann &
Mulford (2004) Positive impact
Hoque (2004) Partially supports the relationship O’Regan & Ghobadian (2004) Positive impact
The numbers of the studies which have found a positive relationship between strategic planning and performance and the ones which have not found this relationship significant are summarised in Table 7.
Table 7: Summary of the Findings
Nature of Relationship No. of Studies
Positive impact of strategic planning on performance 46
Partially supports this relationship 8 No impact of strategic planning on performance 11
Other results 3
Total 68 The results indicate that a vast majority of the studies have reported a positive relationship
between strategic planning and organisational performance. However some of the studies have reported that the relationship between strategic planning and performance is contingent on the operating environment (e.g. Fredrickson, 1984; Fredrickson & Mitchell, 1984; Goll &
Rasheed, 1997). Eleven studies did not find a positive relationship between planning and
performance. There could be number of reasons behind these findings like differences in the
characteristics of operating environments and variations in the constructs used to measure
13
strategic planning and performance. This also indicates the need for further studies examining this relationship.
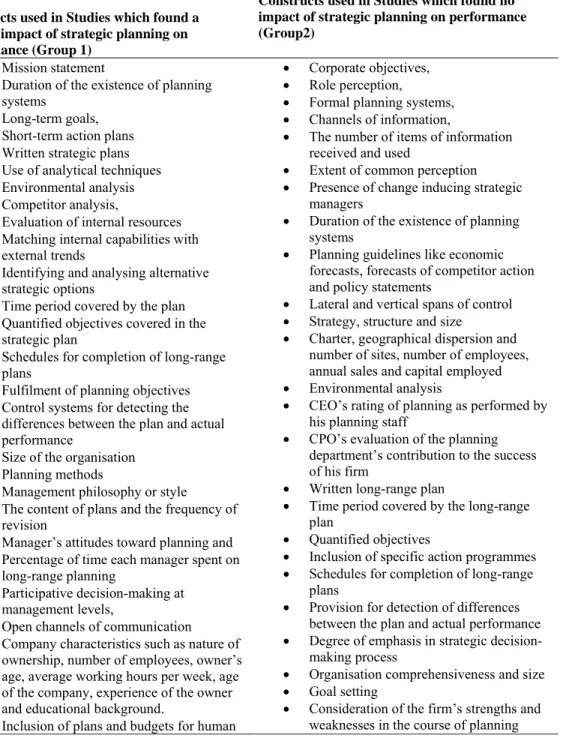
The studies which found a positive relationship between strategic planning and organisational performance and the studies which found no impact were grouped separately. The constructs used to operationalise strategic planning in these two groups of studies are presented in Table 8.
Table 8: Comparison of Constructs used in two Groups of Studies
Constructs used in Studies which found a positive impact of strategic planning on performance (Group 1)
Constructs used in Studies which found no impact of strategic planning on performance (Group2)
• Mission statement
• Duration of the existence of planning systems
• Long-term goals,
• Short-term action plans
• Written strategic plans
• Use of analytical techniques
• Environmental analysis
• Competitor analysis,
• Evaluation of internal resources
• Matching internal capabilities with external trends
• Identifying and analysing alternative strategic options
• Time period covered by the plan
• Quantified objectives covered in the strategic plan
• Schedules for completion of long-range plans
• Fulfilment of planning objectives
• Control systems for detecting the differences between the plan and actual performance
• Size of the organisation
• Planning methods
• Management philosophy or style
• The content of plans and the frequency of revision
• Manager’s attitudes toward planning and
• Percentage of time each manager spent on long-range planning
• Participative decision-making at management levels,
• Open channels of communication
• Company characteristics such as nature of ownership, number of employees, owner’s age, average working hours per week, age of the company, experience of the owner and educational background.
• Inclusion of plans and budgets for human
• Corporate objectives,
• Role perception,
• Formal planning systems,
• Channels of information,
• The number of items of information received and used
• Extent of common perception
• Presence of change inducing strategic managers
• Duration of the existence of planning systems
• Planning guidelines like economic forecasts, forecasts of competitor action and policy statements
• Lateral and vertical spans of control
• Strategy, structure and size
• Charter, geographical dispersion and number of sites, number of employees, annual sales and capital employed
• Environmental analysis
• CEO’s rating of planning as performed by his planning staff
• CPO’s evaluation of the planning department’s contribution to the success of his firm
• Written long-range plan
• Time period covered by the long-range plan
• Quantified objectives
• Inclusion of specific action programmes
• Schedules for completion of long-range plans
• Provision for detection of differences between the plan and actual performance
• Degree of emphasis in strategic decision- making process
• Organisation comprehensiveness and size
• Goal setting
• Consideration of the firm’s strengths and weaknesses in the course of planning
14 resources, hiring and personnel
development, plant expansion, equipment acquisition, R&D, advertising, technology acquisition and utilisation
activities
• Consideration of alternative strategies
• Preparation of budgets and contingency plans
• Updating the plans
• Organisational characteristics and owner / manager characteristics
As shown in Table 8 the constructs used to operationalise strategic planning in the studies belonging to Group 1 are more or less consistent with the key indicators of strategic planning identified by Reuning-Elliott (1998). However some of the constructs used in studies belonging to Group 2 such as the number of items of information received and used, the extent of common perception and organisation comprehensiveness are not consistent with the key indicators identified by Reuning-Elliott (1998) and could be difficult to measure in empirical studies. Lack of conformity of strategic planning constructs to the key indicators could be one of the main reasons why studies belonging to Group 2 did not find a positive relationship between strategic planning and performance.
3. CONCLUSION
A summary of the key findings from the literature review are:
•
There is a need to conduct more studies on the manufacturing organisations by clearly defining the industry sector;
•
In almost 50% of the studies, the sample size used was below 100 which could be a serious drawback;
•
Only seven studies have examined UK based organisations and hence there is a need for more studies focused on the UK;
•
There has been little consistency in the operationalisation of the strategic planning construct;
•
Financial measures like financial ratios, sales growth, profitability growth etc have been used in most of the studies to measure organisational performance;
•
The most widely used analytical methods in examining the relationship between strategic planning and performance are correlation analysis, regression analysis, t-test, Chi-Square test and ANOVA; and
•
Even though a vast majority of the studies have reported a positive relationship between
strategic planning and organisational performance, a significant number of studies did
not confirm this relationship.
15
The literature review indicated the need for conducting further studies examining the relationship between strategic planning and performance. While some of the studies found a positive relationship between strategic planning and performance (e.g. Jones, 1982; Orpen, 1985; Baker 2003) some others did not find a significant impact (e.g. Robinson Jr. and Pearce II, 1983; Gable & Topol, 1987; McKiernan & Morris, 1994). As indicated by some of the studies, since this relationship is contingent upon the operating environment, the moderating effect of environment in this relationship also needs to be examined.
The planning mode of strategy making proposed by Mintzberg (1973) and the rational mode of strategy making suggested by Hart (1992) are characterised by the rational-comprehensive approach to strategy making (Priem, Rasheed & Kotulic, 1995). The findings of some studies indicate that the rational-comprehensive approach to strategy making is beneficial in stable environments and harmful in dynamic environments. Fredrickson (1984) found a positive relationship between planning rationality and performance in a stable environment.
Fredrickson and Mitchell (1984) conducted a study among companies belonging to the
sawmills and planing industry (dynamic environment) in the United States and found that
there was a negative relationship between planning and performance. However some other
studies indicate that planning rationality leads to higher performance in dynamic
environments. Miller and Friesen (1983) after studying two samples of organisations
consisting of US firms and Canadian firms found that for high performing firms, increases in
environmental dynamism are accompanied by increases in planning rationality. Eisenhardt
(1989) studied microcomputer industry (dynamic environment) and found that effective
organisations belonging to that industry analyse more strategic alternatives which is an
indication of planning rationality. Judge and Miller (1991) found that in a dynamic
environment, speedy and comprehensive decision making is associated with high
performance. In a study on manufacturing firms, Priem, Rasheed and Kotulic (1995) found a
positive relationship between rationality in strategic decision processes and performance in a
dynamic environment and no relationship between rationality and performance in a stable
environment. Goll and Rasheed (1997) studied manufacturing firms and found that
environmental munificence and dynamism moderate the relationship between rationality and
performance. They found that rationality in strategic decision-making was strongly related to
performance in highly munificent and dynamic environments. Hough and White (2003) in a
study conducted among Fortune 100 diversified technology companies found that
environmental dynamism moderated the relationship between rational strategic decision
16
making and decision quality. The studies have not produced conclusive evidence regarding
the moderating effect of environment in the relationship between strategic planning and
performance. Hence the nature and degree of environmental moderation need to be
investigated in future studies. The systematic literature review identified the need for
conducting more studies examining the relationship between strategic planning and
performance. It was found that there were inconsistencies in the operationalisation of
strategic planning in empirical studies.
17
APPENDIX 1
Author Domain / Type of firm
Sample size (If small firms, definition used to classify firms as small)
Sampling technique Country of origin Grinyer &
Norburn (1975)
Commercial or
industrial segments 71 No earlier study of this kind had been done and the basic assumptions to be tested were general. Hence it was decided that the sample frame should satisfy the following criteria: (i) companies of disparate size of turnover, (ii) a range of profitability among the companies and (iii) access to companies. 71 public companies were selected based on the above criteria and this sample was stratified in order to satisfy the first criteria. They were divided into three groups as follows: Companies with annual turnover of (a) less than
£ 5 million (b) between £ 5 million and £ 25 million and (c) Over £ 25 million. An equal number of companies were randomly selected from each group and twenty-one of these companies agreed to
participate in the study. These organisations represented 13 sub- segments of the Standard Industrial Classification (S.I.C.).
United Kingdom
Karger &
Malik (1975) Companies belonging to five generic grouping namely (i) clothing, (ii) chemicals, drugs and cosmetics, (iii) electronics, (iv) food and (v) machinery.
273 273 companies with sales between
$50m and $500m, representing six categories of industries were selected from Moody’s Industrial Manual and Value Line Investment Survey. Based on the responses, only the electronics and machinery groups had meaningful sample size.
Chemicals were paired with drugs to produce a third measurable group of reasonable size.
United States
Burt (1978) Australian retailing
industry 20 Publicly listed firms located in the
eastern capital cities of Australia and Canberra.
Australia
Kallman &
Shapiro (1978)
Motor carrier firms 886 The carrier size, commodity handled and geographic area were determined from the Trincs Blue Book of the Trucking Industry.
Class I common carriers whose revenue exceeded $ 3m and which engaged in interstate commerce were selected for the study. In 1975 there were 886 such firms in the United States.
United States
18 Klein (1979) Commercial banks 144 All the commercial banks that are
members of the 7th Federal Reserve district and participants in the Functional Cost Analysis Program
United States
Wood Jr. &
LaForge (1979)
Large banks 50 50 largest banks located in the 10 states namely Alabama, Georgia, Pennsylvania, New York, North Carolina, Maryland, Illinois, Massachusetts, Virginia and Tennessee, were selected from Moody’s Bank and Finance Manual (1975).
United States
Kudla (1980) Firms belonging to a number of industries
557 Fortune’s 500 largest companies and 57 other firms which were believed to be engaged in strategic planning were sent the
questionnaire.
United States
Grinyer, Yasai- Ardekani &
Al-Bazzaz (1980)
Large organisations belonging to 18 different industries.
48 All the selected organisations had head offices in the Southeast of England. 25% of them were in service industries, 43% in
manufacturing and 32% in both. All the organisations were large with
£200 million average sales. 77%
were owned in the UK, 12% in the US, 4% in the EEC outside UK and 4% jointly by UK and non-UK residents.
United Kingdom
Leontiades &
Tezel (1980) Largest
industrialised firms 300 The sample was selected from Fortune magazine’s 1000 largest industrialised firms. A
representative number of companies were selected within the industries to avoid dominance by a single industry category.
United States
Lenz (1980) Savings and loan industry
80 A random sample of savings and
loan firms from a single state and Federal Home Loan Bank district was selected in order to control for differences in regulatory practice.
United States
Beard & Dess
(1981) Single-industry manufacturing firms
40 Single-industry manufacturing
firms included in Standard and Poors (1979). All firms included in the final sample were in one and the same industry for the years 1969 through 1974. A firm was considered to be a single-industry firm if and only if during the 1969- 1974 period a substantial majority and in most cases all of its sales could be clearly classified within one three digit SIC as defined by the US Office of Management and Budget (1972)
United States
Klein (1981) Commercial banks 144 The sample consisted of member banks of the Seventh Federal Reserve district.
United States
19 Kudla (1981) Firms belonging to
a number of industries
557 Fortune’s 500 largest companies and 57 other firms which were believed to be engaged in strategic planning were sent the
questionnaire.
United States
Robinson and Littlejohn (1981)
Small firms 67 (No definition of small firms was provided)
The sampling frame consisted of 127 small firms which have received in-depth consulting from University of Georgia Small Business Development Center (SBDC) since 1977 and evidencing a minimum of six months since completion of that consulting, and which have not engaged in systematic planning prior to their involvement with the SDBC. A random sample of 67 firms was selected for this study.
United States
Sapp & Seiler
(1981) Commercial Banks 500 Five hundred U.S. Commercial
banks were randomly selected through use of a computerised random number generator from a population of all U. S. banks larger than $10 million in total assets. A total of 302 of the 500 banks supplied sufficient information to permit classification into one of the four groups namely non-planners, beginning planners, intermediate planners and sophisticated planners.
United States
Unni (1981) Small businesses 80 minority and 80 non-minority small businesses. Only 62 minority and 58 non- minority small businesses responses were useable. The definition of small businesses was not provided.
The sample was selected from the Directory of Manufacturers published by the local Chamber of Commerce and from a list of minority small businesses published by an affiliate of the Office of Minority Business Enterprise and the U.S. Department of Commerce.
Only those firms that were in existence for at least 2 years were selected, assuming these firms reasonably have had occasion to use strategic planning during that time.
United States
Kudla &
Cesta (1982)
Firms belonging to a number of industries
557 Fortune’s 500 largest companies and 57 other firms which were believed to be engaged in strategic planning were sent the
questionnaire.
United States
Jones (1982) Small firms 200 (The definition of small firms was not provided)
The firms were selected from Dun and Bradstreet’s Million Dollar Survey (1980) – volumes II and III and the Survey of Virginia Industrial Firms. Seven different S.I.C. codes were represented in the sample and it included several different manufacturing and service industries. The final sample had 22 service and 47 manufacturing firms.
United States
20 Robinson, Jr.
(1982) Small firms 101 firms which had received SBDC consultation and two control groups with 101 and 61 firms respectively (A small firm was defined as the one having less than 50 employees, less than $ 3 million in annual sales and independently owned and operated)
The small firms that had received consultation from Small Business Development Center (SBDC) and two control groups not engaging in outsider-based planning were included in the sample. The first control group consisted of firms from RMA Annual Statement Studies (1978) which were matched with the SBDC sample by type of business (SIC code) and annual sales. The second control group was a random sample from the files of a northeast Georgia bookkeeping service and were similar to the SBDC sample by type of business (SIC code), annual sales and number of employees.
United States
Robinson Jr.
and Pearce II (1983)
Small banks 85 (The definition of small banks was not provided)
All federal and state-chartered commercial banks in South Carolina were included in the sample.
United States
Fredrickson
(1984) Paint and coatings
(SIC code 2851) 152 executives from
38 firms The study focussed on an industry with a stable environment. The paint and coatings industry was selected for the study because the sales growth and technological change was very limited in this industry. 51 firms located in the Eastern and Central United States were selected from Dun and Bradstreet’s (1981) Million Dollar Directory and 45 of them expressed interest in participating. The CEOs or Executive Vice Presidents of these 45 firms were interviewed in the first phase and finally 38 firms were identified for the second phase of the study.
United States
Fredrickson
& Mitchell (1984)
Sawmills and planing (SIC code 2421)
109 executives from
27 firms The study was focused on an industry with an unstable
environment and all firms had to be from the same industry. In order to make personal contacts, all firms needed to be headquartered in the Pacific Northwest. Potential research sites were identified in a review of Dun and Bradstreet’s Million Dollar Directory (1979) and Million Market Directory (1979) and contacted if their sole SIC number or one of the first two listed was 2421. 43 firms were contacted by letter and 34 of them agreed to participate. The CEOs of all the 34 firms were interviewed in the first phase and executives including CEOs from 27 firms were selected for the second phase of interviews.
United States
21 Robinson Jr.,
Pearce II, Vozikis &
Mescon (1984)
Small firms 51 (A small firm was defined as the one having less than 50 employees, less than
$ 3 million in annual sales and
independently owned and operated)
A random sample of firms that had engaged in outsider-based strategic planning consultation through the university of Georgia Small Business Development Center (SBDC) program was selected.
United States
Welch (1984) Organisations belonging to a number of industries
380 Organisations which were listed simultaneously in all the three locations namely the New York Stock Exchange, the Standard and Poor’s 400 Industrial Index and Public Utility Index and the Compustat files.
United States
Woodburn (1984)
Public and private organisations
3775 Not specified South Africa
Ackelsberg &
Arlow (1985)
Small business firms
732. The definition of small business firms was not provided.
Firms listed in the Chambers of Commerce in a six-county area in the eastern part of the United States
United States
Orpen (1985) Small firms 58 (The definition of small firms was not provided)
The sample consisted of small
businesses of different types. Not specified Rhyne (1986) Fortune 1000
companies 210 The sample was selected from
Fortune 1000 companies United States Bracker &
Pearson (1986)
Small mature firms in the dry cleaning industry
555 (The definition of small firms was not provided)
Members of the South-eastern
Fabricare Association (SEFA). United States Robinson Jr.,
Logan &
Salem (1986)
Small retail firms 800 (The definition of small retail firms was not provided)
Small independent food retailers that were members of the Food Retailers Association of South Carolina (FRASC) were included in the sample.
United States
Ramanujam, Venkatraman
& Camillus (1986)
Fortune 500 and
Inc 500 firms 600 A random sample was chosen from
the Fortune 500 Manufacturing, Fortune 500 service and Inc 500 directories
United States
Shuman &
Seeger (1986) Fastest growing privately held small companies
500 Companies belonging to the INC.
500 Class of 1983, representing the 500 fastest-growing privately-held companies in the US ranked by INC. magazine according to percentage of sales increase from 1978 through 1982, were selected as the sample for this study.
United States
Miller (1987) Small and medium
sized firms 131 A random sample was selected from
the lists published in Commerce and Les Affaires.
Canada
Ramanujam
&
Venkatraman (1987a)
Fortune 500 firms 600 A random sample was chosen from the Fortune 500 Manufacturing and Fortune 500 service directories
United States
Capon, Farley &
Hulbert
Major manufacturing corporations
155 Random sample selected from 258
Fortune 500 manufacturing companies headquartered East of
United States
22
(1987) the Mississippi River
Gable &
Topol (1987) Small-scale
retailers 489 (The definition of small-scale retailers was not provided)
From the membership list of the state-wide retailer’s association in the North east region of the United States, 489 small-scale retailers were identified and questionnaires were mailed to them.
United States
Pearce II, Robbins &
Robinson Jr.
(1987)
Manufacturing
firms 609 609 manufacturing firms in a single
eastern state were selected in order to introduce a measure of control over external, non-industry factors such as regulation, taxation and wage rates.
United States
Ramanujam
&
Venkatraman (1987b)
Large
organisations 600 The sample was chosen from
Fortune 1000 companies. United States
Rhyne (1987) Large public manufacturing companies found in the Fortune 1000 lists
210 companies for the survey and eleven executives participated in the interviews
A random sample stratified by sales level was selected from the 1980 Fortune 1000 lists.
United States
Ramanujam
&
Venkatraman (1988)
Fortune 1000 organisations
600 A random sample was chosen from
Fortune 1000 companies including the ones which were designated excellent by Peters and Waterman.
United States
Odom &
Boxx (1988)
Churches 253 The sample was selected from the
Arkansas Baptist State Convention which met one of the two
attendance criteria: (i) must have averaged 150 or more persons attending Sunday school during at least 1 reporting year in the 5-year period of the study (ii) had an average attendance of 100 or more persons during the entire 5-year period and sponsored a mission church.
United States
Bracker, Keats &
Pearson (1988)
The study is focussed on small firms more than 5 years old operating in a dynamic growth environment.
Electronics industry was chosen for the study because it could be
considered to be in the growth stage of the life cycle according to the definition put forward by Zeithaml and Fry (1984)
217 The names and addresses of the companies were obtained from the membership guide of the American Electronics Association (AEA). The firms included in the sample were privately held, had been in business at least 5 years, were owner / managed and had no more than 100 employees.
United States
23 Cragg &
King (1988) Small metal goods
manufacturers Responses were received from 578 firms. (The definition of small metal goods manufacturers was not provided)
The sample included all the metal goods manufacturing firms located in the East Midlands region of England. All the firms selected for the study met the following criteria:
(i) had no more than 50 employees, (ii) were independently owned and operated and (iii) were operating in early 1986. The names of the firms satisfying the above criteria were compiled from various sources such as training groups, trade directories and computerised Yellow Page records.
United Kingdom
Robinson Jr.
& Pearce II (1988)
Manufacturing firms belonging to different industries
609 A regionally restricted field setting was selected because of the following three reasons (i) to introduce greater control over external, non-industry factors (ii) to be able to use a current industrial directory of North Carolina as the basis for drawing a random sample and (iii) because of resource limitations to support this research.
United States
Shrader, Mulford &
Blackburn (1989)
Small firms 115 (Firms that employed at least ten but not more than 100 employees were considered as small firms)
A stratified random sample of small businesses located within a tri- county area in central Iowa was selected using information from the Dun and Bradstreet Market Identifiers File.
United States
Jenster &
Overstreet Jr.
(1990)
U. S. credit unions 283 Two questionnaires meant for the chairmen and managers respectively of the credit unions were developed under the sponsorship of the Virginia Credit Union. They were submitted to the chairman and manager of 283 Virginia credit unions.
United States
Kukalis
(1991) Large
manufacturing firms
200 The 200 largest manufacturing
firms based on sales were selected from the 1985 Directory of the North American Society for Corporate Planning.
United States
Powell
(1992) Single-business firms in two U.S.
four-digit SIC- code industries namely wooden upholstered furniture and women’s dresses, which have significant differences in strategic planning factor markets.
The total number of firms to which the questionnaires were sent, was not specified. A total of 113 firms responded to the questionnaire.
Questionnaires were mailed using Dillman’s Total Design Method to all the firms in SIC codes 2512 and 2335. Out of the 113 firms
responded, 68 were in SIC 2512 and 45 in SIC 2335.
United States
Lyles, Baird, Orris &
Kuratko (1993)
Small firms 188 (The firms which had been in business for at least four years, had fewer
All the small firms included in the sample were located in the Midwestern United States. The owners of the firms were contacted
United States
24 than 500 employees
and had gross sales of $1 million or more, were included in the sample)
over phone and an interview time was established. They were interviewed by students in a small business course.
Orpen (1993) Small firms 51 (The definition of small firms was not provided)
Only the local small firms
employing less than 50 persons and those which were not subsidiaries of larger firms or corporations were selected.
United Kingdom
McKiernan &
Morris (1994)
Small and medium-sized enterprises
3000 (Small manufacturing firms with up to 200 employees and medium-sized companies up to 500 employees were included in the sample)
From the Dun and Bradstreet database of over 200,000 companies, a random sample of 3000 SMEs covering 16 manufacturing sectors were selected.
United Kingdom
Matthews &
Scott (1995) Small and entrepreneurial firms
780 (Small and entrepreneurial firms with less than 500 employees were included in the sample. This was done according to the size standards established by the U.S. Small Business Administration)
The sample was randomly selected from a 1500 firm mailing list of the Chamber of Commerce of a large Midwestern city.
United States
Olson &
Bokor (1995)
Fastest growing privately held small businesses
442 The sample was selected from the list of 500 fastest growing, privately held small businesses in the United States published by Inc.
United States
Kargar
(1996) Small community
banks 69 (47 banks
responded and out of these 41 banks were chosen for analysis) Commercial banks with fewer than $500 million in total deposits were treated as small banks.
69 U.S commercial banks in the state of North Carolina represented the entire population.
United States
Goll &
Rasheed (1997)
Manufacturing
firms 159 645 largest manufacturing firms in
the United States as identified in Business Week (1985) were included in the sample.
United States
Hopkins &
Hopkins (1997)
Banks 350 Not specified United
States Rue &
Ibrahim (1998)
Small firms 1153 (Firms with at least fifteen full-time employees were included in the sample)
Two lists of small businesses in Georgia were used for selecting the sample. One list was developed by the Small Business Development Center at Georgia State University and the second list was a
commercially available mailing list purchased from Wholesale List Marketing. Random samples of 553 firms from the first list and 600
United States
25 firms from the second list were
selected.
Glaister &
Falshaw (1999)
Pubic limited companies belonging to both manufacturing and service sectors
500 A stratified random sample was
selected from the EXTEL database of U.K. listed companies.
United Kingdom
Rogers, Miller &
Judge (1999)
Banks 924 A random sample of banks within
the 1990 Rand McNally Bank Directory was selected.
United States Andersen
(2000) To investigate the model
relationships in different industrial settings and make comparisons to previous research results, the study was conducted on three distinct industry groups namely food and household products industries,
computer products industries and banking industry
456 The industry environment is
characterised by dynamism and complexity indices. Dynamism denotes the variance in the industry’s net sales and operating income and complexity reflects the diversity of inputs and outputs in the particular industry. The dynamism and complexity indices in different four-digit SIC industries extracted from Compustat helped the selection of industry groups and those indices for the chosen industries are explained below:
Food and household products: Low on dynamism and complexity Computer products: High level of dynamism and complexity Banking: A distinct services industry having levels of dynamism and complexity between food and household and computer products industries.
Annual reports from nearly 84% of all the firms included in the Compustat database in the selected industries were subjected to thorough analysis to ensure that single business firms and divisions were appropriately identified. Out of the 456 firms identified, 188 were in food and household products industry, 172 were in computer products industry and 96 in retail banking.
United States
Baker &
Leidecker (2001)
Agribusiness sector (Tomato processors in California)
25 All the companies in the state of California was obtained from California Tomato Growers Association, Inc and California League of Food Processors
United States
Gibson &
Cassar (2002) Small firms 3554 (Firms with less than 200 full- time equivalent employees in 1995 were treated as small firms)
Data collected in the first three years (1994-95, 1995-96 and 1996- 97) of the Business Growth and Performance Survey developed by the Australian Bureau of Statistics (ABS) was used for this study.
Firms from the full database meeting the following criteria were
Australia
26 included in this study’s analysis: (i)
be active for all three years (ii) be a privately held company and (iii) have fewer than 200 full-time equivalent employees in 1995.
Baker (2003) Food processing
firms 943 The industries were chosen from
among those with at least 200 companies listed in the industry category as reported by the Thomas Food Industry Register. Five industries namely baked goods;
confectionery; dairy (fresh milk);
jams, jellies and spreads; and canned and frozen vegetables were selected to reflect the diversity of the food processing sector. A random sample of 200 firms was chosen from the total in each industry. After deleting the firms with incorrect addresses and those no longer in businesses, the final sample consisted of 943 firms.
United States
Tegarden, Sarason &
Banbury (2003)
Firms in a range of technology intensive, dynamic industries.
2000 The sample was drawn from the
directory of U.S. firms published by the Corporate Technology
Information Services (CorpTech).
United States
French, Kelly
& Harrison (2004)
Small professional
service firms 936 (The definition of small professional service firms was not provided)
Random sample selected from a commercial database consisting of 1700 firms.
Australia
Shrader, Chacko, Herrmann &
Mulford (2004)
Manufacturing firms
597 All the manufacturing firms listed in the database of firms associated with a centre for industrial research and service at one of the premier land grant institutions in the USA.
United States
Hoque (2004) Manufacturing
companies 100 (Only those organisations with at least 100 employees were included in the sample)
A random sample was selected from the 1994 edition of New Zealand Business Who’s Who.
New Zealand
O’Regan &
Ghobadian (2004)
Small-and medium-sized manufacturing firms in the electronics and engineering sectors.
1000 (Firms having less than 250 employees were considered as SMEs according to the European Commission’s definition of SMEs)
A random sample was selected from a directory published by a reputable commercial firm.
United Kingdom
27
APPENDIX 2
Author Focus / aim of the study
Methodology for collecting
data
Respondent(s) who and how many
Grinyer &
Norburn (1975)
To determine the characteristics of the strategy planning process in a representative sample of U. K. companies and how these were related to performance.
Data was collected during interviews by using a structured questionnaire.
Multiple interviews were used in each company for the following two reasons: (i) perceptions of a single
interviewee could be biased and (ii) perceptions of a number of executives were necessary for the level of agreement between them to be
established.
Two-thirds of the interviewees were chief executives or executive directors and the rest were senior managers reporting directly to a director. Ninety- one executives were interviewed in the 21 companies.
Karger &
Malik (1975)
To measure the effects of formal integrated long range planning upon commonly accepted financial performance measures for industrial firms
Postal survey Chief Executive Officers (90)
Burt (1978) To test the following hypotheses: (i) there is a positive correlation between good planning and corporate performance (ii) firms with an acceptable quality of planning will out perform those with less acceptable planning.
Personal interviews and postal survey
Senior managers. 14 firms provided data. Data from 11 of them were collected through personal interviews and from the remaining 3 through postal survey.
Kallman &
Shapiro (1978)
The overall aim of the study was to determine what effect planning has on profitability in the motor carrier industry.
The study explored the following four basic research questions: (i) whether there was a relationship between the size of the firm, its commitment to long range planning and its economic performance (ii) whether
geographic area of operation has any bearing on the economic performance of a carrier relative to its commitment to planning (iii) Does the amount of planning depend on the kind of freight handled? Do the different types of carriers plan the same way and do they perform the same economically (iv) the length of time a carrier has actually been using a planning function
Postal survey Corporate Presidents or top level executives. 498 responses were received, 20 were unusable. Complete economic data for the full 10 year period could not be obtained for 93 respondents which resulted in 385 usable questionnaires. Of these, 87 started planning in the years between 1966 and 1975 and the remaining 298 started planning in 1965 or before.
These 298 firms constituted a large homogeneous group and were selected for analysis.
28 Klein (1979) To investigate (i) the relationship between
bank size and long range planning efforts undertaken (ii) the relationship between bank size and trends for growth and profit (iii) whether there is a correlation between the extent of long range planning and growth trends, profit trends and bank size and trends for growth and profit and (iv) the extent to which long range planning is used as a management tool in commercial banks today
Postal Survey Senior officials and executives (77)
Wood Jr. &
LaForge (1979)
To test the hypothesis which states that large U.S. banks that had more comprehensive planning would financially outperform those that had less comprehensive planning.
Postal survey
and interviews Officers from 29 banks responded to the questionnaire and in depth interviews were conducted with executives or planning specialists of 17 out of those 29 banks.
Kudla (1980) To examine whether (i) shareholders of firms engaged in strategic planning earned abnormal returns or not and (ii) strategic planning has enabled the firms to reduce overall riskiness or not.
Postal survey Not specified (348
questionnaires were returned, out of which 328 were usable.
The final sample used for risk analysis consisted of 78 planners and 78 non-planners) Grinyer,
Yasai- Ardekani &
Al-Bazzaz (1980)
To test a number of hypotheses to ascertain the nature of relationship between (i) divisionalisation of organisational structure and the traditional measures of height and width of the hierarchy (ii) strategy and structure (iii) size and strategy and size and structure (iv) number of sites and structure and geographical dispersion and structure and (v) Strategy, structure and financial performance. Another two set of hypotheses were also formulated to test whether (i) a good fit of structure to strategy promotes better coping with the environment and (ii) good fit between structure and strategy might be expected to lead to good performance and vice versa.
Data was collected during interviews by using a structured questionnaire.
Senior managers (48)
Leontiades
& Tezel (1980)
To test the association between the perceived importance of planning and actual
performance.
Postal survey CEOs and Chief Planning Officers (CPOs) (91 questionnaires were returned and out of these, 61 contained responses from CEOs and CPOs)
Lenz (1980) To examine whether performance varies in accordance with a firm’s overall combination of environment, strategy and organisation structure.
Field and telephone interviews and secondary data
Senior executives (80)
Beard &
Dess (1981)
The aim of this study was to provide a balanced test of power of variation in firm corporate-level strategy and in firm business- level strategy in explaining variation in firm profitability. In order to accomplish this aim the following hypothesis specified in terms of an additive linear regression model was tested:
Yi = b0 + b1X1i – b2X2i – b3X3i + b4X4i + U Where
Yi = the before tax return on total
Secondary data was used for the analysis. Firm- level data were obtained from Standard and Poors (1979) and industry- level data were obtained from US Internal
Data concerning 40 firms were collected
29 investment or on equity of the
ith firm
X1i = the before tax return on total investment or on equity of the industry in which the ith firm competes
X2i = the debt to equity ratio computed as the ith firm’s ratio relative to the average ratio of the industry in which the ith firm competes X3i = the assets to sales ratio computed as the ith firm’s ratio relative to the average ratio of the industry in which the ith firm competes X4i = the sales to size of the ith firm relative to the average firm’s sales size in the industry in which the ith firm competes U = an error term accounting for unspecified variables
i = 1 through n and
n = the number of firms in the sample or population
Revenue Service (1974 through 1979)
Klein (1981) To examine the following relationships: (i) bank size and extent of long-range planning efforts undertaken (ii) bank size and trends of growth and profit (iii) extent of long range planning and trends for growth and profit and (iv) extent of long-range planning, bank size and trends for growth and profit.
Postal survey Senior officials and executives (76)
Kudla (1981) To examine the relationship between strategic planning and risk of common stocks.
Postal survey Not specified (348
questionnaires were returned, out of which 328 were usable.
The final sample used for risk analysis consisted of 78 planners and 78 non-planners) Robinson
and Littlejohn (1981)
The following research questions were explored in this study: (i) What is planning in a small firm? (ii) Is planning of value in a small firm? And (iii) What are the critical dimensions of planning that are unique to the small firm?
Not specified Not specified (Data was collected from 67 firms)
Sapp &
Seiler (1981) To examine the relationship between long- range planning and financial performance of U.S. Commercial Banks.
Postal survey Not specified
Unni (1981) To test the following hypotheses: (i) Among small business owners, the proportion who makes use of overall planning in their businesses is the same for both minority and non-minority (ii) All observed
characteristics, such as the type of ownership, number of employees, average working hours per week, age of the firm, owner’s experience, owner’s age and educational background, were related to their planning efforts and (iii) Since sales and profit growth could be considered as indicators of business success, those small business owners with satisfactory profit (profit growth) were also satisfied with sales (sales growth)
Postal survey Not specified (Only 62 minority and 58 non-minority small businesses responses were useable)
30 Kudla &
Cesta (1982) To examine whether planning of a firm
affects its performance. Postal survey Not specified (348
questionnaires were returned, out of which 328 were usable.
The final sample used for discriminant analysis consisted of 27 planners and 27 non- planners)
Jones (1982) This study was intended to identify important characteristics which differentiate planners from non-planners and to determine the usefulness of planning in the small firm.
Postal survey Top planners (69
questionnaires were returned)
Robinson, Jr.
(1982) To examine whether there is a relationship between outsider-based strategic planning (OBSP) and firm profitability or not.
Not specified Not specified
Robinson Jr.
and Pearce II (1983)
To examine the relationship between formality of planning procedures and financial performance.
Postal survey Presidents (50)
Fredrickson (1984)
To test whether there is a positive
relationship between comprehensiveness of strategic decisions and performance in an industry operating in a stable environment.
Interviews Executives including Chief Executive Officers (152)
Fredrickson
& Mitchell (1984)
To test the relationship between the comprehensiveness of strategic decision processes and performance in an industry whose environment is unstable.
Interviews Executives including Chief Executive Officers (109)
Robinson Jr., Pearce II, Vozikis &
Mescon (1984)
To determine whether the planning- performance relationship is a small-firm setting is contingent on the stage of development of the firm or not.
Postal survey Not specified (Data from 51 firms were used for analysis)
Welch
(1984) To determine (i) if the company conducts strategic planning (ii) when strategic planning was formally initiated and (iii) at what level in the organisation strategic plans are developed, corporate and or division
Postal survey Chief Executive Officers (123)
Woodburn (1984)
To explore the types of strategies, formulation methods and the influences of environmental and organisational
characteristics on the planning process in organisations based in South Africa.
Postal survey Not specified (Data from 518 firms were collected)
Ackelsberg and Arlow (1985)
To test the following hypotheses: (i) There is a positive and significant relationship between planning and economic performance (ii) The relationship between planning and economic performance will be significantly different among types of businesses
Postal Survey Not specified. Only referred to as potential respondents (135 usable questionnaires were returned)
Orpen (1985)
To compare the performance of small businesses which engage in long-range planning with that of firms which do not.
Data was collected in two stages. (i) managers of the firms kept diaries over a six-week period and it was later
Senior managers, mostly owner-managers (58)