XRD, FTIR and NZS analysis revealed that the crystallite size/particle size of the 50 h milled samples was in the nanometer range. The wear resistance of the microwave sintered specimens was found to increase with the addition of Cr particles and SiC nanosize. Electrical conductivity of microwave sintered samples showed 60-70% IACS conductivity compared to 40-50% for conventional and vacuum sintered compacts.
Introduction
- Aim and Objective
Age hardening treatment can be used to achieve the desired combination of strength and conductivity of Cu-Cr alloys (Ellis et al., 1995). This fine-scale distribution of Cr was reported to increase the sintering rate of the powder compacts while enhancing the mechanical and electrical properties (Lahiri et al., 2009a). Characterization of Ball Milled Powder by XRD, SEM, FTIR and Nano Zeta Sizer Analysis.
- Preamble
- Synthesis techniques of nanostructured materials
- Importance of Mechanical milling
- Developments in Mechanical alloying (MA)
- Process Variables
- Development of nanostructures by MM
- Advances in preparation of Cu-Cr based alloys and/or mixtures
- Hardness and Wear Resistance
- Electrical Conductivity
- Consolidation and sintering
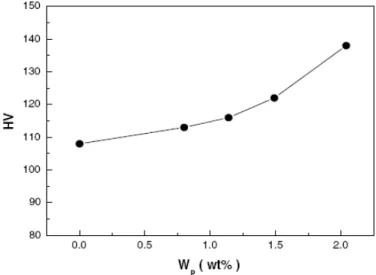
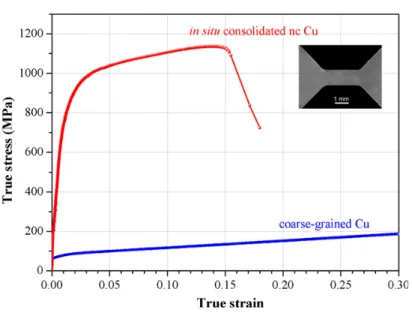
In general, nanocrystalline materials contain drawbacks, such as porosity and poor inter-particle bonding (Koch et al., 2003). Peng et al., 2005) prepared in situ Cu-Cr alloy, which can be used for contact cables at elevated temperature. Fig.2.2: Average microhardness of in situ and ex situ sintered composites with different grinding times (Ref. Zuhailawati et al., 2009).
Hashemi et al., 2008) investigated the wear resistance of Cu–18 vol.% Nb processed via the powder metallurgical route. Guler et al., 2009) investigated the contact performance of oxide reinforced copper composite via mechanical alloying.
- Development of Cu-based nanocomposites
- Mechanical milling
- Consolidation of milled powder
- Microstructural characterization
- X-ray Diffraction (XRD)
- Scanning Electron Microscopy (SEM)
- Atomic Force Microscopy (AFM)
- Nano zeta sizer
- Fourier Transform Infrared Radiation (FTIR) spectroscopy
- Evaluation of Mechanical Properties
- Vickers Hardness Measurement
- Evaluation of Electrical Conductivity
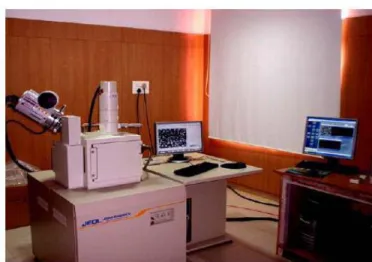
A JEOL JSM-6480 LV scanning electron microscope (Figure 3.3) was used for morphology, particle size, and microstructural characterization of various hours of ground powder and sintered samples. A VEECO di Innova atomic force microscope was used to study the AFM micrograph of some sintered samples. In this investigation, this instrument is mainly used to determine the average particle size of conventional sintered samples.
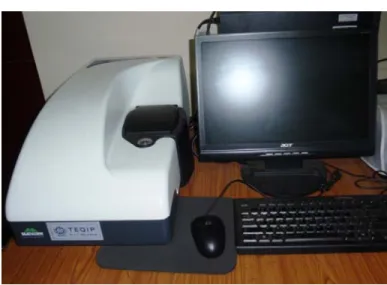
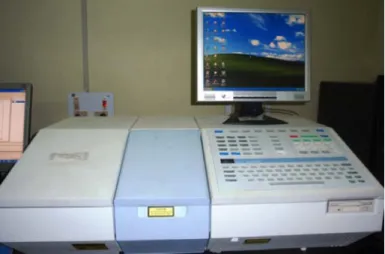
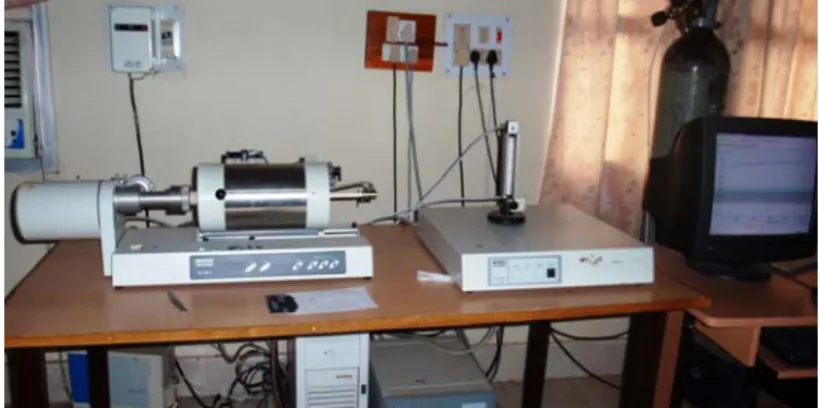
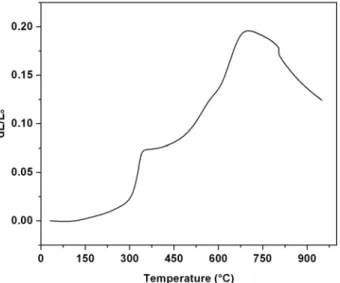
The particle size of the ground powder was measured on Nano zeta size (Nano ZS, Malvern). Percent infrared transmission was measured with a Fourier transform infrared (FTIR) spectrometer (Perkin-Elmer Spectrum RXI). The NETZSCH DIL 402C dilatometer was used to investigate the sintering characteristics and diffusion behavior of the 50 h milled samples.
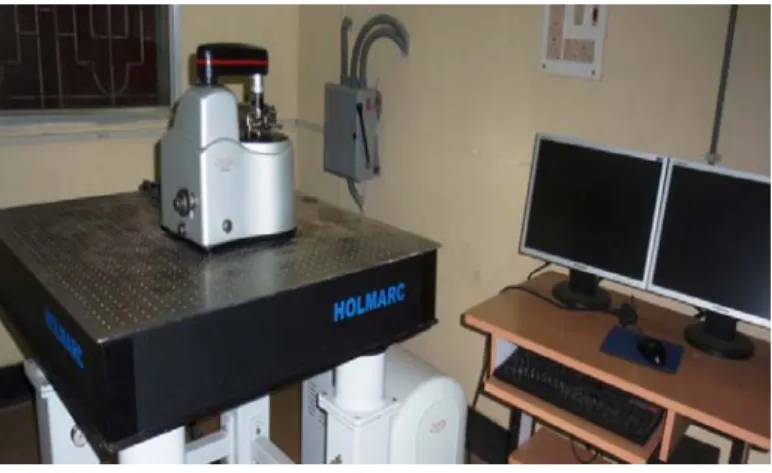
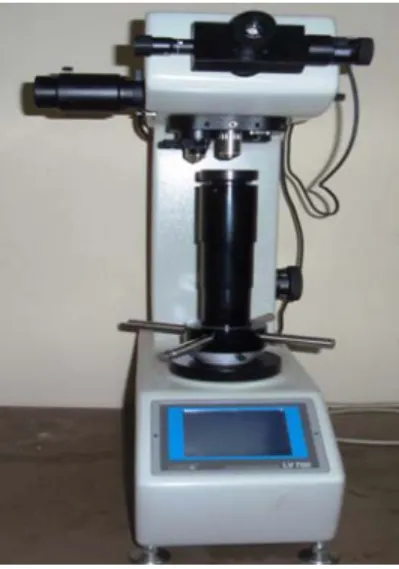
The expansion or contraction behavior of the solid specimen was studied by heating it up to 950ºC at a heating rate of 5ºC/min under inert argon atmosphere (impurity <10 ppm). Vickers hardness tester (Leco LV 700) was used to determine the Vickers hardness values of all sintered specimens using 1 kg load for a dwell time of 40 s. In the present study, the TR-208 M1 ball-on-plate wear instrument was used to determine the wear behavior of microwave sintered samples.
The electrical conductivity of all sintered samples was investigated using the 4-probe method in the SIGMATEST D 2.068, FOERSTER instrument.
Structural Characterization of Milled Samples
- SEM analysis
- XRD analysis
- FTIR analysis
- Particle size analysis
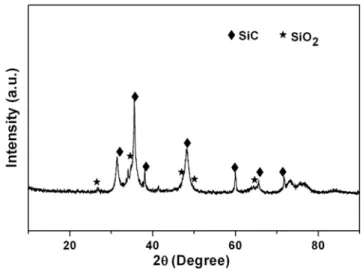
Analysis of the XRD data revealed that the average crystallite size of the milled powder was ∼30 nm. Analysis of Cu99Cr1–4 wt% SiC composition, showed the presence of SiC, CrSi2 and Cr23C6 phases after 2 hours of milling (Fig. The XRD data were analyzed for crystallite size refinement, lattice microstrain(%) and lattice parameter variation of Cu based solid solution of all the compositions.
The crystallite size gradually decreases as grinding progresses, which was clearly visible in Figure. Up to 20 hours of milling, a rapid decrease in crystallite size can be noticed from the figure. The crystallite size refinement is much more prominent in the case of SiC composition compared to that of Cu99Cr1 and Cu94Cr6 compositions at the same grinding time.
Due to the presence of harder and brittle SiC particles in Cu99Cr1–4 wt.% SiC and Cu94Cr6–4 wt.% SiC, the crystallite size was found to be much finer (as shown in Fig. 4.4), which increases the lattice microstrain ( %) to a higher value than that of Cu99Cr1 and Cu94Cr6. This is due to the increase in total surface area due to the reduction in particle size as grinding progresses. The calculated crystallite size from the XRD patterns of the milled samples at different durations is plotted against the transmittance (%) obtained from the FTIR analysis of the same sample and is shown in Fig: 4.7(b).
It is clear from the figure that the percentage of transmittance decreases with decrease in crystallite size.
Consolidation and sintering
- Dilatation and diffusion
- Microstructural investigation of the sintered specimens
Conventional and vacuum sintering of Cu99Cr1 resulted in a 5-11% increase in the sintered density, whereas for microwave sintering it was 17-19% compared to the green density of the samples. In the case of Cu99Cr1–4 wt% SiC and Cu94Cr6–4 wt% SiC compositions, the increase in the sintered density was measured to be 20–24% compared to the green density of the compact materials, whereas it was 17–19% in case of Cu-Cr alloys only at the same sintering temperatures using the same technique. From phase analysis of all the sintered samples, it was found that Cu, Cr peaks are much more prominent compared to the corresponding 50 h milled samples.
Some less intense oxide peaks corresponding to CuO2, CuO, Si2O, Cu (CrO2) and Cr2O3 were also visible in the XRD patterns of the sintered specimens. 4.13(a-b)) than that of conventional sintered and vacuum sintered samples at the same sintering temperature. The crystallite size of the Cu/Cu-based alloys of the sintered specimens was analyzed from XRD data and is presented in Table 4.2.
The crystallite size of the conventionally and vacuum sintered samples was measured to be in the range of 101–117 nm at 900 °C, while it was in the range of 107–123 nm when the sintering temperature was increased to 1000 °C. It can be noted that the crystallite size of the sintered samples containing SiC was finer than that of the Cu-Cr compositions at the same sintering temperature. XRD patterns of the microwave sintered samples sintered at 800 °C and 900 °C than that of a 50 h milled sample, while the sintered density was found to be maximum compared to that of the other sintering techniques.
The crystallite size of microwave sintered specimens was also found to be much smaller (65–79 nm at 800°C, 68–81 nm at 900°C) than that of other sintering methods.
Mechanical Properties of Sintered specimens
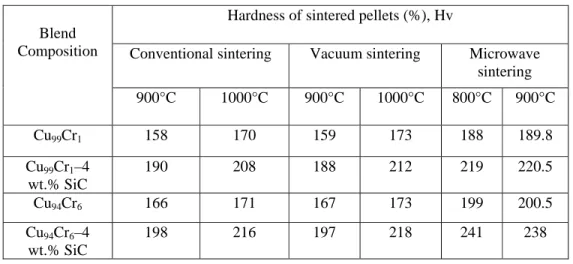
The particle size can be measured from the AFM micrograph of the sintered samples and the VEECO di Innova atomic force microscope was used to study the average particle size for some sintered samples. Vickers hardness of specimens sintered at 1000°C by conventional and vacuum sintering methods was in the range of 170-218 Hv. This is probably due to the fact that a temperature of 800°C is sufficient for microwave melting of the present compositions.
Since the microwave sintered samples contain much less and small voids and also less grain growth occurred than the conventional or vacuum sintered samples, the hardness values were measured to be higher than those of the other samples. The hardness values of conventional and vacuum sintered samples increased with increasing sintering temperature from 900°C to 1000°C, probably due to the increase in sintered density as shown in Table 4.1. Therefore, it can be concluded that the increase in hardness is a function of the presence of Cr, the hard SiC nanoparticles and the sintered density of the specimens.
It should also be noted that the increase in the sintered density of the SiC-containing compositions was much higher when sintering is carried out by microwave sintering. However, in this case the wear depth for all compositions is relatively slightly higher than for the 800°C sintered samples. To confirm the wear behavior of the microwave sintered samples, SEM micrographs of the wear track surface were recorded.
This basically means that the wear resistance is much higher than other patterns.
Electrical conductivity
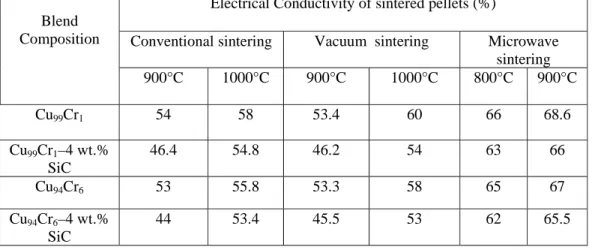
It can be noted from Table 4.4 that the electrical conductivity gradually increases from the range of 44-54% to 66-68.6% when the sintering method was changed from conventional to microwave sintering techniques. When the sintering temperature was increased, e.g. 800°C to 900°C in the case of microwave sintering, the electrical conductivity was also found to be higher than that of the samples (62-66%) sintered at a lower temperature. This is due to grain recovery and relaxation and grain growth, which reduces the grain boundary area (Raghavan, 1992).
But with increasing Cr content from 1 to 6 at.%, it slightly decreased the conductivity and further decreased with the addition of 4 wt.% nanosized SiC particles with the same composition, although the relative density remains almost in the similar level ( Table) 4.1). This is expected since the electrical conductivity of Cr and SiC is much lower than that of Cu. Thus, the reduction of electrical conductivity in the case of Cu99Cr1–4 wt% SiC is higher than that of Cu94Cr6–4 wt% SiC compactions for a specific sintering temperature in a specific sintering method.
In the present investigation, the highest conductivity level obtained was in the range of 65–69%, which is much lower when compared to IACS. This can be further increased by improving the sintered density of the materials using proper. However, the material developed in this investigation showed hardness values in the range of (200-240) Hv and electrical conductivity of (65-70)% with a densification level of 90-95%.
Therefore, this material could be successfully used in the field of electrical technology, where the devices require both high electrical conductivity and high strength, such as electrodes for electric spot welding, relay blades and contact supports, sliding electrical contacts, and so on (Lopez et al. ., 2007).
Conclusions
Microwave-sintered compacts showed much better mechanical properties compared to compacts sintered in vacuum and without pressure, probably due to the presence of much finer microstructural features and better densification. i) Electrical conductivity of microwave sintered samples showed 60-70% .. of IACS conductivity compared to 40-50% for conventional and vacuum sintered compacts. j) Therefore, microwave sintering is found to be the most effective in consolidating Cu-Cr or Cu-Cr–SiC nanocomposite powders compared to the other methods used in this investigation, as an appropriate combination of mechanical and electrical properties was achieved with this technique. Therefore, the material developed in this investigation could be successfully used for thermoelectric applications.
Future Scope of Study