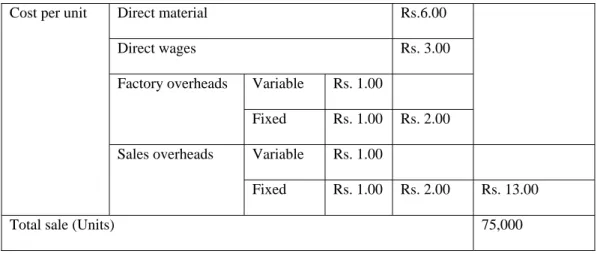
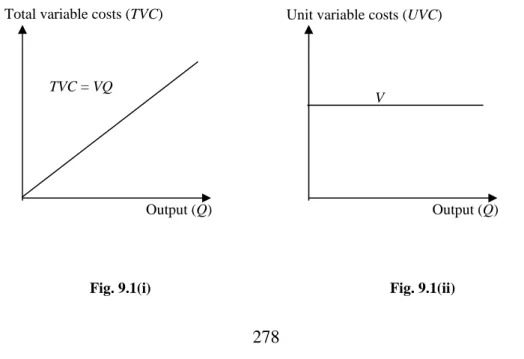
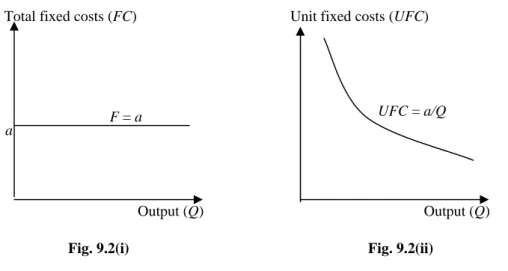
One of the most important areas where decision making is used is financial decision making. Volume-cost-profit (VCP) analysis refers to the study of the relationships between the components of profit planning. Fixed Costs (FC) FCs are those costs that remain constant regardless of changes in the volume of production.
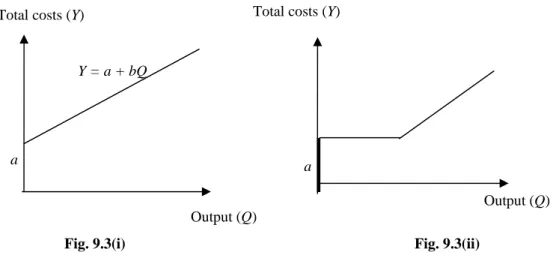
Another variant of semi-variable costs are semi-fixed costs where costs at certain production points increase by certain fixed amounts. -even analysis and financial decision making Break-even analysis is a very common technique for making effective financial decisions, especially when we can obtain explicit relationships between the three components of profit planning. -smooth analysis can be performed using any of the following techniques: i) Graphical methods; and (ii) Algebraic methods.
Fixed cost line is independent of production volume The total sales line starts from the origin and goes to the point of maximum production. Then the break-even point (BEP) lies at the intersection of the total cost line and the total sales line. It is possible to read the details of the individual variable cost segments from a VCP graph.
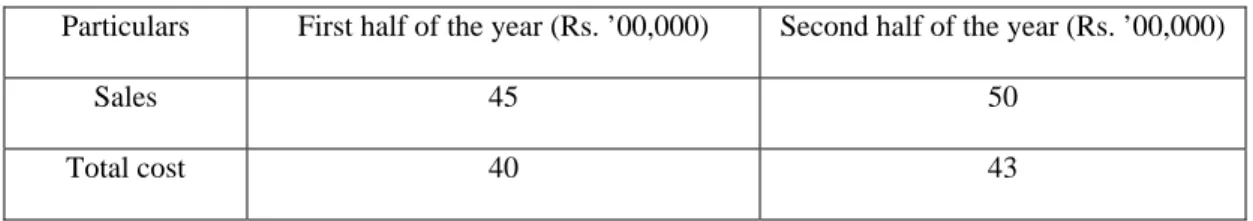
Since fixed costs are equally distributed over both halves, so the difference in cost (Rs. is on account of variable costs.
Applications of break-even analysis in decision making
As we have seen, the VCP analysis can be used to predict the consequences of certain decisions or events regarding costs, revenues and profits. In fact, the variable revenue is a random variable and can be characterized by a probability distribution. Now assume that the sales distribution S (the number of units sold) can be described by a normal distribution with mean µ and s.d.
Since the total contribution is a linear function of the random variable S (30 S), contribution is also a normal variable with mean = 30 µ and s.d.
99.7% area
Marginal analysis
Marginal costing This is another technique for making decisions based on costs associated with a production process. The marginal cost can be defined as the amount of any given volume of output by which the total cost changes if the volume of output changes by one unit. Variable costs include direct materials, direct labor, variable direct expenses, other variable overheads, and the variable portion of the semi-variable costs.
Marginal analysis and decision-making
Total Profit = Total Contribution – Fixed Cost = Rs. production must continue and the product must be sold at a price equal to the marginal price of the product. There are no signs of improvement in the situation and losses are increasing. At this point a decision can be made on the minimum price at which production may continue.
The minimum price at which production can be continued is equal to that at which production costs can be recovered, i.e. the marginal costs. Thus, production should be continued until prices fall to Rs. NOK 28 per unit, after which production should be stopped. Since the stated price is less than the total price of the product, the management is in a solution.
If the management accepts the additional order, it would make an additional contribution of Rs. 10,000, which would increase the firm's profit by the same amount as the fixed costs have already been borne by the domestic market. Under these restrictions, the company has received an order for a further 25% of the plant's capacity. If the product is available abroad at less than Rs. 9.50, must be purchased from abroad; if the product is available at more than Rs. 9.50, should be produced and if the product is available at Rs. 9.50, the company is free to buy or produce. e) The key or limiting factor problem Theoretically, the production of a (more profitable) product can be increased to any extent and there is no limit in this direction, at least as far as the production capacity of the plants allows.
Examples of these key factors could be material availability, skilled labor, capital and market capacity, etc. Example 6: The following data relate to the production of a face cream and a moisturizing lotion, which compete with each other in the market. As the unit contribution of face cream is greater than that of moisturizing lotion, therefore the company should produce face cream.
Since plan (c) gives the maximum profit, it should be carried out, although in this case the contribution of product Y is negative, but it is supported by the huge margin of product X. f) Evaluation of alternative production methods Sometimes alternative production methods can be used to produce the same product. For the following data, Find BEP units and BEP (Rs.) SP = Rs. a) What should the fixed costs be if the breakeven point is to be 2.8 million units. How many units should the company produce if it is to realize a profit of Rs. c) What must SP per unit be if the company is to realize the same profit as in (b) if the company produces at its full capacity.
In problem 2, find the sale for parts (a) and (b) if the firm wants to make a profit of Rs. If the firm is earning a profit of Rs. 30,000, find the margin of safety available to the firm.