I have submitted this dissertation to the Department of Chemistry, Indian Institute of Technology, Guwahati, for the award of the degree of Doctor of Philosophy. Not for obtaining the degree of Doctor of Philosophy in Chemistry, is the authentic record of his research work.
Acknowledgment
Recognition and Ratiometric Visual Sensing of Long-Chain
Introduction
Quantum Dots
- A Brief Idea
- Discovery
- Types
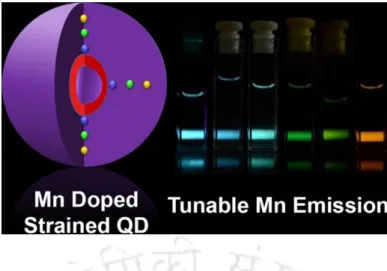
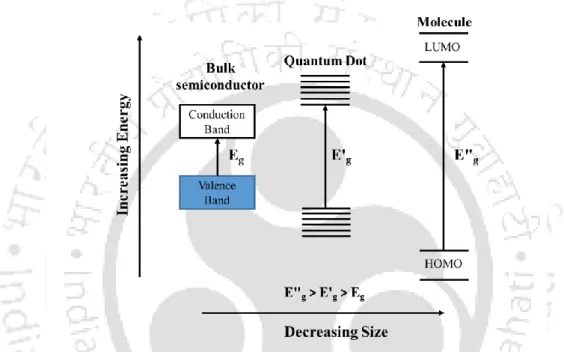
- Optoelectronic properties and their tuning parameters
- The Origin: Quantum Confinement Effect
- Size
- Doping
- Surface
- Surface Modification
- Formation of shell on the surface
- Ligand Exchange
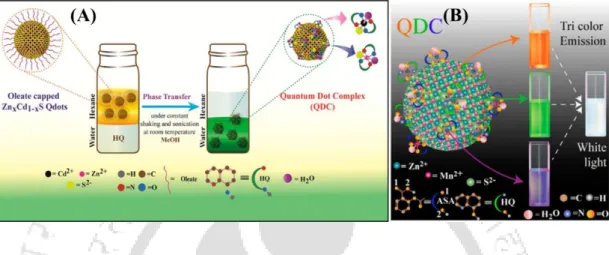
- Complexed Quantum Dots: Complexation Reaction on the Surface
A well-known strategy for the modification of the surface of Qdot is to generate a coating of inorganic shell over the surface. (B) Generation of white light using double complexation strategy on the surface of Mn2+-doped ZnS Qdot.
Sensing Applications
- Ion Sensing
- Cation Sensing
- Anion Sensing
- pH sensing
- Fatty acid sensing
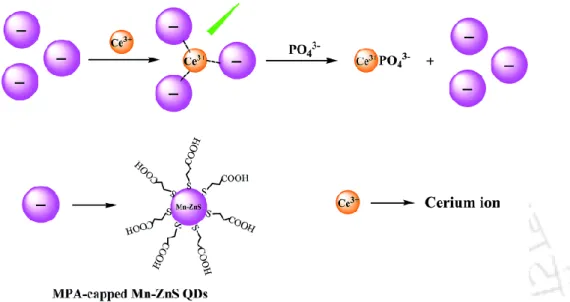
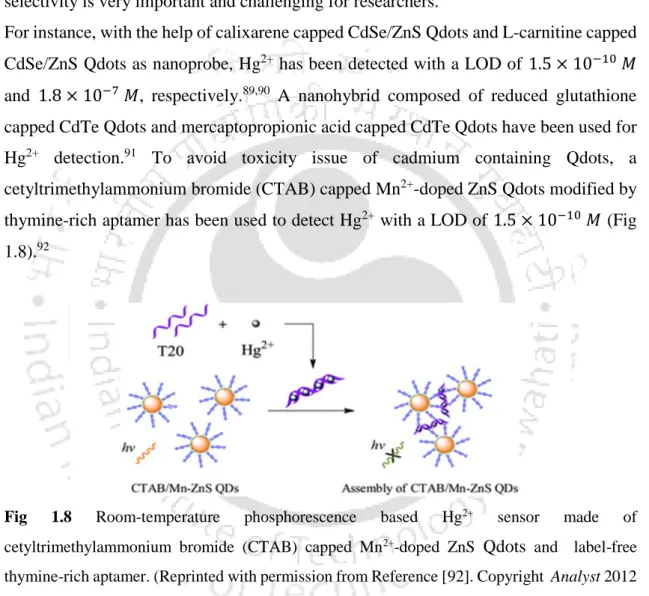
Here a surfactant [C12H25N+(CH3)2(CH2)4(CH3)2−N+C12H25]-2Br¯ and cetyltrimethylammonium bromide (CTAB) were used for surface modification of CdSe/ZnS Qdots. 97 MPA Mn-doped Qdots Qdots alone demonstrated its ability to detect sulfide ions (S2−) up to 𝑀.98 Phosphate is one of the most important physiological minerals that control the process in the human body. Here the affinity of the phosphate to the lanthanides assumes a vital role in the detection mechanism (Fig. 1.9).108.
Ratiometric Sensing
A ratiometric sensor was developed to detect dopamine, a redox-active neurotransmitter, using white light-emitting surface-modified ZnO Qdots. This white light emitting nanoprobe successfully detected dopamine with an LOD of by changing its color to blue (Fig 1.13).143.
Thesis Overview
The surface of the yellow-emitting ZnO Qdot is functionalized with a blue-emitting Zn(MSA)2 complex, where MSA stands for N-methyl salicylaldimine.
- Bibliography
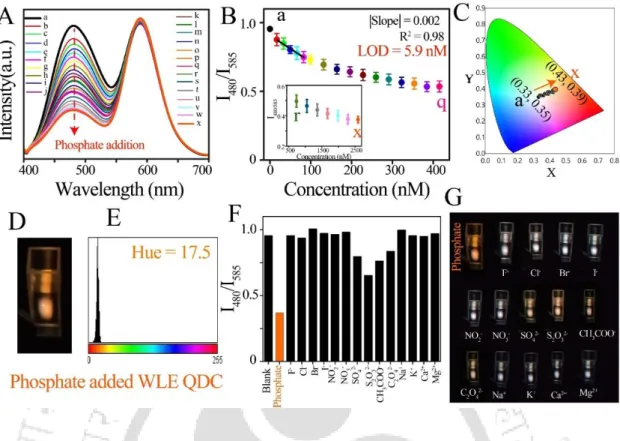
In chapter 3, a ratiometric phosphate sensor was developed using a white light emitting (WLE) QDC composed of greenish blue emitting Zn(QS)2 (QS = 8-hydroxyquinoline-5-sulfonate) complex (λem = 480 nm) at the surface of orange emitting Mn2+-doped ZnS Qdots (λem = 585 nm). A WLE QDC was fabricated by forming a green-emitting ZnQ2 complex (Q = 8-hydroxyquinoline, λem = 512 nm) on the surface of orange-emitting Mn2+-doped ZnS Qdots (λem = 590 nm), which acted as a ratiometric sensor to detect LCUFAs.
- Abstract
- Introduction
- Experimental Section
- Materials: Manganese acetate tetrahydrate (Merck), zinc acetate dihydrate (Merck), sodium sulphide (Merck), 1 M methylamine in methanol (Sigma-Aldrich),
- Synthesis of Dual-Emitting QDC: The dual-emitting QDC was synthesized by addition of 150.0 µL of 5.0 mM of MSA (methanol) to the 10.0 mL methanolic dispersion
- Heavy Metal Ion Sensing: The heavy metal ion sensing of QDC was performed following individual sequential addition of the solutions of 1.0 mM Hg 2+ and Cu 2+ ions
- Instruments: Transmission electron microscopy (TEM; JEOL JEM 2100F, maximum accelerating voltage: 200 kV) was used to analyze the size and lattice fringe
- Results and Discussion
- Conclusion
- Bibliography
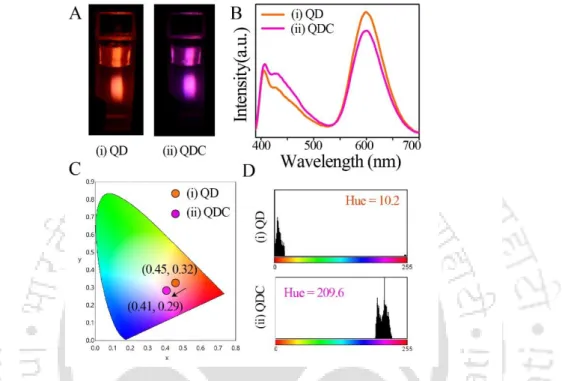
2.1 (A) Digital photographs (captured using 355 nm light from a spectrofluorimeter), (B) emission spectra (λex = 355 nm), (C) corresponding chromaticity color coordinates on the CIE diagram, and (D) histograms of shades of (i) Mn2+ doped ZnS Qdots and (ii) dual-emitting QDCs. 2.2 (A) Digital photographs (captured using 355 nm light from a spectrofluorimeter) of the dual-emission QDC after addition of (i) Hg 2+ and (ii) Cu 2+ ions. E) Color histograms of dual-emission QDCs after addition of (i) Hg 2+ and (ii) Cu 2+ ions (obtained by analyzing digital photographs as described in (A) using Image-J software).
A Ratiometric and Visual Sensing of Phosphate by White Light Emitting Quantum Dot Complex
- Abstract
- Introduction
- Experimental Section
- Synthesis of WLE QDC: The WLE QDC was prepared by addition of 15.0 μL of 5.0 mM of HQS (methanol-water) to the 3.0 mL water dispersion of Qdots (with
- Results and Discussion
- Conclusion
- Bibliography
The pH of WLE QDC medium after adding phosphate (NaH2PO4) did not change significantly, and therefore the effect of pH on the changes in photoluminescence intensity ratio (I480/I585) of WLE QDC after adding phosphate (NaH2PO4) was ruled out . Thus, the phosphate (Na3PO4) has an additional effect on the changes in the photoluminescence intensity ratio (I480/I585) of the WLE QDC compared to the pH effect of the medium. Thus, the specific interaction between phosphate and Zn(QS)2 complex (present in WLE QDC) may be the reason for changing the photoluminescence intensity ratio (I480/I585) of WLE QDC.
Recognition and Ratiometric Visual Sensing of Long-Chain Unsaturated Fatty Acids by a White-Light-Emitting
Quantum-Dot Complex
Introduction
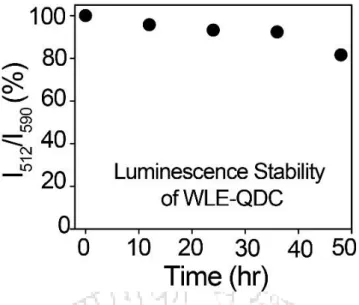
Herein, we report the twin applications of a bright and photostable WLE-QDC, composed of Mn2+-doped ZnS Qdots and a ZnQ2 inorganic complex, for the selective recognition of LCUFAs from their corresponding saturated forms and the turn-on ratiometric visual detection of LCUFAs in commercial vegetable oils. Finally, the practical use of the WLE-QDC was investigated by quantifying LCUFAs in commercial vegetable oils (such as sunflower, edible and soybean oils). 20 The obtained results represent the first report showing the advantages of WLE-QDCs for the selective recognition of LCUFAs from their corresponding saturated forms and the turn-on ratiometric visual detection of LCUFAs in vegetable oils by monitoring the changes in their luminescence properties.
Experimental Section
- Fabrication of white light emitting quantum dot complex (WLE-QDC)
- Sensing of LCUFAs: The sensing of LCUFA was performed by adding 2.5 mM aqueous solution of sodium oleate sequentially to 3.0 mL of aqueous dispersion of WLE
- Recognition of long chain unsaturated fatty acid (LCUFA) from their saturated form: The different responses of WLE-QDC towards LCUFA (e.g., oleic
- Selectivity of Sensing by WLE-QDC towards LCUFAs: Selectivity of sensing by WLE-QDC towards LCUFAs was examined by adding sodium salt of different
- Commercial Vegetable Oil Analysis. For real sample analysis commercial sunflower, edible and soybean oils were purchased from local market and
Similarly, the observation of other LCUFAs (such as linoleate and erucate) by WLE-QDC was also performed. The mentioned interfering substances were separately added to 3.0 ml aqueous dispersion of WLE QDC (with absorbance of 0.06 at 357 nm) so that their concentration became 80.6 µM (the same as the highest concentration used in observation experiment as in Fig. 4.2 of the Chapter 4). LCUFAs in those solutions were determined according to the above observation procedure by adding 20.0 µL of each solution to 3.0 mL of WLE QDC (with absorbance of 0.06 at 357 nm) separately and monitoring the photoluminescence properties.
Result and Discussion
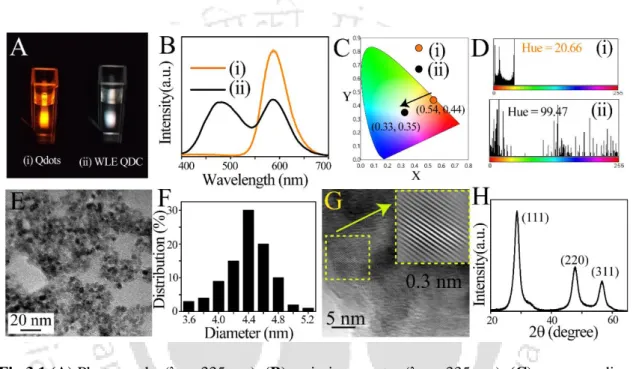
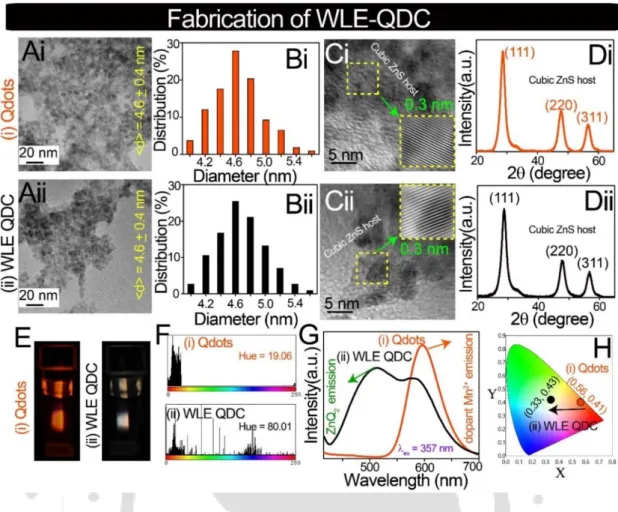
4.1 (A) Transmission electron microscopy (TEM) images (scale bar = 20 nm), (B) corresponding particle size distributions, (C) high-resolution TEM images (scale bar = 5 nm) and corresponding inverse fast Fourier transform (IFFT) analyzes (inset), (D) X-ray powder diffraction patterns, (E) photographs (λex = 357 nm), (F) hue histograms (obtained by analyzing digital photographs with Image-J software), (G) emission spectra (λex = 357 nm) and (H) the corresponding color chromaticity coordinates in the CIE diagram of (i) Qdots and (ii) WLE-QDC. The selectivity of WLE-QDC towards Na-salts of LCUFA (such as oleate, linoleate, erucate and their equivalent mixtures) was tested in the presence of interfering Na-salts of FA (such as stearate, palmitate, laurate and geranate), anions (which essentially used as interfering anions during random FA tests; such as citrate, tartrate, oxalate and fluoride)28 and metal ions (which are commonly present in water; such as Ca2+, Mg2+, Na+ and K+). This clearly demonstrated the high selectivity of WLE-QDC towards Na-salts of LCUFA (such as oleate, linoleate and erucate).
Conclusion
Bibliography
Summary
This present ratiometric sensor selectively responded to LCUFAs among some common unsaturated fatty acids, saturated fatty acids, amino acids and cations with a LOD of and 0.103 μM for sodium salt of oleic acid, linoleic acid and erucic acid, respectively. Furthermore, the present ratiometric sensor accurately measured the concentration of spiked LCUFAs in saponified daily used plant oils such as sunflower, edible and soybean oils. Fabrication of various dual emissive/WLE ratiometric sensors using simple complexation reactions on the surface of Qdots helped to accurately detect environmental pollutant ions, major components of commercialized fertilizers and vegetable oils.
Future Prospects
Appendix
Chapter 2
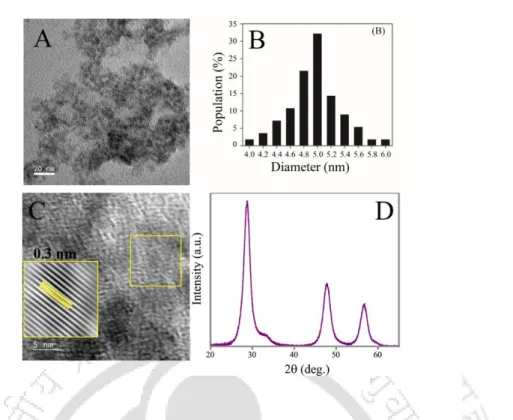
A.2.3 (A) Transmission electron microscopy (TEM) image (scale bar = 20 nm), (B) particle size distribution, (C) high resolution TEM image (scale bar = 5 nm) and corresponding inverse fast Fourier transformed image ( inset), and (D) powder X-ray diffraction pattern (XRD) of the dual-emitting QDC. A.2.6 (A) Emission spectra (λex = 355 nm) of (i) QDC and (ii) Hg2+ ion added dual-emitting QDC before centrifugation, (iii) the pellet obtained after centrifugation and redispersion in the same amount of solvent and (iv ) of the supernatant after centrifugation. B) Emission spectra (λex = 355 nm) of (i) QDC and (ii) Cu2+ ion added dual-emitting QDC before centrifugation, (iii) the pellet obtained after centrifugation and redispersion in the same amount of solvent and (iv) of the supernatant after centrifugation.
Chapter 3
The presence of phosphate in the WLE QDC was verified by observing the characteristic peaks of phosphate in the FTIR spectra of phosphate added WLE QDC (after centrifugation). The new peaks at 888 cm−1 (due to O–P asymmetric stretching /P(OH)2 symmetric stretching (A1), P-OH stretching) and 998 cm−1 (due to O–P–asymmetric stretching and asymmetric with Onb) – in addition to peaks of the functional groups of Zn(QS)2 complex – appeared when phosphate was reacted with WLE QDC. It should be mentioned here that although there are minor changes in the respective lifetimes (1, 2 and 3) of three components (1, 2 and .3) of WLE QDC in presence of phosphate; however, the average lifetime (av) of WLE QDC showed no significant change in the presence of phosphate.

Chapter 4
A linear relationship between I480/I590 WLE-QDC and concentrations of (i) linoleate or (ii) erucate was used to estimate the limit of detection (LOD). A linear relationship between I480/I590 WLE-QDC and concentrations of an equivalent mixture of (i) oleate, (ii) linoleate, and (iii) erucate was obtained and used to quantify LCUFA in commercial vegetable oils such as sunflower, edible, and soybean oils (Table 4.1 in chapter 4). A.4.17 (A, B and C) Representative emission spectra (ex= 357 nm) of WLE-QDC recorded after the addition of various concentrations of saponified commercial sunflower, edible and soybean oils.
List of Publications
Conferences Attended
Permissions
This type of consent/license, rather than the standard Terms and Conditions, will be sent to you as you will not be charged for your order. The license consists of the order details, the CCC terms below and any rights holder terms below. All payments must be made to CCC in full in accordance with CCC's Terms and Conditions below.
LICENSED CONTENT
This is a license agreement between MIHIR MANNA ("User") and Copyright Clearance Center, Inc. 34; CCC") identified on behalf of the Rights Holder in the order details below.
REQUEST DETAILS
NEW WORK DETAILS
REUSE CONTENT DETAILS
Unless otherwise specified in the order confirmation, any grant of rights to the user is (i) "one-time" (including the editions and product family specified in the license), (ii) is non-exclusive and non-transferable, and (iii) is subject to all restrictions and limitations (such as, but not limited to, limitations on duration of use or circulation) included in the order confirmation or invoice and/or in these Terms. The user can change the work only if and as expressly stated in the order confirmation. The license transaction described in the order confirmation document is governed by and.
ADDITIONAL DETAILS
Any failure by User to pay any amount when due, or any use by User of a Work beyond the scope of the license set forth in the Order Confirmation and/or these terms and conditions, will be a material breach of the license established from the Order Confirmation and these terms and conditions. The license created by the exchange of an order confirmation (and/or any invoice) and payment by the User of the full amount set forth in that document includes only those rights expressly set forth in the Order Confirmation and in these terms and conditions, and does not conveys to the User other rights in the Work(s). While the User may exercise the licensed rights immediately upon the issuance of the Order Confirmation, the license is automatically revoked and is void as if it had never been issued, unless full payment for the license is received in a timely manner either by the User directly or .
ELSEVIER LICENSE TERMS AND CONDITIONS
Full details of the license are available at http://creativecommons.org/licenses/by-nc-sa/4.0. Upon completion of the licensed use, the User will either obtain new permission for further use of the Work(s) or immediately cease any new use of the Work(s) and make it inaccessible (such as by deleting or removing or disabling links). disconnect). or other locators) any further copies of the Work (other than copies printed on paper in accordance with this License and still in User's inventory at the end of such period). In addition, the User may not merge a Work with any other material that could damage the reputation of the Rightholder.
JOHN WILEY AND SONS LICENSE TERMS AND CONDITIONS
You will also duplicate the copyright notice that appears in the Wiley publication in your use of the Wiley Materials. You agree that you have no right, title or interest in or to the Wiley Materials or any of the intellectual property rights therein. This Agreement shall be binding upon and inure to the benefit of the parties' successors, legal representatives and authorized assigns.
![Fig 1.3 Wide range of emission color from CdSe/ZnS Qdots of different size. (Reprinted with permission from Reference [28]](https://thumb-ap.123doks.com/thumbv2/azpdfnet/10342795.0/21.892.214.724.110.335/wide-range-emission-qdots-different-reprinted-permission-reference.webp)