Results are averaged over all PTB data records and 40 data records of the CSE Multilead Library database (M01 001-M01 040). However, most existing CS-based WBAN-compatible telemonitoring systems are limited to single-channel ECG signals.
Electrocardiogram and its Clinical Components
ST Segment: The segment between the end of the QRS complex and the beginning of the T wave in the ECG waveform is called the ST segment. QT interval: It represents the duration of the ECG signal between the start of the QRS complex and the end of the T wave.

Multi-channel/Multi-lead ECG
Clinical significance of MECG
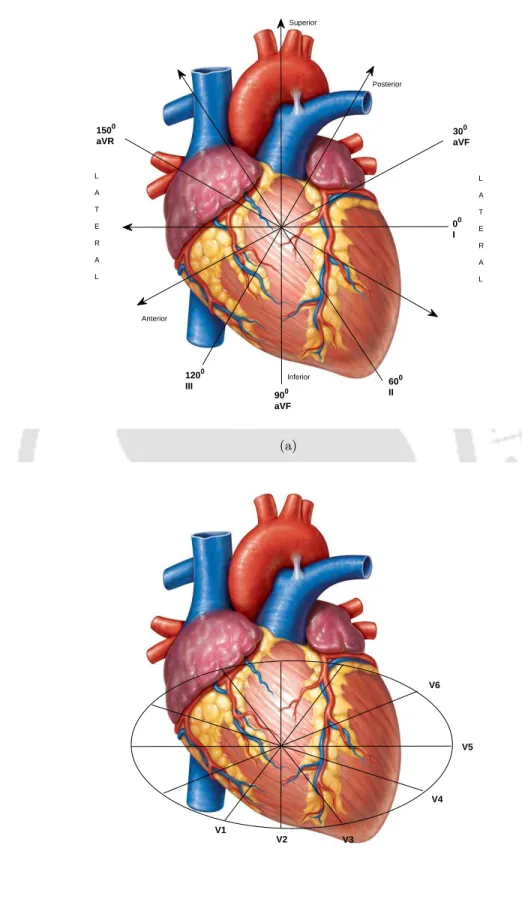
Leads V1 and V2 are called septal leads and depict electrical activity of the heart from septal surface (inter-ventricular septum). It can therefore be concluded that the MECG signals provide spatial-temporal variations of various electrical activities of the heart and help to better understand its functionalities.
Characteristics of ECG signals in different leads
Telemonitoring Systems for Physiological Signals
The received physiological signals are finally sent to the doctor/medical server/healthcare centers via internet/GPRS services. Another communication scenario may be possible, where the personal server running on a Bluetooth or WLAN can communicate with remote terminals through a home computer.

ECG Telemonitoring Systems
Compressed Sensing-based Telemonitoring Systems
Sparsity analysis of ECG signals
The sparsity of ECG signals is an important property which enables the application of CS to these signals. CS exploits this sparsity feature to recover the time-domain ECG signals using only a small set of signal measurements, y.
Distortion Measures
There are few measures of diagnostic distortion reported in the literature, such as weighted diagnostic distortion (WDD) [ 79 ], wavelet-weighted PRD (WWPRD) [ 80 ], and wavelet energy-based diagnostic distortion (WEDD) [ 81 ]. Sometimes, classification accuracies are also used to establish the preservation of clinical information in the reconstructed ECG signals.
Scope for the Present Work
QRS complex is a very important wave in the ECG signals and carries vital clinical information. However, MECG signals have not been much explored in the CS framework and the existing CS-based ECG telemonitoring systems are usually limited to only one channel.
Organization of the Thesis
Wavelet transform as sparsifying basis in CS-based applications
Therefore, DWT allows multi-resolution decomposition of the signal, splitting the signal into finer parts called "details" and a coarser representation. Low-pass filtered version of the signal is filtered again by a low-pass and high-pass filter pair in the next level of wavelet decomposition and continues for further levels.

Sensing matrix selection
Throughout the thesis, we used random sparse binary observation matrix Φ ∈ RM×N with binary entries, i.e. 0's and 1's. Sparse matrices are memory efficient and involve fewer calculations, thus helping to reduce the computational cost at the encoder [46].
Sparse recovery
The problem (2.13) can be seen as a convex relaxation of (2.12) and can be solved using linear programming with less computational complexity. This method gives a robust signal recovery with less error bound, provided the signal is sufficiently sparse in some transform domain Ψ.
CS-based ECG Compression Techniques
Here, the authors highlighted the preservation of fetal ECG signals in the non-sparse maternal ECGs during CS recovery. In these approaches, prior knowledge about support information is incorporated into the existing recovery algorithms to improve their performance.

Joint CS Framework for Multi-channel ECG Signals
One of the major limitations with all the works discussed above is that they all have single-channel ECG processing capability and therefore are not suitable for joint processing of MECG signals. There is one more work reported in the literature which deals with MECG signals using CS frame.

ECG Signal Distortion Measures
The error measures that capture the distortion in diagnostically relevant ECG features are called diagnostic distortion measures. This includes weighted diagnostic distortion (WDD) [79], wavelet-based weighted PRD (WWPRD) [80] and wavelet energy based diagnostic distortion (WEDD) [81].

Databases
Motivation for the Present Work
For this reason, cardiologists are preferred to single-channel ECG for all diagnostic purposes. Different cardiac events captured by multi-channel ECG leads are from different narrow angles in three-dimensional space.

Plan of the Thesis
The dimensionality of the conserved eigenspace MECG signals can be further reduced using CS exploiting their sparseness, either in the eigenspace itself or in another transformation domain. However, the proposed joint PCA-CS approach requires a covariance matrix of the data during reconstruction on the decoder side.

Proposed Joint PCA-CS Approach
- Eigenspace transformation
- Compressed measurements of eigenspace signals
- Quantization and encoding
- Data recovery
Note the small size of covariance matrix (8×8, considering 8 independent MECG channels), it can be sent as a side information with the data with little effect on the resource cost of the system. It should be noted that the covariance matrix/eigenspace transformation matrix P and the mean of the MECG data at the decoder are required for the signal recovery.

Performance Evaluation
Performance measures
Recovery results in different sparsifying basis
Compression performance analysis
The variance of deformation, i.e. APRD, between individual datasets is shown in Figure 3.5 in the form of a box plot at different number of compressed measurements (M). Thus, both PCA and CS operations contribute almost equally to the compression efficiency of the proposed joint PCA-CS approach.

Diagnostic Assessment of ECG Features
Noiseless scenario
This reduces signal sparsity in both the time domain and the transform domain. In all the above CS reconstructions, the sparsity constraint is taken as K target= 208 in the OMP algorithm.

Noisy scenario
When reconstructed at CR= 13.1, it shows good quality recovery with a marginal loss in amplitude occurring for a few notches present in the QRS complex (shown by arrows).

Comparison with the State-of-the-art Techniques
When comparing the proposed method with the JCS method, a significant gain in compression performance is achieved with fewer output distortions. The improved performance gain was expected due to the utilization of the sparsity of eigenspace MECG signals using CS framework in the proposed work, which was ignored in [88].
Practical Considerations
Evaluation of computational complexity
To calculate the computational cost of the proposed method, the algorithmic complexity of PCA and CS must be calculated. We also compared the computational complexity of the proposed method with the existing CS-based methods.

Power consumption analysis
Also, if we include the quantization and entropy coding time with the data compression time, then the proposed method performs better than the rest of the techniques. This is due to the higher compression efficiency of the proposed method compared to CS-based techniques (Table 3.5).
Summary
It should be noted that the performance of the traditional MNM algorithm has been observed to be unsatisfactory when the number of measurements is small (at higher compression ratios). It improves the sparsity of the solution and reduces the number of measurements required for accurate recovery.
Proposed Joint CS Framework
Joint MECG compression
The ECG signal data in all channels lies only in subbands of lower frequency waves. The problem formulated in (4.1) can be viewed as an MMV problem aimed at simultaneously recovering the signals of all ECG channels in X using their compressed measurements in Y at the decoder.
Joint MECG reconstruction using weighted mixed-norm minimization
- Adaptive weighted mixed-norm minimization
- Binary weighted mixed-norm minimization
Small weights are applied to the entries corresponding to these subbands in order to preserve the corresponding indices in the row-support of the final solution. Therefore, relatively large weights are used for the coefficients in the rest of the detail subbands.

Joint Compression/Reconstruction Analysis
Performance measures
The performance evaluation of the proposed method is performed using some of the widely used performance metrics, such as percent-root mean square difference (P RD) and reconstruction signal-to-noise ratio (R-SN R) [45]. Due to the lesser clinical acceptability of the distortion measures defined above [1], we also used several other metrics that are specifically used as diagnostic measures of distortion for ECG signals.
Evaluation of the reconstruction quality
Features in the reconstructed signal indicate that they were preserved in the compressed signal. On the other hand, serious distortions can be observed in the traditional MNM restoration (circled in the waveforms).

Comparative Performance Analysis
First, we compare the performance of the proposed WMNM (AWMNM and BWMNM) with its unweighted counterpart, viz. to traditional MNM, which is a special case of AWMNM with p = 2 and number of iterations t = 1. Thus, we can conclude that BWMNM is better in terms of recovery speed.

Application Considerations
Energy consumption
As a result, the row vectors of the coefficient matrixA appear to be correlated and the algorithm performs better. This provides a more focal estimate of the signal as the algorithm progresses, but at the cost of additional iterations.
Computational requirements
TMSBL, which performs close to that of the proposed algorithm, is found to be the slowest in terms of running time. Therefore, the computational complexity of the decoder is not a significant issue in the case of WBAN-enabled health monitoring applications [46].
Memory requirements
Based on the above studies, it can be concluded that there is a trade-off between the recovery speed and the reconstruction accuracy. The proposed CS framework using the joint WMNM recovery transfers the computational burden from the encoder to the decoder.
MMV Recovery Versus SMV Recovery
The reduced number of measurements can increase the overall energy efficiency of the system by reducing the computational load and increasing the compression efficiency of the system [46]. Therefore, there is a need to study the difference in algorithm performance with respect to these parameters.

Summary
In this chapter, the multi-scale wavelet structure of MECG signals is studied and this information is incorporated into joint CS recovery through a subband-based weighting approach. The organization of the chapter is as follows: Section 5.1 discusses the diagnostic significance of multiscale ECG features and ways to capture and incorporate them into weighted CS recovery.

MMV CS-based Joint Compression/Reconstruction Method
Proposed subband weighting-based WMNM algorithm
- Subband weighted MNM
- Prior weighted MNM
Unlike SWMNM, here weights are set before the start of the algorithm, since the weighting rule does not depend on the coefficient matrix A. The weighting factors for detail coefficients must be legally chosen by studying the decay characteristics of the coefficients on different wavelet scales.
Performance Measures
Joint Recovery Analysis Under Different Weighting Rules
The poor performance of subband amplitude weighting is mainly due to its nearly linear variation across subbands (Figure 5.2(a)), which was expected to follow the exponential decay characteristics of the wavelet coefficients. Pre-weighting best captures these exponential decay features, followed by entropy- and energy-based weights.

Results and Discussions
- Evaluation of the reconstruction results
- Evaluation of the compression performance
- Recovery performance in noisy scenarios
- Application Considerations
The comparison between the performance of the proposed method and the wavelet-based SPIHT method is also carried out. In this section, we studied the performance of the proposed techniques in the presence of measurement noise.
Exploiting Block-sparse Structure of MECG Signals
Block-sparse-based joint MECG recovery
Thus, each block A[i] contains tightly correlated MECG signal samples from across the channels (in rows) and from within the channels (in columns). An example of such a block structure in real MECG signals can be seen in Figure 2.3 discussed in Chapter 2.
Comparative performance analysis
The results are also compared with our row-based joint CS recovery algorithms proposed in the previous chapter (AWMNM and BWMNM) and this chapter (PWMNM and SWMNM), which also exploit spatial correlation. This opens the scope for further improvements in block-based joint CS recovery of MECG signals.

Summary
Vandergheynst, “Compressed Sensing for Energy-Efficient Real-Time ECG Compression in Wireless Body Sensor Nodes,” IEEE Transactions on Biomedical Engineering, vol. Katz, “Weighted diagnostic distortion (WDD) measure for ECG signal compression,” IEEE Transactions on Biomedical Engineering, vol.