She came to the University of Rochester in the summer of 2002 and began her graduate studies in Finance. Portfolio in Booms and Recessions 74 Table 4.3 Factor model with both the market factor and the.

Literature Review
Define the firm's average Tobin's Q as then is the company's expected return. Proposition 1 shows that the expected return for a company with weaker corporate governance is lower.1 Expansion option is a purchase option.
Economic Environment
The investment and financing decisions are made before the firm learns about the values of both the aggregate and idiosyncratic productivity shocks at date t + 1. To simplify the model, I assume that the manager's ownership of the firm, a, and the strength of that firm's corporate governance, rj , is chosen independently and remains unchanged over time.
Defaultable Debt
Instead, we can write the value of debt dt+i as an explicit function of the liability lt+\ and the equity capital kt+\. This indirect effect of corporate governance raises the value of the debt as implied by the second prediction of Lemma 1.
Financing Costs
Optimal Policies
- Optimal Expropriation
- Optimal Investment
- Credit Spread
- Discussion
The left side of the equation is the marginal cost of expropriation and the right side is the marginal benefit. The marginal investment costs, i.e. the left-hand side of equation (3.25), includes the cost of purchasing the capital and the cost of adjusting the capital level, represented by the first and second terms, respectively. The first term captures the marginal increase in debt capacity due to higher capital levels, implied by Lemma 1. The increase in debt is more valuable if the firm is financially constrained, represented by the additional Ai term.
The second part of the marginal benefits comes from the increase in the company's expected future value. The repayment of the obligation makes the company more likely to be financially constrained, which increases the cost of financing. The left-hand side of the Euler equation (3.28) refers to the marginal benefits of liability.
The right-hand side of Euler's equation is the present value of the marginal costs of debt repayment at date t + 1.
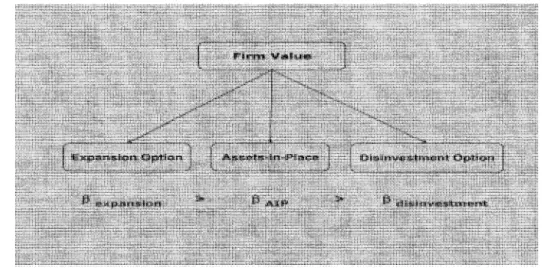
Adding values in booms makes the value of the firm more in line with the market, and the expected return is higher with the flexibility to invest. On the contrary, the addition of values in recessions makes the value of the firm less correlated with the market, and the expected return is lower with the flexibility to disinvest. The same conclusion can therefore be drawn from the neoclassical model that the option to invest during boom times increases risk and the option to disinvest during recessions decreases risk.
T h e Model Solution
- Calibration
- Basic properties of t h e model solution
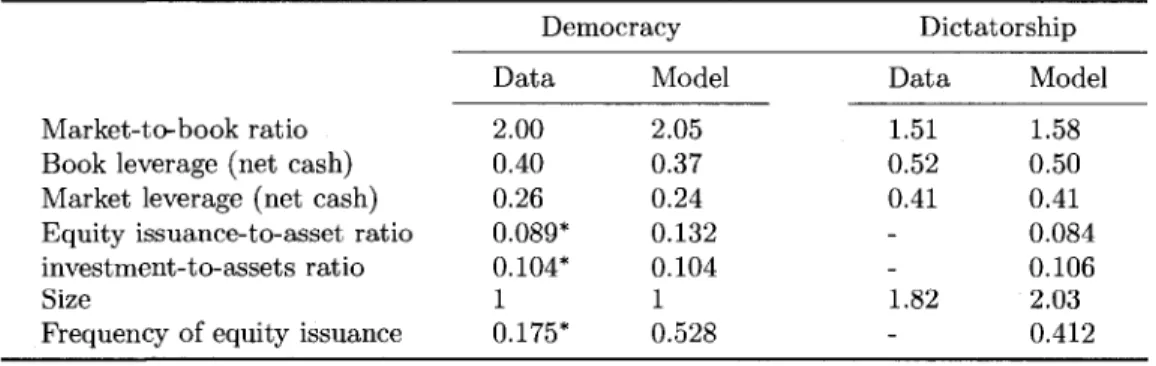
The fixed share issue cost Ao is calibrated at 10~4 so that the ratio of the fixed cost to the average level of return from share issue is approximately 0.3%. In the calibration, I choose the value of the fixed cost / to match the average market-to-book value of the perfectly controlled firms to that of democracy firms. The value of 77 is chosen to match the market-to-book value of the poorly governed firms with that of dictatorship firms.
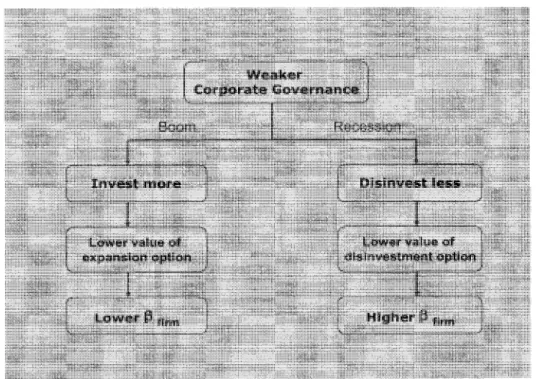
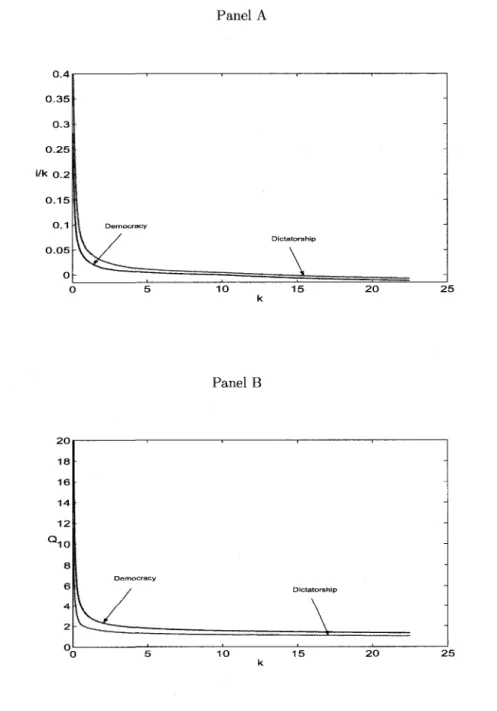
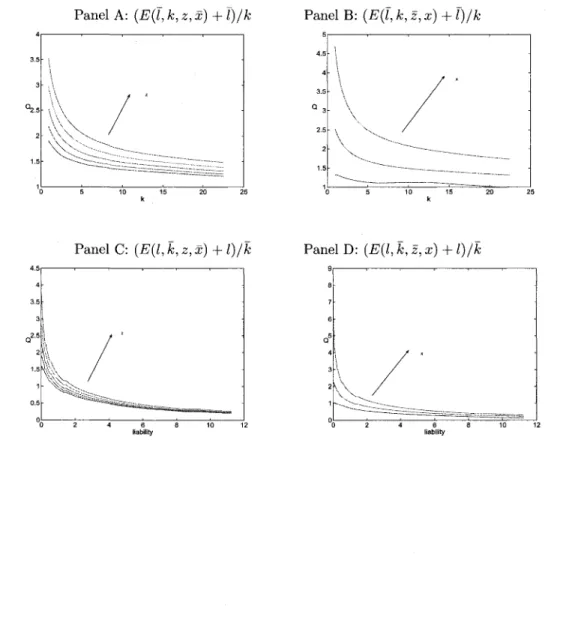
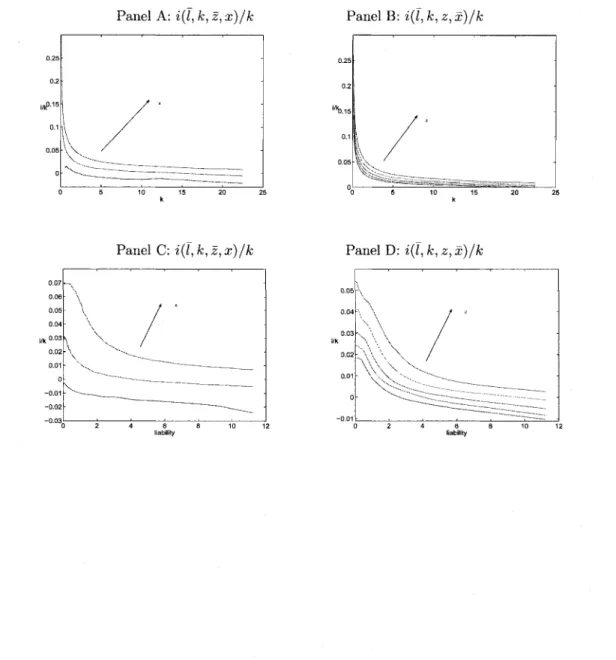
The figures show that the company's market value falls as the liability increases, ceteris paribus. This figure plots the market-to-book ratio ((Ejt + Ijt)/kjt) as functions of the state variables. Both panels A and C have a class of curves corresponding to different values of the firm-specific productivity Zjt, and the arrow in each panel indicates the direction along which Zjt increases.
Panels B and D have a class of curves corresponding to different values of aggregate productivity Xt, and the arrows indicate the direction in which x is increasing.
Quantitative Results
- Governance and t h e Value of t h e F i r m
- C o r p o r a t e Governance and Capital E x p e n d i t u r e
- C o r p o r a t e Governance a n d t h e Cost of D e b t
- C o r p o r a t e Governance a n d Financing Policy
- Governance and Returns
Real data moments of market-to-book ratio (dt + Et)/kt, book leverage dt/kt and market leverage dt/{dt + Et) are obtained from Litov (2005). The positive relationship between corporate governance and firm value is well documented in the literature. This table reports the cross-sectional regression of industry-adjusted Tobin's Q on the governance model and the log of book value of assets.
DEMO is a dummy variable for democratic firms, and log BTM is the log of the book-to-market ratio as a control variable. This table reports the Fama-MacBeth regression of the credit spread on the Democracy dummy and control variables. The table reports only the coefficients and t-statistics of the governance index for the actual data and the apparent democracy for the simulated data.
This table reports the Fama-MacBeth regression of net debt issued on the fiscal deficit.
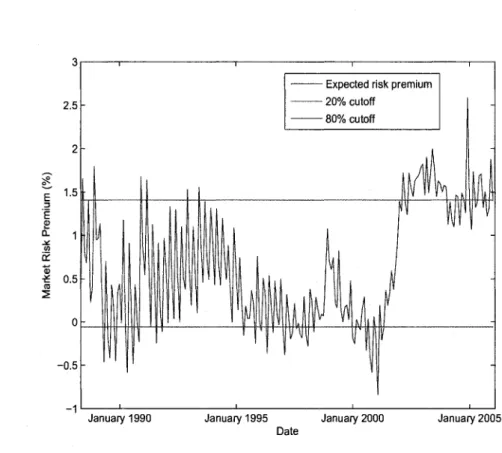
I classify month t as recession if the expected risk premium of month t is in the top 20% of risk premiums in the sample; I classify it as boom if the expected risk premium is in the lowest 20%. The sample period used in the estimation of the expected risk premiums is from January 1980 to December 2005, the so-called "Volcker-Greenspan" period. There has been documented in the macroeconomic literature that there has been a structural break in Federal Bank monetary policy since Volcker's appointment as Fed Chairman.
Clarida, Gali and Gertler (2000) show that interest rate policy in the Volcker-Greenspan period is much more sensitive to changes in expected inflation than in the pre-Volcker period. Moreover, McConnell and Perez-Quiros (2000) and Kim and Nelson (1999) independently find that there is a structural break in the US. Volcker-Greenspan" period.
In particular, a higher short-term T-bill rate predicts a good state in the "pre-Volcker" period, but predicts a bad state in the "Volcker-Greenspan period."
Investment Factors
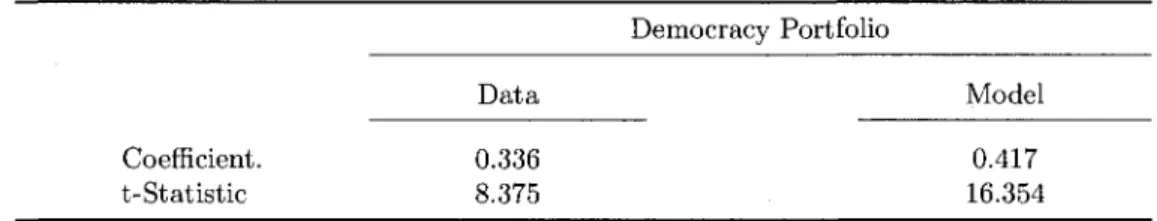
The investment factor is the average return on the nine high investment-to-asset ratio portfolios minus the average return on the nine low investment-to-asset ratio portfolios. Consistent with the model's prediction that firms with weak governance overinvest, the governance portfolio has a negative loading on the investment factor. This table reports the augmented CAPM regression of the investment factor: Rt = a + j3\ * RMRFt + 02 * INVt + i-t, where Rt is the excess return relative to the risk-free rate of the value-weighted government portfolio at month t , is the abnormal return, RMRFt is the excess return of the value-weighted market portfolio, and INVt are the monthly returns on portfolios that mimic the zero investment factor that captures the effect of overinvestment.
This investment factor is the return of the zero-cost portfolio that buys firms in the low investment-to-asset ratio decile and sells firms in the high investment-to-asset ratio decile, controlling for size, book-to-market, and industry effects. The investment factor is the return on the zero-cost portfolio that buys firms in the low investment-to-asset ratio decile and sells firms in the high investment-to-asset ratio decile, controlling for size, book-to-market, and industry effects. This table reports the investment factor augmented Fama-French-Carhart four-factor regression: Rt = a+fa * RMRFt +/32*SMBt+P3*HMLt+/34* Momentumt +(35*INVt+et, where Rt is the excess return relative at the risk-free rate for the value-weighted Governance portfolio at month t, a is the abnormal return, RMRFt is the excess return of the value-weighted market portfolio, and SMBt, HMLt, Momentumt, and INVt are the month t returns on the zero investment factor-mimicking portfolios that capture size, book-to-market, momentum and investment effects respectively.
This table reports the augmented investment factor of the Fama-Prench-Carhart four-factor regression: Rt = a+0i* RMRFt + /32 * SMBt + fa * HMLt + Ai * Momentumt +/35* INVt + et, where Rt is the excess the return relative to the risk-free rate of the value-weighted government portfolio in month t is the abnormal return, RMRFt is the excess return of the value-weighted market portfolio, and SMBt, HMLt, Momentumt, and INVt are the returns for month t in portfolios that mimic the zero investment factor that capture the size, market ratio, momentum, and investment effects, respectively.
Conclusion
Restrictions on Articles of Association and Charter Changes These provisions limit shareholders' ability to change the company's governing documents. The cost of such protection can be used as a market measure of the quality of corporate governance [Core (2000)]. P e n s i e parachute This provision prevents an acquirer from using excess cash in the target's retirement fund to fund an acquisition.
Ok and a\ are the radii of the search circles in the space of k and I, respectively. If the solution for Democracy firms, the manager's value function is the same as the value of equity. Make initial guesses NG of the optimal policy functions, (k*l9(ik, il, ix, iz), l*w(ik,il,ix,iz)), at each grid point.
Define the fitness function for the solution ig as the average of the value functions at all grid points in the state space under the solution ig, i.e.
Proofs
To find the condition which guarantees the negative relation between expected return and the strength of government, let us first simplify A^irfj/il — s*). If the firm pays dividends, the manager chooses the optimal expropriation rate sd so that MBt equals MCf. If the firm issues equity, the optimal expropriation rate is that at which MBt equals MC%.
Since Ai is positive, the expropriation rate when issuing equity is less than during payment. The expropriation rate at the time when the company switches from a dividend payment scheme to a share-issuing scheme is given by St, defined in equation 3.4.1. When st is less than se, the company must raise equity capital, and the manager must expropriate at the low rate se.
When the value of st falls between se and sd, the manager will expropriate at the rate st s o that.