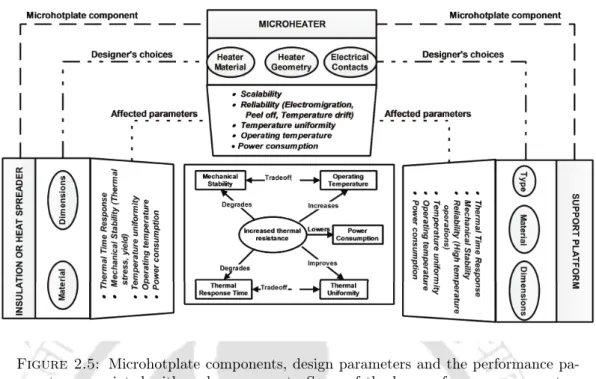
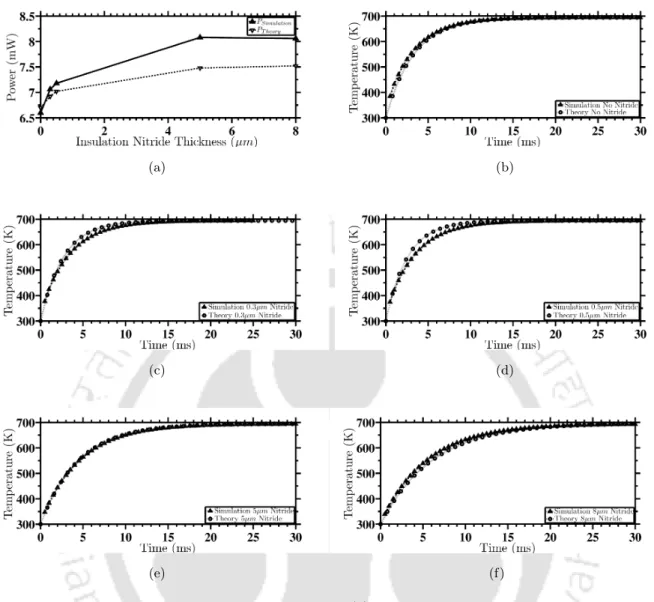
Some of the key performance parameters and tradeoffs between them are shown in the middle. 68 3.18 Comparison of simulation and analytical model temperature profile over. the half length of membrane for case-3, with 2 V and 8 µm insulation nitride thickness.
Problem Definition
Major Contributions
An analytical model is developed for the area optimization and the developed model will also help to reduce the optimization time. The developed model will help sensor designers in design optimization and to predict the sensitivity and selectivity with respect to different gases.
Outline of the Thesis
Membrane Area Error Reduction: While developing an analytical model for insulation area optimization, we have identified that the existing methods used for area approximation lead to significant area errors. Wafer-level fabrication of square micro-hotplates and its characteristics: A simple square micro-hotplate is fabricated and detailed fabrication steps are documented.
Summary
Heater Geometry
In order to systematically decide on the line width variation of the double helix design, Velmathi et al. The double meander heater is another heater geometry that results from line width variation.
![Figure 2.1: Various microheater geometries reported in literature (a) [2], (b) Square Rings [3], (c) Double Spiral [4], (d) Honeycomb [5], (e) Drive-wheel [5], (f) S shape [6], (g) Parallel-Meander [7], (h) R-Shape [8], (i) Double Meander [9], (j) Single R](https://thumb-ap.123doks.com/thumbv2/azpdfnet/10509972.0/31.893.175.735.127.793/various-microheater-geometries-reported-literature-honeycomb-parallel-meander.webp)
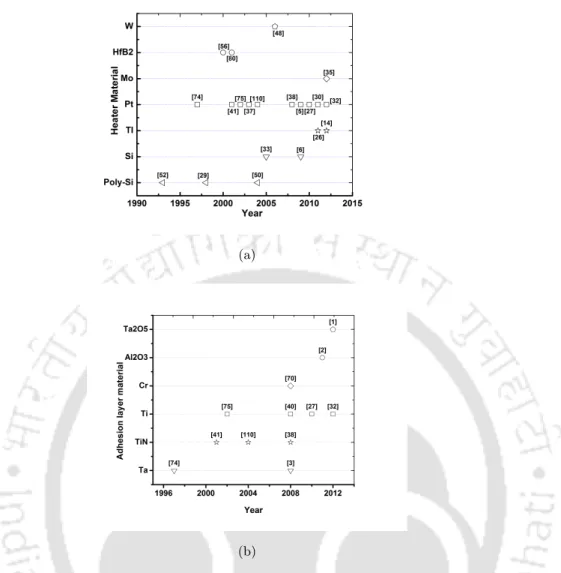
Heater Materials
However, platinum metal suffers from poor bonding problems and requires a bonding layer which again increases the manufacturing complexity. Tantalum silicide, titanium and tantalum pentoxide have also been used as bonding layers on nitride microcookers [26].
Electrical Contacts
On the other hand, narrow electrical contacts reduce heat loss, so the voltage drop on the heater and the temperature reached will be lower. Therefore, the designer must consider the minimum wire bonding area, the effect of electromigration and the effect of heat dissipation when designing the width and shape of the electrical contact line.
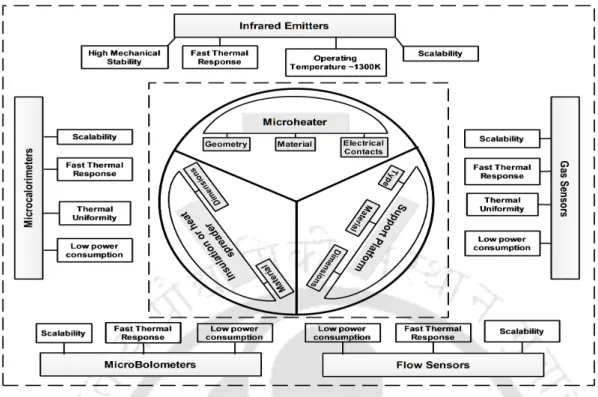
Support Platform
Type
The number of support arms determines the mechanical stability and thermal resistance of the membrane. In an open-type membrane, one of the design aspects that requires the attention of designers is the corner joints of the support arms.
Choice of Membrane Materials
Low conduction losses in the membrane or substrate can be ensured by using PI substrates, due to their low thermal conductivity W/mK compared to inorganic materials such as silicon dioxide, silicon nitride. In this regard, porous silicon (PS) has attracted attention due to its low thermal conductivity.
Dimensions of Membrane and Supporting Arms
The membrane thickness directly affects the energy consumption of the micro cooktop and the manufacturing limits determine the minimum membrane thickness. The underlying principle behind these optimizations stems from the fact that power consumption can be reduced by increasing thermal resistance (either by thinning the membrane, by using material with low thermal conductivity or by increasing the distance between heat source/sink to increase) and the thermal response. is improved by reducing thermal resistance [80].
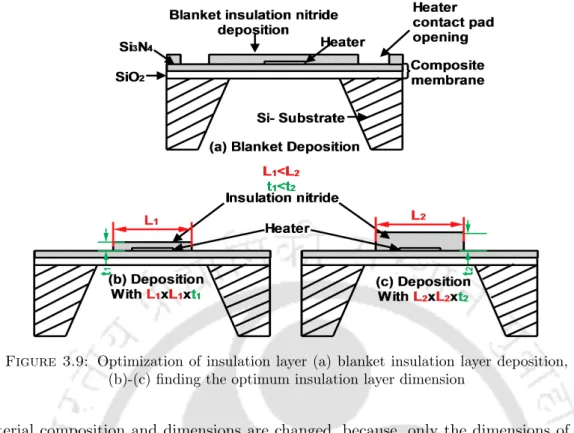
Insulation Layer or Heat Spreader
The nitride insulating layer not only increases the mechanical stability of the membrane, but also the achievable temperature [5]. This is because, with selective application, the thermal conductivity can be increased only in a selected part of the membrane, i.e. in the active area.
Modeling of Microhotplate
In summary, the lumped model can be used for the rapid estimation of power consumption and the response time of the micro hot plates. Due to finite resistance and heat sink capabilities of the contact pads, the isotherm on the.
Methods of Characterization
The accelerated aging test helps to assess the reliability of micro-heaters [9], in which micro-cooktops are subjected to repeated thermal cycles. Due to the lack of data, the FOM of some microcookers is available in the table.
Summary
The size, material and type of this platform have a major influence on the performance parameters such as thermal time response, mechanical stability, thermal stress-induced reliability issues, temperature uniformity, maximum operating temperature and energy consumption. The choice of membrane material for both closed and open membranes affects the performance parameters such as power, temperature uniformity, mechanical stability, time response, efficiency etc. of a micro cooktop. The third main component of a microheater plate, i.e. the insulation layer, is used to separate the thermal domain (represented by the microheater plate) and the application domain (such as a gas sensing layer or a microfluidic channel).
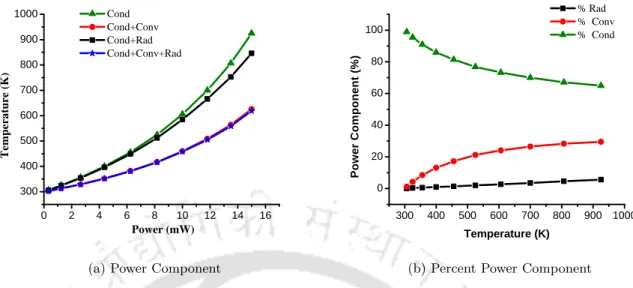
Power Loss Components of Microhotplate- A Simulation Study
Results and Discussion
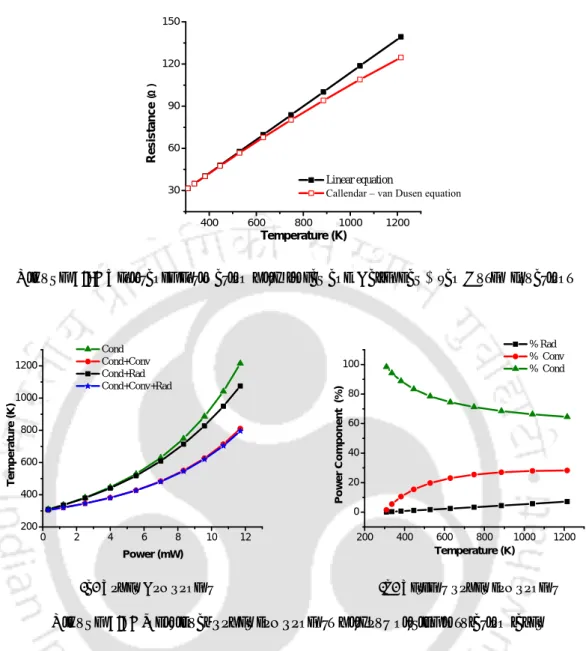
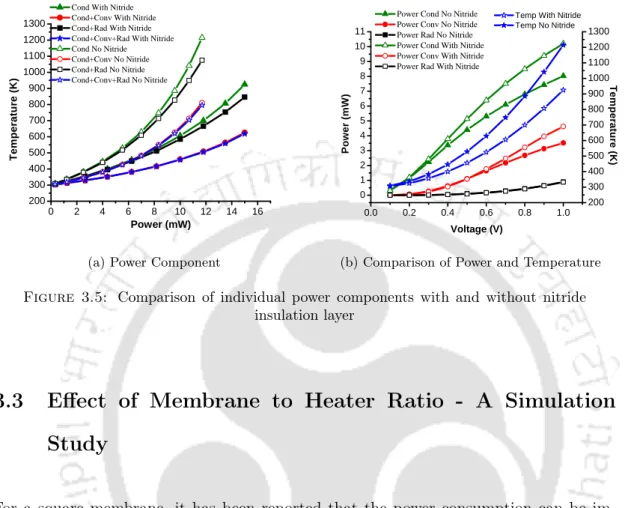
As expected, the achievable temperature will be higher for any given power when convection losses are neglected and only conduction losses are considered. By depositing the nitride layer on the microheater, the conduction losses in the insulating layer will also add to the total losses and the results are shown in Fig.3.4. Convection loss can be minimized by reducing the membrane surface area, but in doing so, conduction losses in the bulk silicon will increase [6].
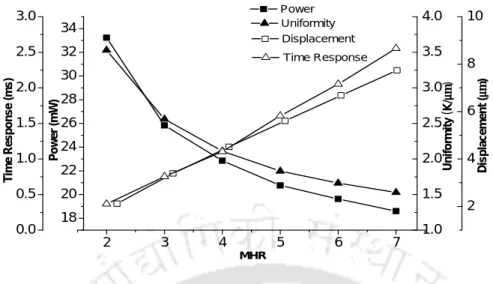
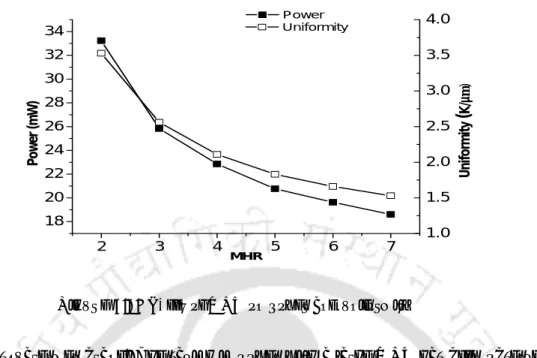
Effect of Membrane to Heater Ratio - A Simulation Study
Results and Discussion
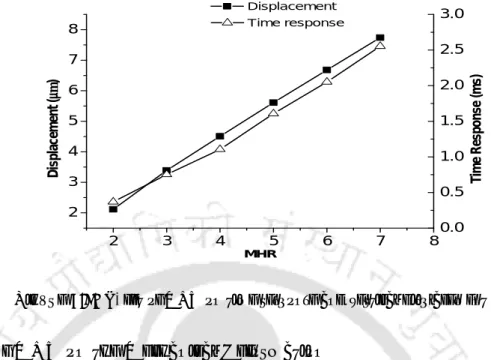
As the MHR increases, the power required to reach a certain temperature decreases, this is due to the increase in the thermal resistance of the membrane. The effect of MHR on the temperature uniformity of the active zone is shown in Fig. A large MHR can be used to improve the power consumption and temperature uniformity of the heat sink.
Insulation Layer Optimization - Model and Simulation
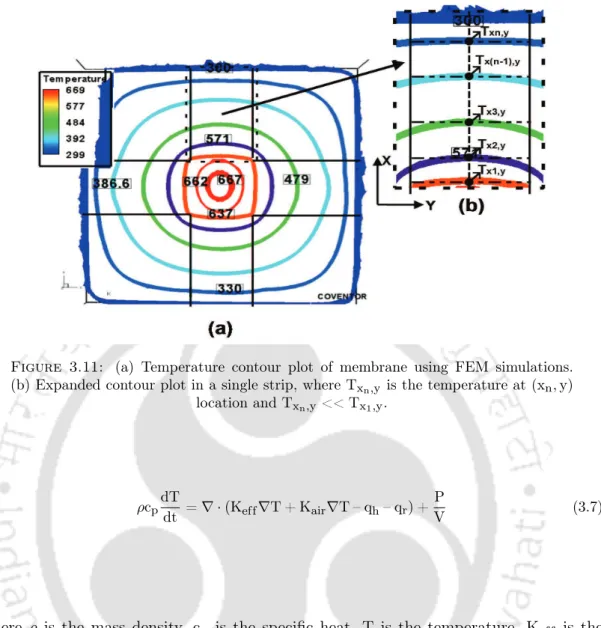
Steady State Modeling of Square Microhotplate
The region 2 (x = Lh/2 to x = Lnit/2) consists of the heat spreader film with no heat generation. Due to the large difference between the length (517µm) compared to the thickness (<10µm) of the membrane, the 3D geometry of the membrane can be approximated as 2D. The thermal conductivity of the three regions depends on the direction of thermal heat transfer.
Comparison of Theoretical and Simulation Results
The maximum deviation between analysis and simulation results occurs outside the top nitride area for 120 µm×120 µm area, at about 120 µm distance as shown in Fig. Since the intermediate temperatures are now known, the power losses in the upper insulating nitride layer can be calculated. The power loss in the top nitride due to conduction loss at different lengths is shown in fig.
Transient Analysis of Bridge Microhotplate
Transient Modeling of Bridge Membrane
Due to the greater thermal capacity of the silicon substrate, the edges of the support arms can be considered to be at room temperature. The effective width of the arm depends on the thickness of the top nitride layer. Equation (3.42) can be used now, with the calculations of the thermal resistances using (3.43) and capacitance using Eq.
Results and Discussion
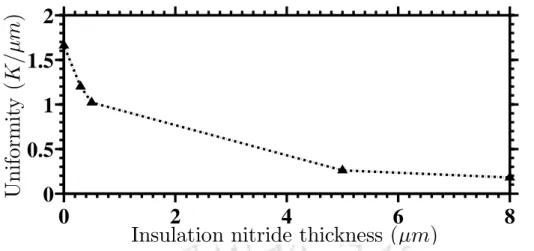
The bridge membrane of present work has two supporting arms of length (LArm) and width (Warm) of 120 µm and 100 µm respectively. As the top nitride thickness increases, the thermal resistance in the center of the membrane decreases. Compared to bridge membrane without nitride layer, the time constant increased by 72.95% with 8µm thick nitride layer.
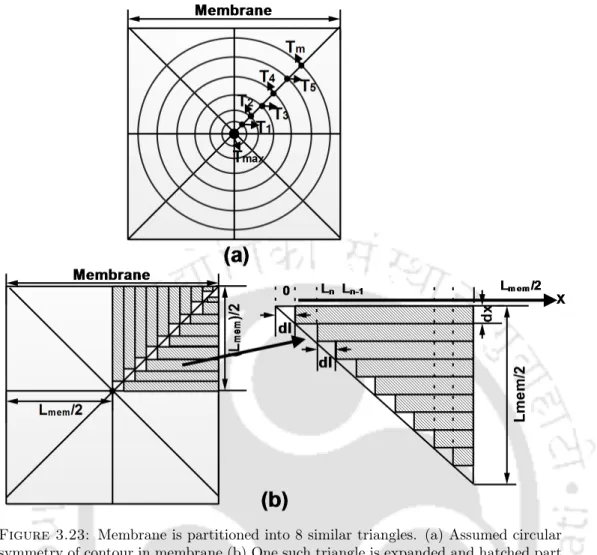
Membrane Area Error Reduction - Triangular Approximation Based Model
The approximate profile is constructed by assuming a constant temperature in the heater region equal to the desired heater temperature (Tmax), a linear reduction outside the heater region, and constant temperature (Tm) near the membrane edge. When the temperature profile is known, the power consumption can be calculated more accurately by taking the sum of power in each strip;. However, the temperature profile can be accurately predicted by using an analytical expression as obtained in [109].
Summary
The trade-off required in terms of power, temperature uniformity and time response can be determined by the main requirement of the application domain. The voltage is evaluated for a range of silicon thicknesses to address membrane fragility issues. The time of bulk micromachining will define the thickness of the remaining silicon layer in the composite membrane.
Characterization Setup
The analog output of the AD595 is connected to a Data Acquisition (DAQ) card which has a 10 bit ADC resolution. A visual basic based program is used to control and acquire data from the DAQ card. In addition, TC523A temperature controller is used to monitor the temperature inside the test box.
Results and Discussion
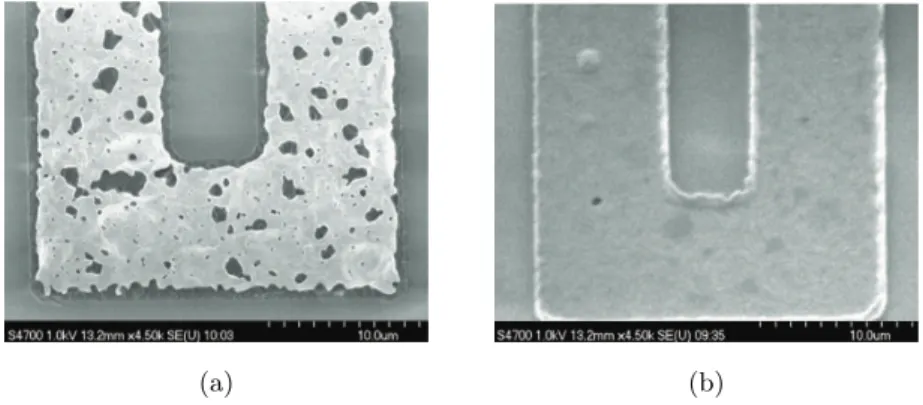
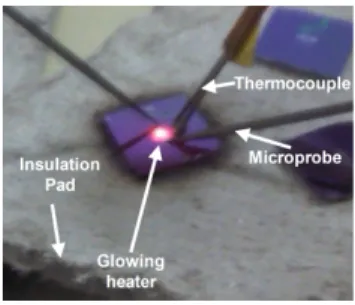
To overcome the temperature limit of silver epoxy contact and to verify whether the micro hotplate can operate at higher temperatures, we performed a separate measurement, in which the micro hotplate is measured directly with microprobes (see Fig. 4.9) and a temperature measurement is taken. >694 K is obtained when a current of 175 mA is applied. The fabricated micro hotplate can operate at a temperature of 379 K with an applied power of 306 mW, while compared to mW power is required to obtain a similar temperature. The heating efficiency of the current micro hotplate is 1.85 x 10⁻⁶ W/μm2, which is much lower compared to a smaller circular active area of π122 µm2[59], where a heating efficiency of 9.67 x 10⁻⁶ W/ μm2 was obtained.
Summary
Therefore, it is possible to design a micro-hob that will be used to detect the level of parts per million (ppm). These coupled equations can be solved iteratively using math packages such as Mathematica or Matlab. A more accurate model can be obtained by considering the width modulation of the nanowires due to surface depletion.
Device Under Gas Exposure and Bias Voltage
During this bias condition, the drain Schottky diode is forward biased and the source diode is reverse biased. Similar to negative drain bias condition, the drain width shape d2 will be changed and there will be a notch on the source side. Therefore, under the positive drain bias, the drain current is limited by the source Schottky diode or in other words, it is limited by the source side depletion width.
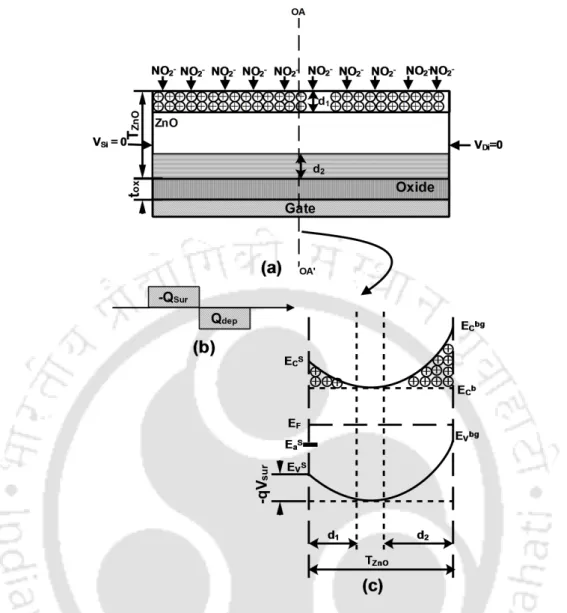
Estimation of Surface Depletion Width, Potential and Band Bending
This interaction creates the surface void width (d1), which is an important parameter in sensor design. The gas-surface exchange will cause the band bending and the surface potential can be related to the surface gap width by the following relation [25],. Once the value of the surface potential is known, the curvature of the surface band ((Esc– Esa)) can be calculated using the relation [25],.
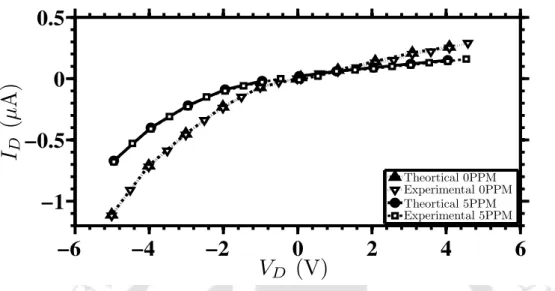
Model Verification
Oscillation frequency of charged chemisorbed state (V–) 1×10¹³s–1 Degeneracy factor for chemisorption induced states (gaw) 2 Oscillation frequency of neutral chemisorption state (V0w) 1×10¹³s–1. The shift in the turn-off voltage can be attributed to the modulation of the channel thickness caused by the change in the surface void width (d1). Sensitivity analysis can be performed for a given gate and drain-source voltage by solving Eq.
![Table 5.2: Parameters used for surface potential and band bending estimation [24, 25]](https://thumb-ap.123doks.com/thumbv2/azpdfnet/10509972.0/126.893.114.719.179.569/table-parameters-used-surface-potential-band-bending-estimation.webp)
Summary
Aguir, “A dynamic response model for WO3-based ozone sensors,” Sensors and Actuators B: Chemical, vol. Raskin, “Optimization of SOI CMOS Compatible Low Power Microheaters for Smart Gas Sensor Fabrication,” Sensors Journal, IEEE, vol. Samotaev, “Alumina MEMS Platform for Pulsed Semiconductor and IR Optical Gas Sensors,” Sensors and Actuators B: Chemical, vol.
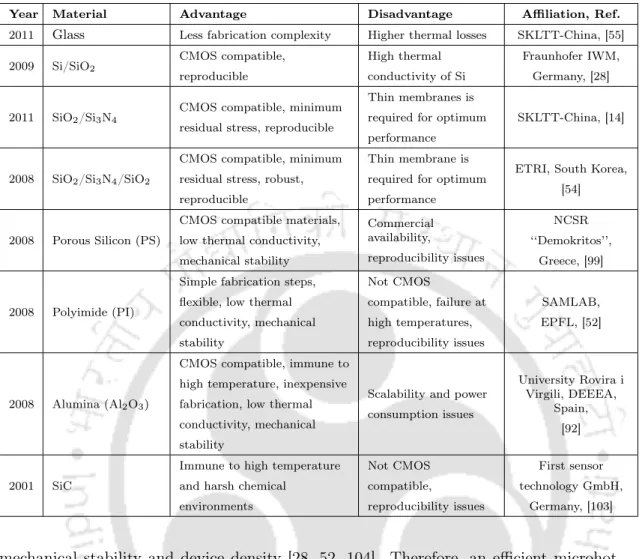
Summary of membrane materials employed in microhotplates
Summary of various reported microhotplates
Material properties used for simulations [21]
Device parameters used in the result verification [19, 22, 23]