A transient thermal analysis of the roll and strip together is then performed to inversely estimate the thermal parameters. T τ the imposed temperature field on the cylinder used in Eq. 3.23) T0 initial temperature of roll and strip.
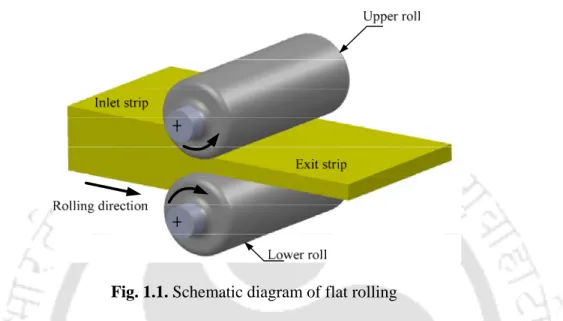
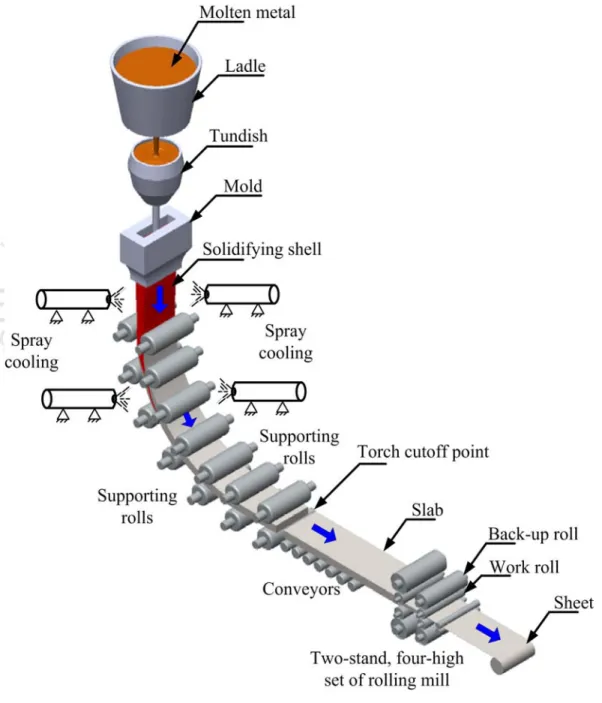
Flat Rolling
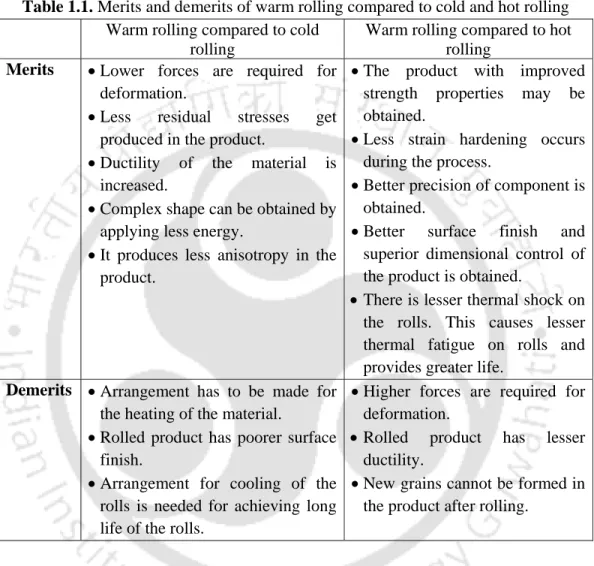
Arrangement for cooling the rolls is necessary for achieving a long life of the rolls. The modeling of hot rolling process has attracted the attention of a number of researchers in view of its significant contribution to the overall cost of the product (Subramanian and Bourell, 1984; Hawkins, 1985; Koohbor, 2015).
Importance of Inverse Estimation in Flat Rolling Process
The practical significance of inverse estimation of material and process parameters in the rolling process is briefly described in the next section. In this thesis, an inverse method is proposed to estimate the mechanical properties, thermal parameters and the friction coefficient based on the output temperature of the rolled strip measurement.
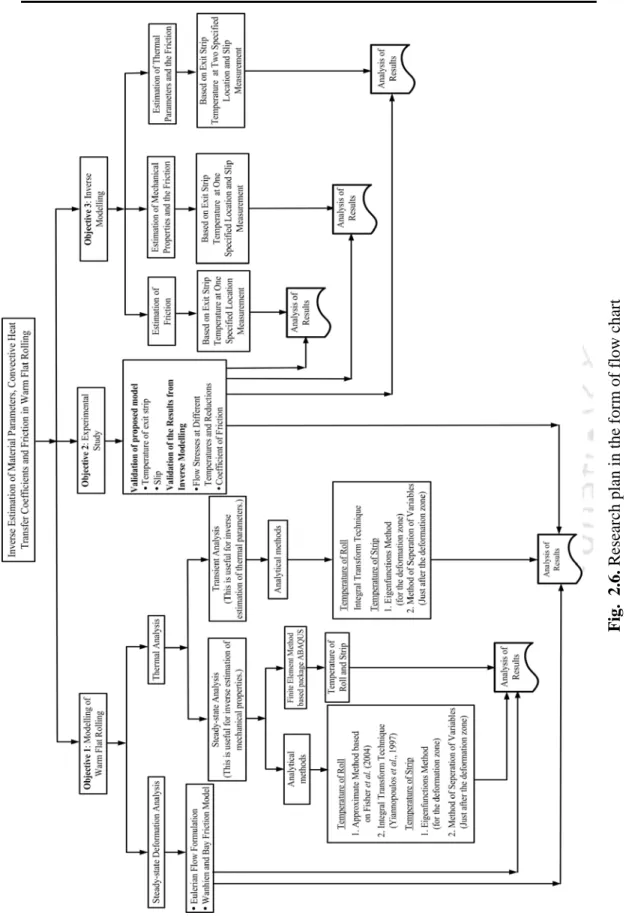
Scope and Objectives of the Present Thesis
Organization of the Thesis
In Chapter 6, an inverse method is presented to obtain the mechanical parameters and the coefficient of friction in flat rolling based on the steady-state temperature distribution and slip of the output belt. In Chapter 7, inverse estimation of thermal parameters and the coefficient of friction in flat rolling is performed based on transient temperature distribution of output band and slip.
Introduction
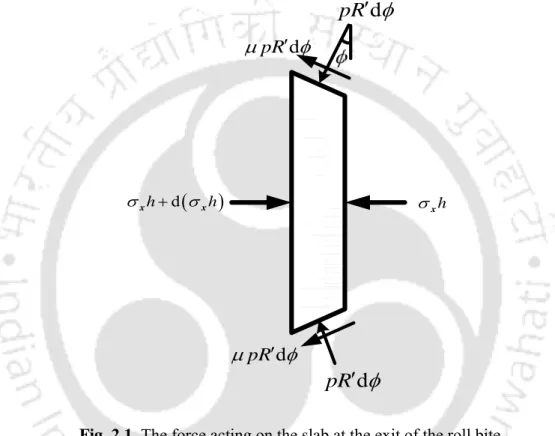
Deformation Analysis
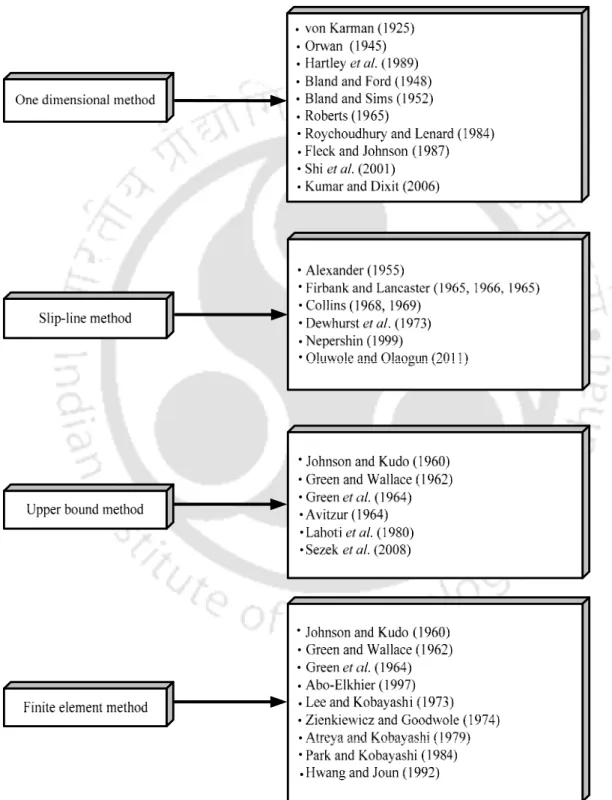
- One-dimensional Models
- Slip-line Field Models
- Upper Bound Models
- Models based on Finite Element Methods
Perhaps the most versatile computer-based analysis method is the finite element method. Artificial neural network models have been used for faster prediction of rolling force and rolling torque.
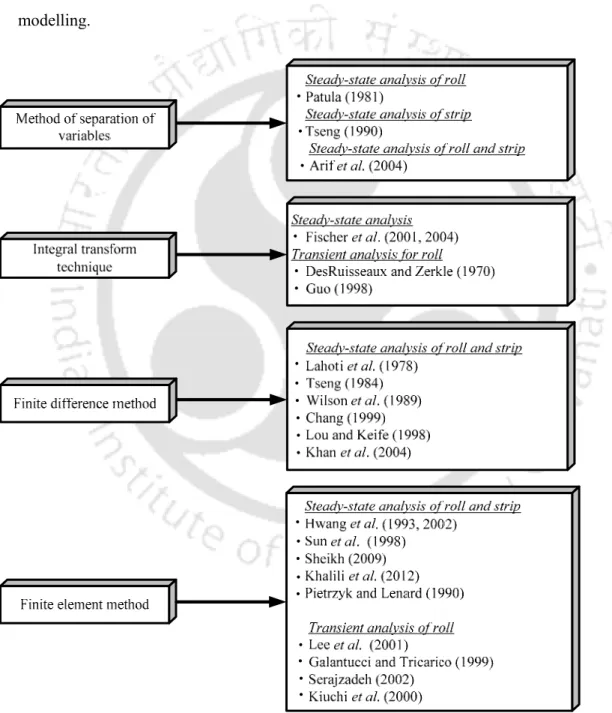
Thermal Analysis
- Method of Separation of Variables
- Integral Transform Technique
- Finite Difference Method
- Finite Element Method
1978) presented a finite difference method (FDM) model to find the temperature distribution in the roll and belt. Tseng (1984) developed an FDM model to estimate the temperature distribution in the roll and belt.
Friction at the Roll-Strip Interface
Experimental Investigation on Friction
Lenard and Kalpakjian (1991) conducted the experiments to measure the friction coefficient at the roller strip interface as a function of speed and temperature of the strip. The authors obtained the variation of the friction coefficient in the contact area by taking the ratio of shear stress to normal pressure.
Theoretical Investigation on Friction
Other researchers also observed the variation of friction at the interface of the roller strip (Rooyen and Backofen, 1957; The authors estimated that the coefficient of friction based on the forward slip measurement. 2008) observed the variation of friction in both longitudinal and transverse directions. on the roller strip interface.
Research on Inverse Techniques
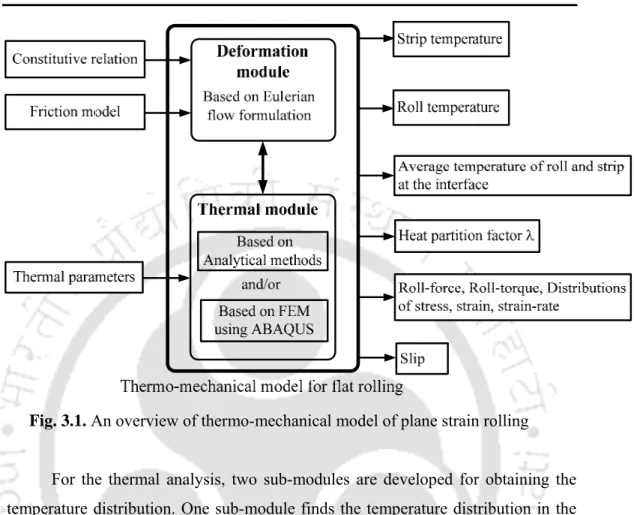
It consists of two modules— (1) strip deformation analysis considering constitutive coupling and friction model and (2) thermal analysis of roll and strip. Finally, the average roll and strip temperature at the rolling strip interface is calculated.
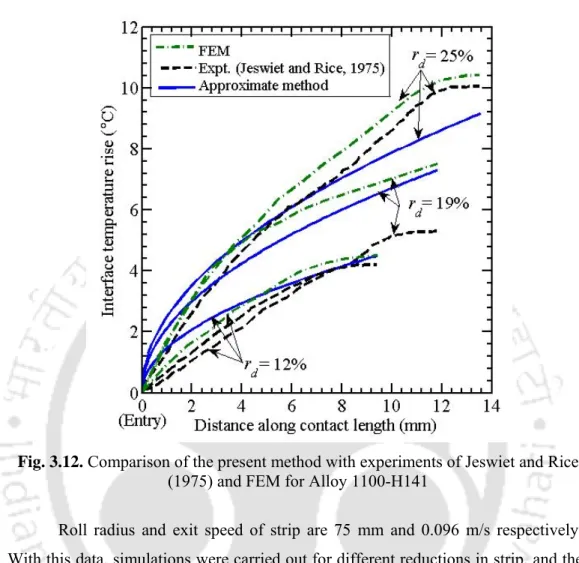
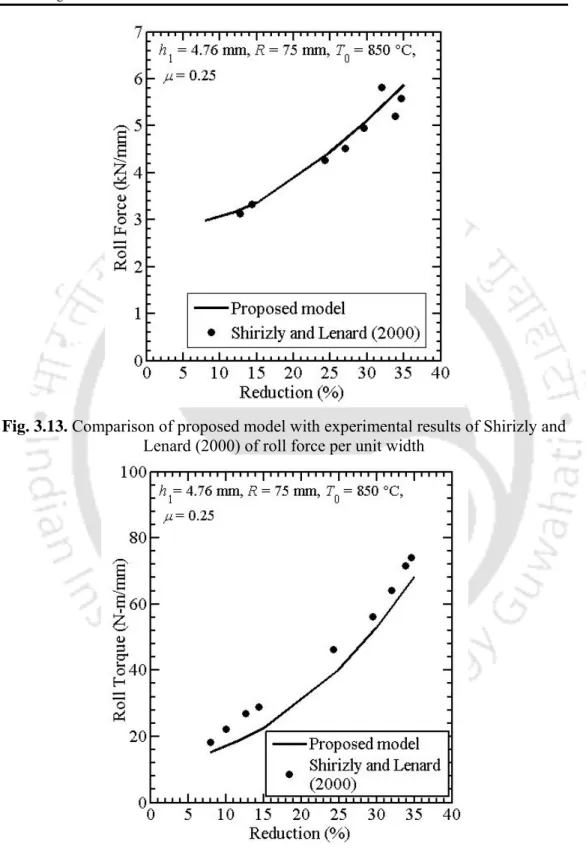
Typical Results Obtained from the Proposed Model
Validation
Additionally, an attempt was made to validate the roller surface temperature with the average temperature at the belt interface. The inner diameter of the roll and convection heat transfer coefficients are assumed as in the previous example.
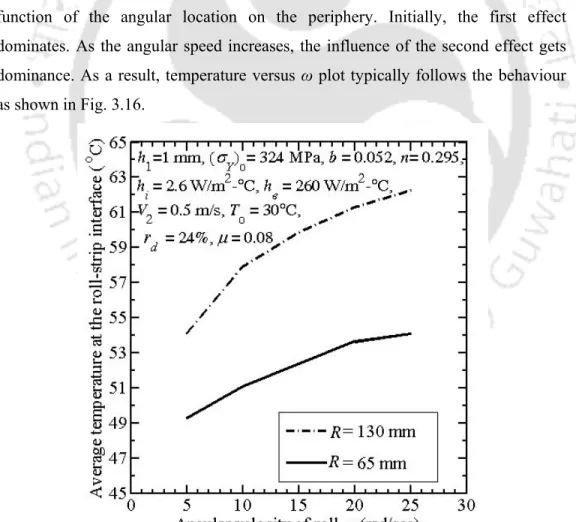
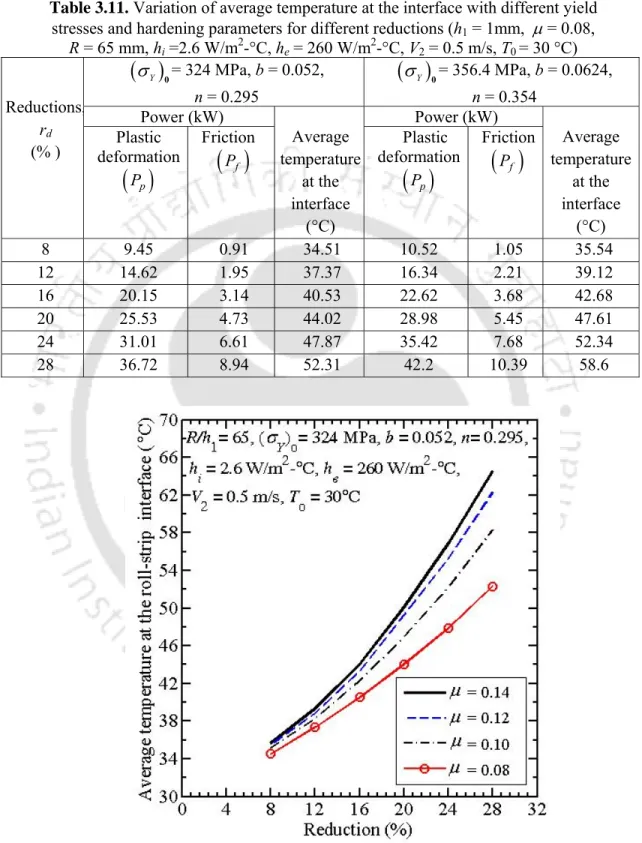
Parametric Study
It is observed that the temperature increases with increasing angular velocity, but the rate of increase of temperature with angular velocity decreases with increasing angular velocity. Variation of mean interface temperature with angular velocity of rotation for different radii of rotation.
Conclusion
To predict the steady-state temperature distribution in the roll and belt, a simplified and computationally faster approximate method is proposed by adapting the model of Fischer et al. In the present work, a heat distribution factor λ is calculated by matching the average temperature of the roll and the strip at the roll-strip interface.
Introduction
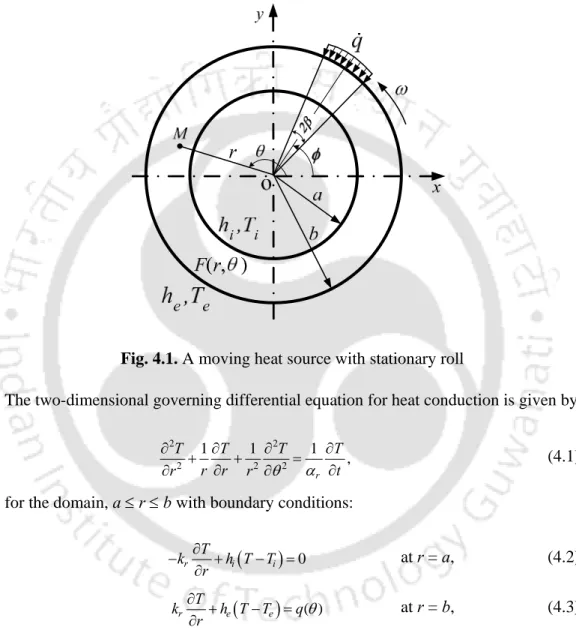
In this work, a mathematical model of hot flat roll is presented to find out the temperature distribution in the roll and the strip. The time-varying heat input into the roll from the strip is studied in Section 4.4.
Transient Temperature Distribution in Roll using Integral
A transient thermal analysis of hot flat rolling is performed to obtain the temperature distribution in both the coil and the strip. The analytical solution of the transition temperature distribution in the roll is briefly described in chapter 4.2.
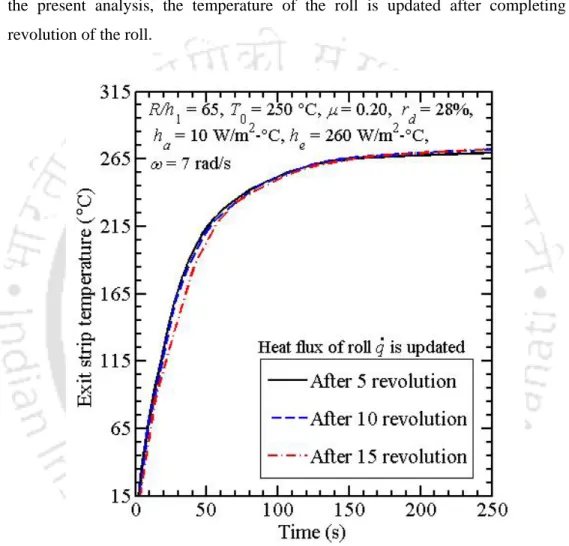
Typical Results of Transient Analysis with Varying Heat Flux
The average temperature of the roll and the strip at the roll-strip interface is matched after each increment. As the roll time increases, the heat flux input into the roll continues to decrease with increasing average temperature at the roll strip interface.
Details of Validation Experiments
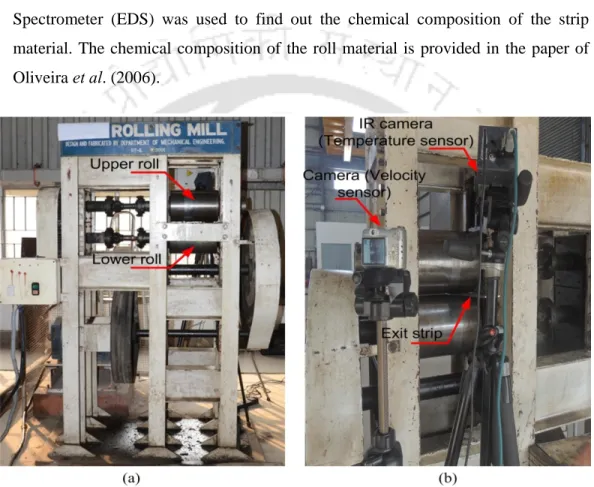
Equipment and Method
The chemical composition of the roll material is given in the article by Oliveira et al. The product of the number of frames and the time it takes to capture each frame gives the time it takes for the tape to come out of the roll slot.
Method for Measuring the Centreline Temperature of the
Thus, the lower surface of the groove was level with the strip center in the thickness direction. The schematic diagram and original dimension of the band and groove is shown in fig.
Determination of Friction from Slip Measurement
The temperature of the strip at the surface and in the center (i.e., the bottom surface of the groove) was measured just after rolling with an IR camera, as previously described. The accuracy of the estimate depends on the accuracy of the measured parameters and the mathematical model considered.
Results and Discussion for Transient Thermal Analysis of Roll-
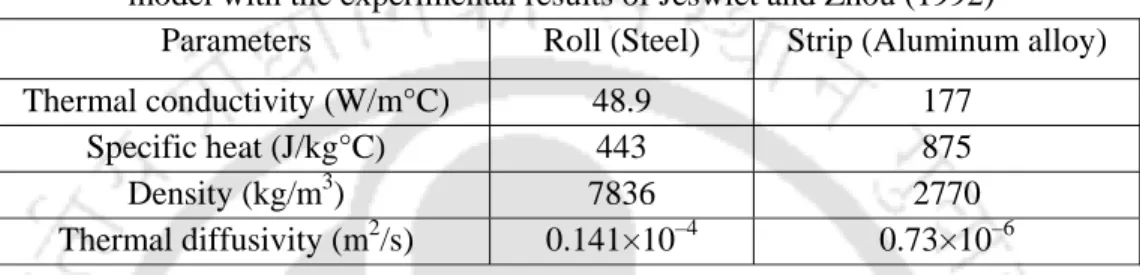
Validation of the Proposed Model under Cold Rolling
The coefficient of friction is also estimated by two other methods, in chapter 5 the method of measuring the minimum clearance in the cylinder and the inverse method based on the measurement of the output belt temperature are presented. It can be seen that the results of the proposed model are well evaluated. agreement with the experimental results of Jeswiet and Zhou (2000).
Introduction
In this chapter, the possibility of online determination of the rolling friction coefficient is proposed. The estimation of the coefficient of friction based on the smallest measurement of the rolling gap is presented in chapter 5.3.
Determination of Friction from Slip Measurement
Determination of Friction from Minimum Roll Gap Measurement
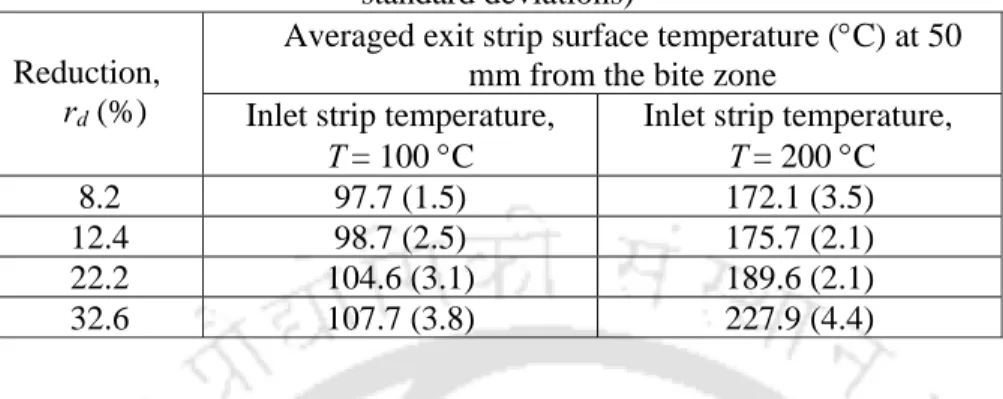
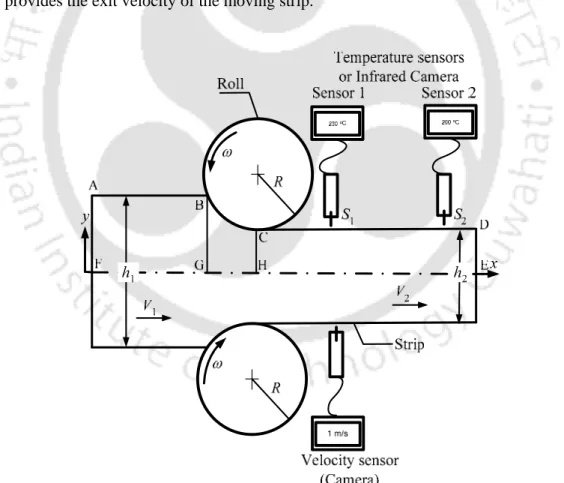
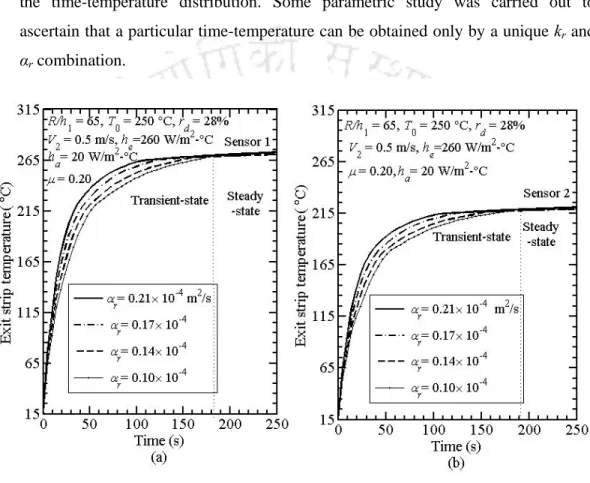
Flow diagram of the inverse model for mechanical properties and the determination of coefficient of friction. The surface temperatures of the exit strip are measured at two locations: 50 mm and 500 mm away from the roller exit point (The locations of temperature sensor 1 and sensor 2 are determined based on numerical experiments. The distance between two temperature sensors is sufficient to obtain the unique solution in the inverse estimation of the thermal parameters.).
Comparison of Coefficient of Friction Obtained from Slip and
Inverse Estimation of the Friction Based on the Exit Strip
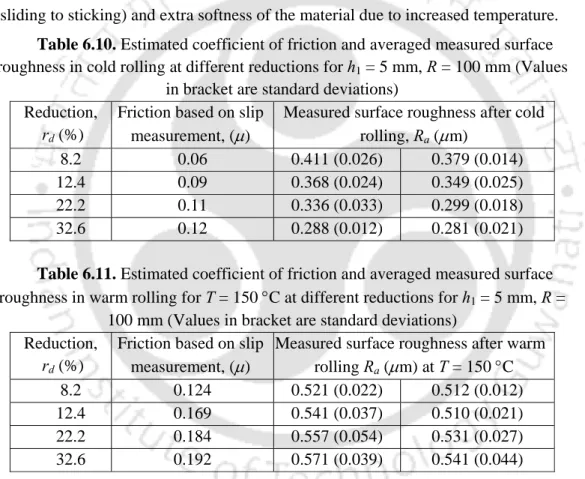
The coefficient of friction is estimated by measuring the temperature of the outlet strip surface at a given location. Comparison of friction coefficient estimated from sliding and temperature measurement in warm rolling.
Conclusion
Introduction
The methodology requires measuring the slip and temperature distribution of the strip at the exit at a single location. Experimental validation of the proposed methodology for the evaluation of friction and mechanical properties is given in a separate section based on slip and temperature measurements.
Direct Model
Inverse Model
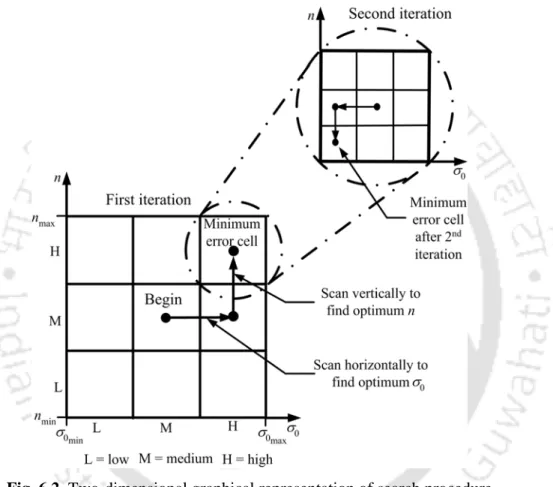
Details of the Algorithm
If the estimated temperature at the current point is greater than the measured temperature, reduce the value of σ0 by jumping to the center of the adjacent cell. If the reduction in E is negligible, both points are taken as current point and further exploration is.
Modification of the Algorithm for Variable Friction Case
If the decrease in E is significant based on a significance test, the center of the adjacent cell becomes the current point. If the decrease in E is insignificant, both points are taken as the current point and further exploration is carried out in parallel from both points.
Results and Discussion
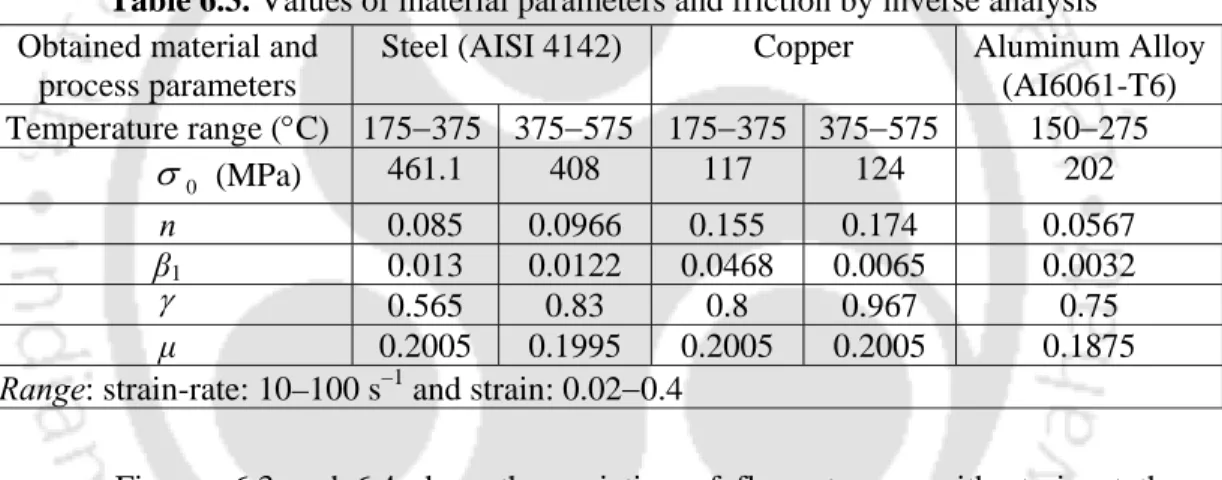
Inverse Estimation of Mechanical Properties and Friction
Variation of yield stresses with strain for copper (bar) at actual and estimated material properties for temperature (a) 250 °C (b) 325 °C. Variation of yield stresses with strain for aluminum (strip) at actual and estimated material properties for temperature (a) 150 °C (b) 250 °C.
Inverse estimation of Mechanical Properties and Friction
It has been shown that the coefficient of friction decreases with increasing inlet temperature on the belt. The behavior of the friction coefficient depends on the combination of the materials in the roll and the belt during the rolling process.
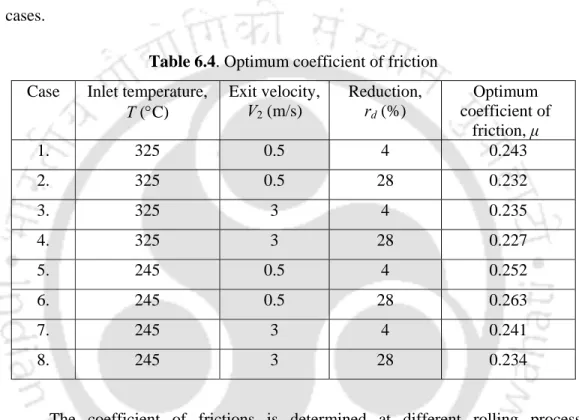
Sensitivity Analysis
The sensitivity of the temperature error with respect to the error in the estimation of the material parameter, ie, σ0,n, ,β γ1 and μ, is evaluated. It is noted that the derivatives of the temperature error in the actual and estimated parameters with respect to γ are high.
Experimental Validation of Strategy for the Inverse Estimation of
Direct Measurement of Mechanical Properties through
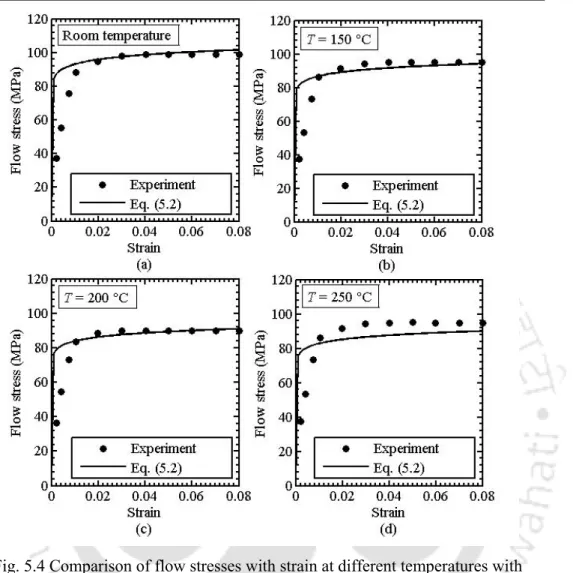
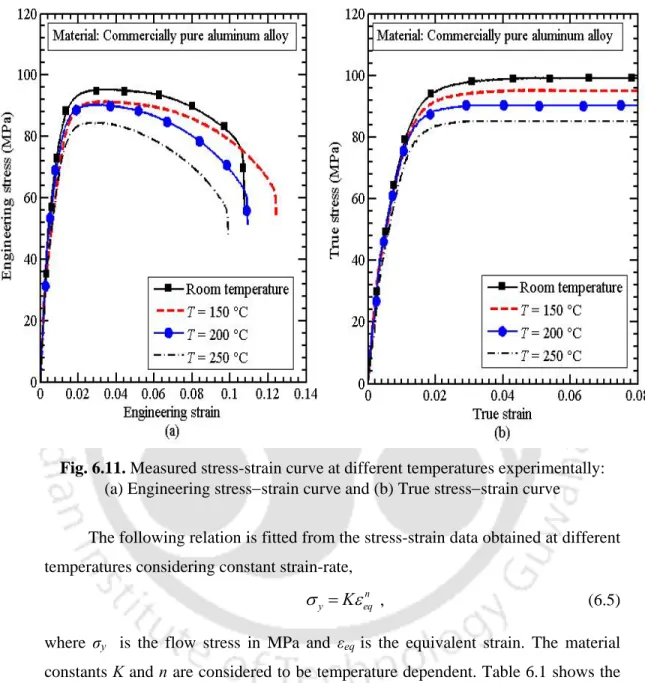
The following relation is adapted from stress-strain data obtained at various temperatures, assuming constant strain rate. The three problems are solved to estimate the unknown variables σ0, n and γ from the experimental true stress-strain data.
Determination of Mechanical Properties and the
After the strip's mechanical properties and friction coefficient are obtained from an inverse analysis, their ability to predict temperature is experimentally validated by measuring the temperature at different locations on the outlet strip. The temperature was measured on the surface and center line of the strip at 150 mm from the bite area.
Correlation of Surface Roughness and Hardness on Flow
Estimated friction coefficient and measured average surface roughness in hot rolling for T = 150 °C at different reductions for h1 = 5 mm, R. Correlation coefficients are determined between the friction coefficient and surface roughness at different reductions on the bar are - 0.967 and.
Conclusion
Average value of bar stiffness after rolling for h1 = 5 mm, R = 100 mm (Values in parentheses are standard deviations). On the other hand, the surface quality of the strip deteriorates with increasing strip inlet temperature and increases with decreasing.
Introduction
Inverse estimation of the thermal parameters and the friction coefficient. he), convective heat transfer losses at the inner periphery (hi), convective heat transfer losses of the strip surface (ha). In the present work, an inverse methodology is proposed to estimate the thermal parameters of the roll and strip by measuring the temperature of the exit strip in hot flat rolling.
Direct Model for Transient Temperature Distribution
The rest of the chapter is organized as follows: The direct model to find out the transient temperature distribution in the strip and the roll is briefly presented in Section 7.2. The experimental validation of the direct model considering hot flat rolling is provided in Subsection 4.6.2.
Parametric Study and Inference of Inverse Modelling
It is observed that the temperature distribution at 50 mm from the roller bite deviates slightly as the convective heat transfer coefficient of the roller at the inner periphery increases. Therefore, it can be assumed that the convective heat transfer coefficient at the inner periphery of the roll has no significant effect on the exit strip temperature.
Methodology for Inverse Estimation
Methodology
Results from Inverse Modelling
Conclusion
Conclusions
Scope for Future Work