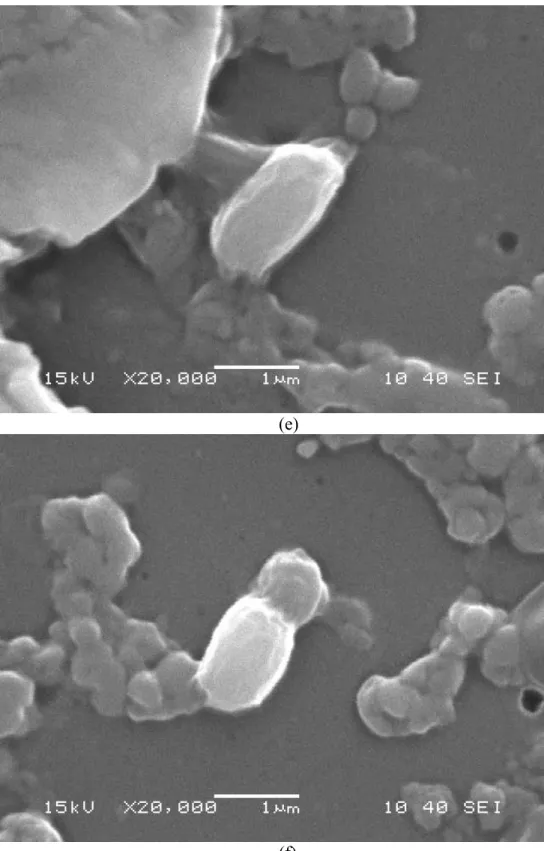
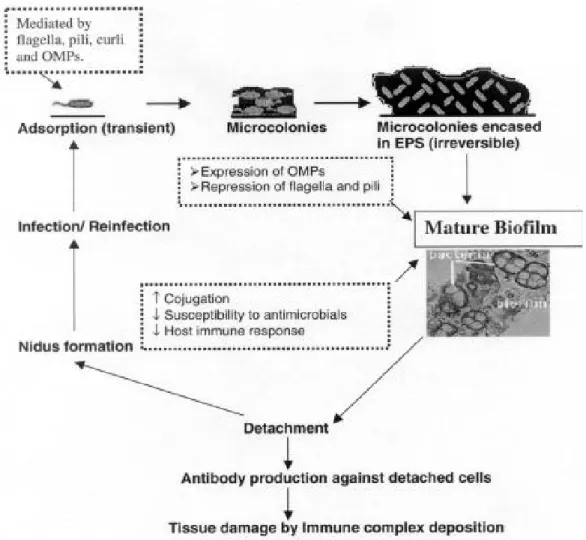
This survival strategy of the microbes is mediated by mechanical, biochemical and genetic factors (Beer and Stoodely, 2006). The different forms of biofilm ie slime flakes and microbial mats cause most of the microbial conversions in natural environments. The interior of the film becomes isolated from the external environment leading to the development of anaerobic conditions within the film.
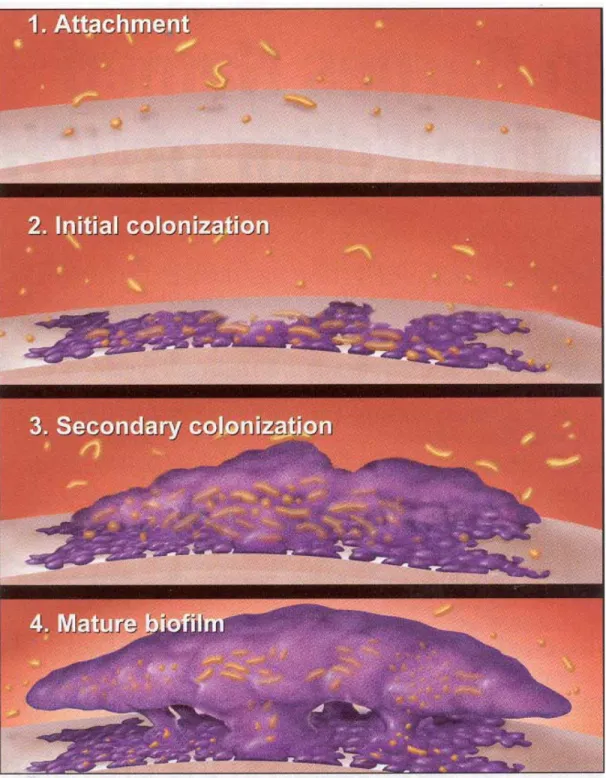
Originally thought to be free-living, these bacteria are now known to form one of the most complex microbial communities of the human body. This environmental change can favor the growth of different proteolytic bacteria, which compete with other members of the micro-community to become. 7 To study the events involved in the transformation from planktonic to colonial mode of existence, the interaction between different members of the biofilm community and the establishment of dental plaque biofilm using the classical approach, the present project work has been undertaken.
The study also aims to evaluate stress response to plaque biofilm development and qualitative and quantitative analysis of the EPS matrix, which would be useful in devising ways to prevent and disrupt these biofilms for the prevention of periodontal diseases. An attempt has been made to study the kinetics of film formation, quorum sensing among the members of the film and chemotactic response shown by the bacterial species.
REVIEW OF LITRETURE
9 specific for the EPS of different organisms can be produced during different stages of biofilm growth of the organisms and contribute to detachment (Boyd et al., 1994). It develops naturally in the teeth and is part of the host's defense systems helping to prevent enamel colonization by exogenous pathogenic microorganisms. As a result, the smooth three-dimensional structure of the film with gaps and channels collapses and the film is seen as a flattened structure (Stewart et al., 1995).
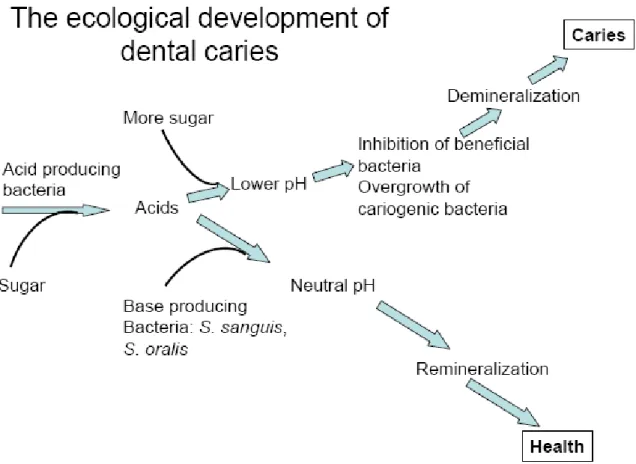
Introduction of confocal scanning laser microscopy revealed the three-dimensional structure of the biofilm community. The structure of the plaque biofilm can limit the penetration of antimicrobial agents, while bacteria growing on a surface grow slowly and display a new phenotype, one consequence of which is a reduced sensitivity to inhibitors (Gilbert et al., 2002). . Plaque is natural and contributes to the normal development of the physiology and defense of the host.
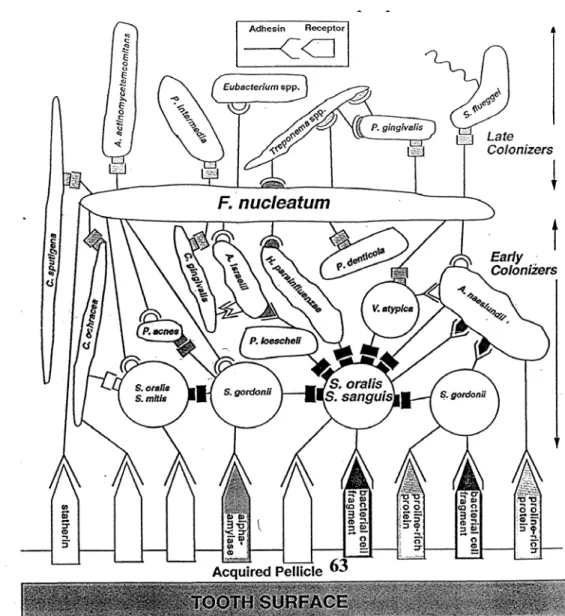
After the formation of the acquired pellicle, long range is established, i.e. >50 nm, non-specific interaction of microbial cell surfaces with the acquired pellicle via van der Waals attractive forces. Microbial homeostasis is maintained due to dynamic balance between the resident members of the microbial community.
MATERIALS AND METHODS
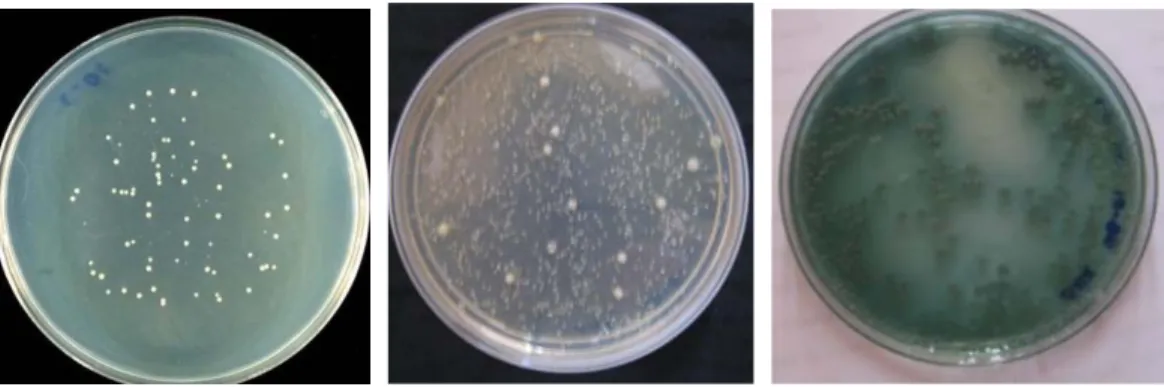
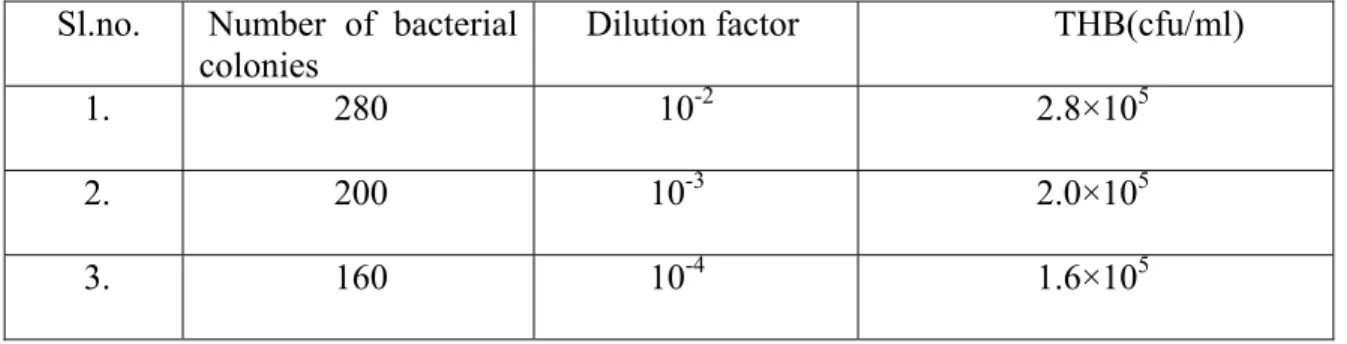
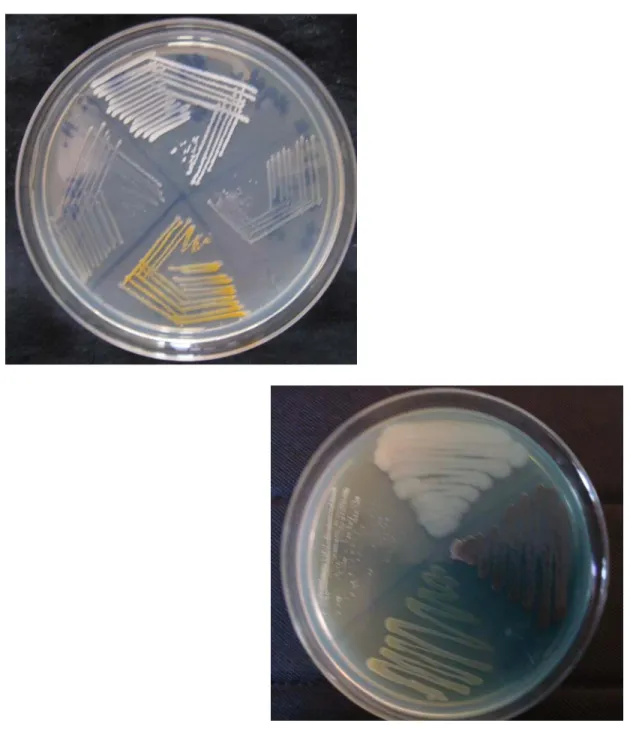
Biofilm formation was considered positive when a visible film lined the wall and bottom of the tube. Individual wells of sterile, polystyrene, 96-well flat-bottom tissue culture plates (Tarson, Kolkata, India) were filled with 200 µl aliquots of the diluted cultures, and broth only was used as a control. Each well was inoculated with 50 μl of the above inoculants by surface inoculation method and kept for inoculation at 35-37°C for 18-24 hours.
Stock solution of five sugars ie; glucose, sucrose, arabinose, fructose and xylose at a concentration of 0.1 g/ml was prepared in autoclaved water and sterilized by filtering through membrane filters with a pore size of 0.22 μm and stored at 4ºC. The stress response was studied by including different sugars in the basal media in which the bacterial strains were cultured. 1 mg/ml sugar in the basal medium was prepared for each sugar and 1980 μl of the media was inoculated with 20 μl of overnight broth culture of the bacterial strains. 200 µl of the same inoculum concentration was inoculated into 96-well microtiter plates and incubated at 37ºC for 72 hours. After incubation, the contents of the plates were removed by pressing and rinsed with phosphate buffered saline (PBS) to remove planktonic cells.
The OD of the adherent biofilm was taken using a micro ELISA autoreader (Perkin Elmer) at 570nm. Chemotactic response of the isolated bacterial strains to different sugars and xenobiotics by the plug punch method. To prepare plugs, 0.5% of the compound to be screened was added to liquid PBS hard agar kept at 50ºC, poured into petri dish and allowed to cool and solidify.
Using a sterile probe, plugs of the agar-containing compounds to be tested are picked up and pushed into the organism containing soft agar plate. 50 ml of LB broth was inoculated with 5 µl overnight broth culture of the test organism and initial OD was taken at 630 nm. A graph of absorbance vs time was plotted to obtain the growth kinetics of the organism.
100 µl each of the 1:100 dilution of the overnight stock cut of the test organisms was inoculated into 5 sets of 96-well microtiter plates and the absorbance was read using the automated ELISA reader at 570 nm at an interval of every 2 days following similar procedures coloring as described above. The TCA precipitates were washed twice with 10 ml of acetone and resuspended in 2 ml of 2-N-morpholinoethanesulfuric acid (MES) pH 5.0. Protein content was assessed using the Bradford protein assay with BSA as the calibration standard (Jaio et al, 2010). The mixture was incubated on ice for 2 h before DNA was recovered by centrifugation at 17,500 × g for 20 min at 4ºC. DNA content was measured by reading absorbance at 260 nm.
RESULTS AND DISCUSSION
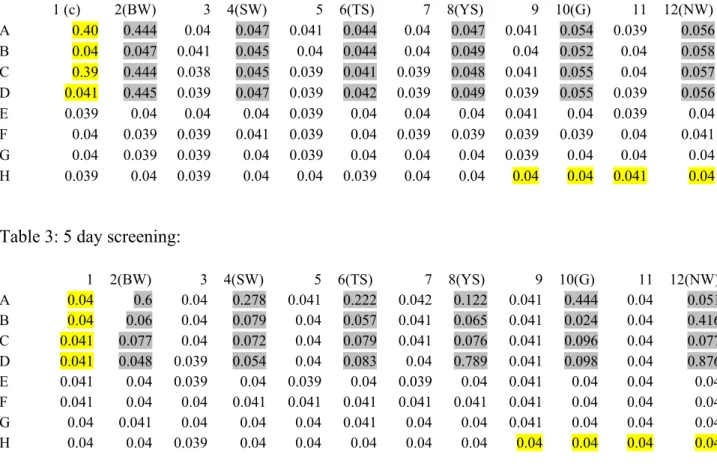
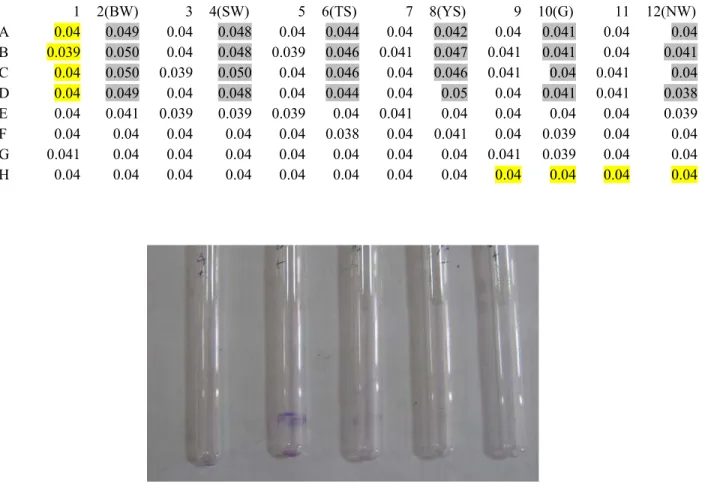
Wells in grey: show intensity of biofilm attachment Wells in yellow: control (contains media only). Glucose: Intensive biofilm formation was observed when glucose was used as the sole carbon source. Arabinose: Biofilm formation was negligible when arabinose was used as the sole carbon source (Table 8).
Raffinose: Biofilm formation was reduced when raffinose was used as the sole carbon source (Table 9). Salt stress: The intensity of biofilm formation gradually decreased with increase in salt concentration. (Table 39 pH Stress: The intensity of biofilm formation was gradually increased with a decrease in pH value. (Table 16-19, Fig 21, 22).
Moderate biofilm formation was observed at 10 ppm Zn 2+ , but at higher concentrations biofilm formation was completely inhibited. (Fig. 23 a-d, 24). Abundant biofilm formation was observed at low to high concentrations of Ca 2+ as well as Cu 2+ ions. The growth kinetics of isolated strains in the planktonic state were observed and the following trend was observed (Figs. 26-31).
Comparative analysis of biofilm formation kinetics of BW, SW, TS, YS, G and NW showed that NW secreted EPS for maximum days(10), whereas all others disintegrated after 7 days except BW, which started to disintegrate after 5 days (Figs. 33-38) ). The presence of -CH vibrations in lipids, amide I in proteins, amide II in protein and -COC group vibrations in carbohydrates, DNA and RNA are indicated by the peaks obtained at wave no. In this study, biofilm formation was checked under different stress conditions, including different sources of sugar.
Test for biofilm formation in the presence of metal salts of Iron and Zinc showed moderate to high inhibition of film formation. These results are consistent with earlier studies conducted where children in lower socioeconomic groups were fed diets supplemented with Zn salts and a reduction in plaque formation was observed. Miquel et al, 1997). However, in our present study, the inhibition of film formation in the presence of iron salts was moderate in the case of some strains, while some other strains did not form films at all.
Maximum film formation was observed in the presence of glucose and sucrose, but there was a large decrease in film formation in the presence of some very common sugars such as fructose. Almost no film was observed in the presence of less common sugars such as Xylose, Arabinose and Raffinose. This can be used as the most effective strategy in preventing biofilm formation on the tooth surface.
Evans, L. V.), Harwood Academic Publishers, Amsterdam Characterization of transposon mutants of biofilm-producing Staphylococcus epidermidis impaired in the accumulating phase of biofilm production: Genetic identification of a hexosamine-containing polysaccharide intracellular adhesion. 2006) Detection of biofilm formation among the clinical isolates of staphylococci: an evaluation of three different screening methods. 1997) Effects of iron salts in sucrose on dental caries and plaque in rats. The Effects of Initial Adhesion Events on the Physiology of Pseudomonas aeruginosa, Ph.D. Dissertation, Montana State University, Bozeman.
A comparison of five extraction methods for extracellular polymeric substances (EPS) from biofilm using three-dimensional excitation-emission matrix fluorescence spectroscopy, Water SA 36.