In the Maracherra group, 45% of the agricultural area falls under the medium-high soil suitability category, which can support crop intensification. Similar trend of significant area (>56% of TAA) under low to medium low land suitability falls in Balaram group.
INTRODUCTION
- The region at a glance
- Importance of landuse land covers change detection
- Integrated studies of LULCC, soil health and socio-economy
- Project background and objectives
Integrated analysis using these tools helps assess the direct causes of LULCC, their impact on soil health and environmental constraints/opportunities associated with human activities (soil sustainability and intensive cultivation zones) (Ehrlich et al., 1997) . The outcome of this study would give a new dimension to the initiatives in diversification of agricultural areas and intensification of crops, restoration of soil health and land productivity, food and livelihood security of the rural poor.
MATERIALS AND METHODS
Study area description
Location of the study area at Gasuapara (NAIP cluster at Sibbari), South Garo Hills, Meghalaya
- Dhalai (Tripura)
Next to the forests, the district had a significant area (9.15%) cultivated with slash and burn (shifting), while rice-based settled agriculture was practiced only on 4.55% of the area. Most of the agricultural area (86%) is under intensive monoculture systems with marginal input and low rainfall productivity.
Location of the study area at Dhalai (NAIP clusters at Maracherra and Balaram), Tripura
- Data Used
- Methodology
- Preparation of Remote Sensing data
- Land use land cover mapping
- Accuracy assessment /quality check of classification
- Spatial multi-criteria based soil suitability analysis .1 Soil sampling strategy and sample collection
- Laboratory analysis and interpretation
- Spatial mapping of attributes and soil suitability index
- Socio-economic analysis
- Integration of LULCC, soil suitability zone and socio-economy
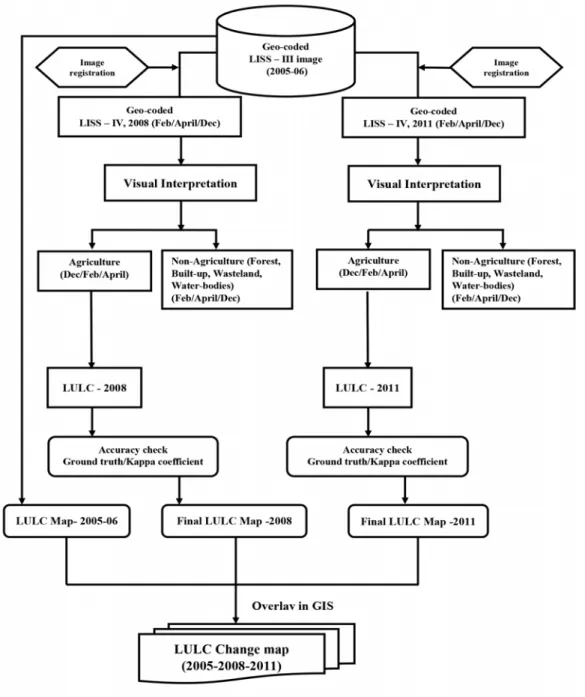
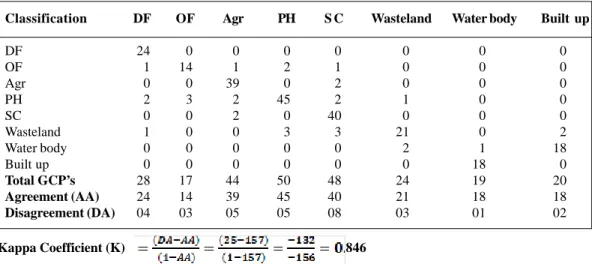
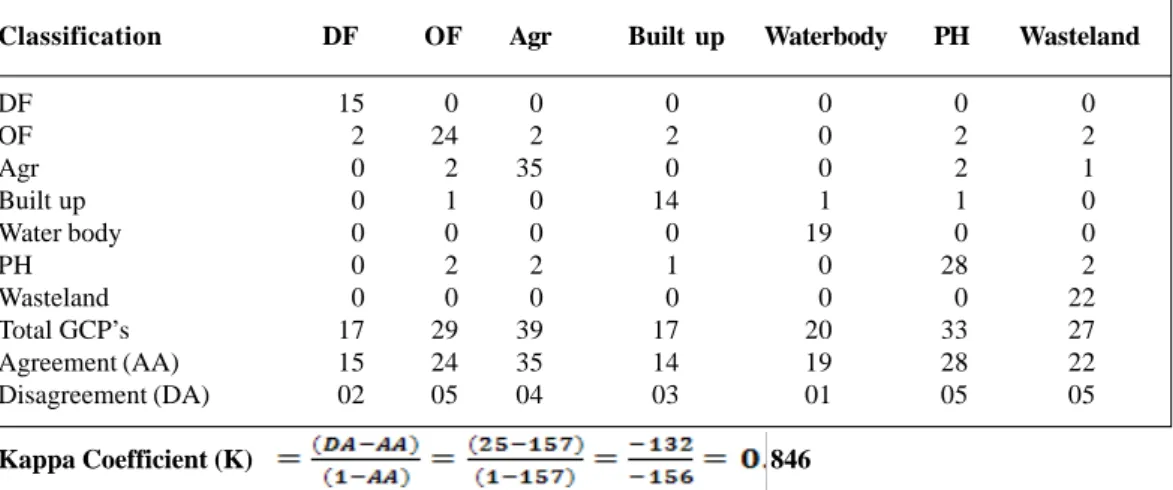
Remote Sensing Data: The objective of the study was to obtain as much information as possible about potential land cover change (LULC) before and after 5-6 years of project implementation. They are used to sort data and retrieve different thematic layers and check the accuracy of the obtained outputs. The accuracy of the generated land cover classification maps was assessed using an error/confusion matrix and KAPPA analysis (Tables 3-5).
For soil sample collection, 0.2 km x 0.2 km grids were prepared in ArcGIS and then overlaid on the land use map of the study area (Clusters-Sibbari, Balaram &. Maracherra, Maps 2-3) derived from multi-temporal LISS -IV satellite image (spatial resolution of 5.8 m) from Indian Remote Sensing Satellite (IRPS-P6) in 2008. A detailed procedure for integrating land use map, soil suitability zone and socio-economic status of the households at delineating and assessing The distribution pattern is shown in Fig.
RESULTS
- LULC classification and change detection
- Sibbari cluster, Gasuapara block, South Garo Hills
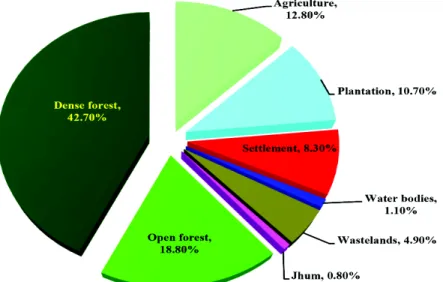
The spatial distribution of land uses during 2008 and 2011, derived from remote sensing data (IRS-P6, LISS-IV) was shown in map 4. Due to the use of relatively finer resolution satellite data (LISS IV, spatial resolution 5.8 m) during 2008 &.
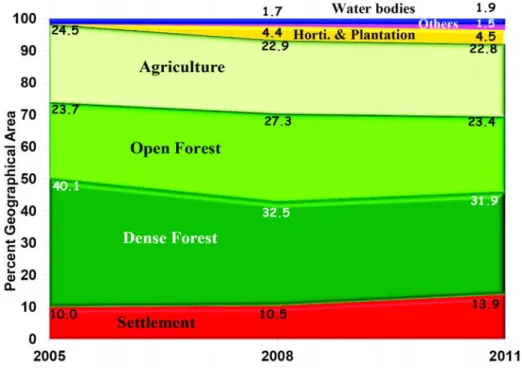
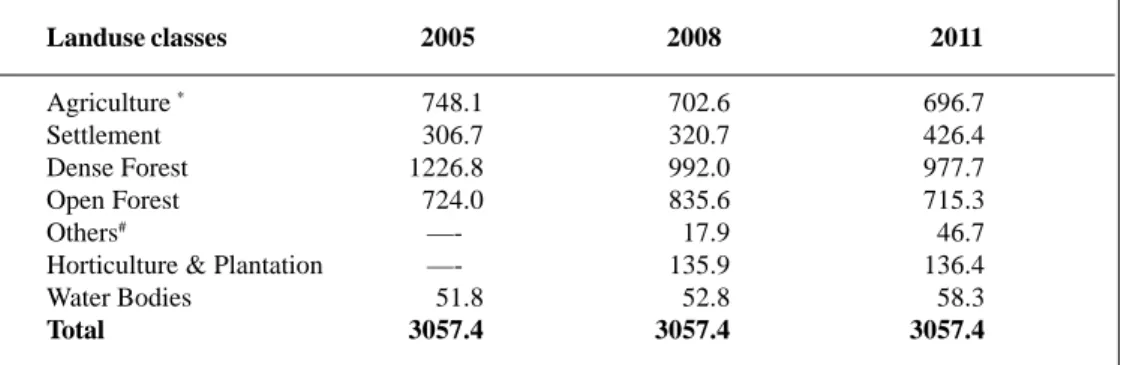
Temporal changes (2005-2008-2011) in landuse land cover derived from remote sensing data at Sibbari
- Maracherra and Balaram clusters, Dhalai, Tripura
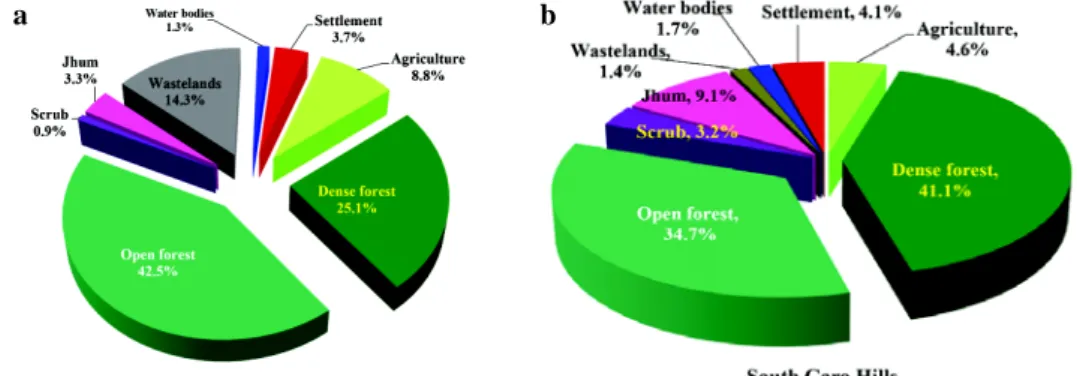
Similarly, the adoption of integrated farming systems based on horticulture and ponds during the intervention of the NAIP project (2007 onwards) resulted in a marginal increase in the area under horticulture/plantations and water bodies. The area under the integrated land use system based on horticulture and plantation has slowly expanded in the Sibbari groups. Map 5 shows the spatial distribution of land use in 2005-06 (NRSC, 2011) and 2008 obtained from remote sensing data (IRS-P6, LISS-IV) for Maracherra cluster, Dhalai.
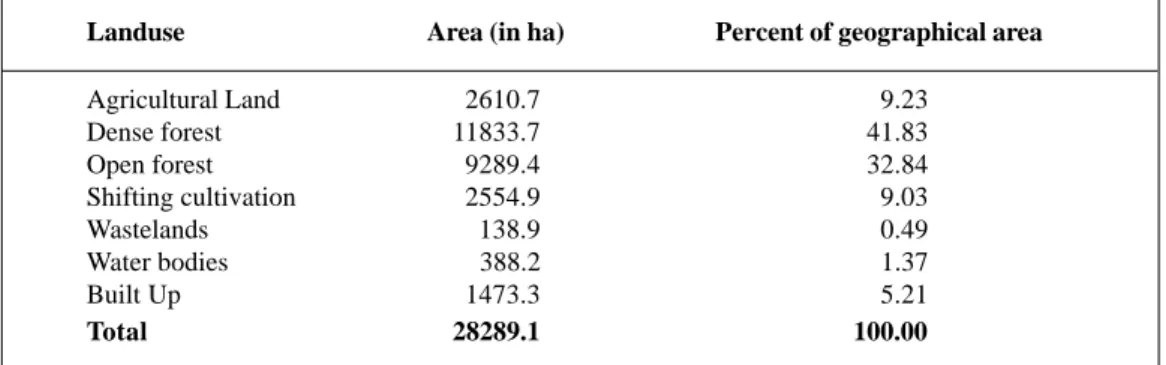
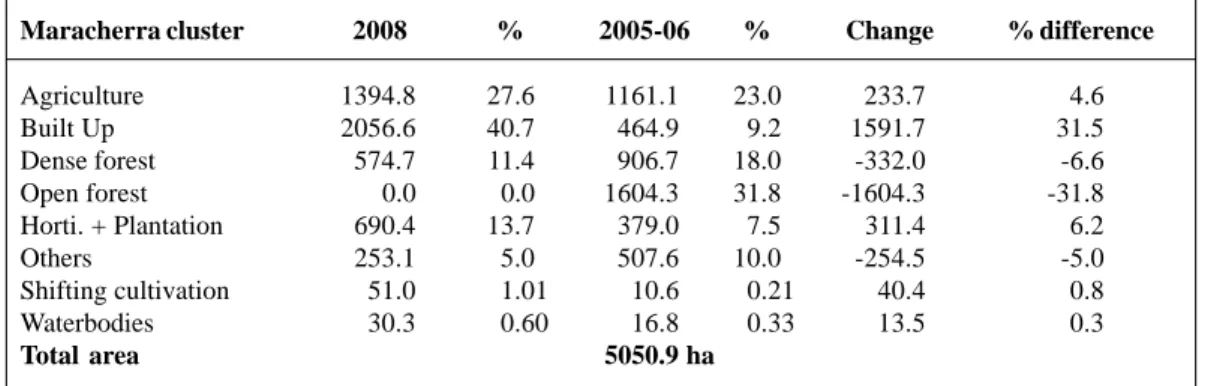
The estimated land use pattern based on remote sensing in 2005-2006 shows that among the major LULCs, open forests (31.8% of TGA), followed by settled agriculture (23%) and dense forests (18%) occupied nearly 73% TGA (Table 8). The changing areas of cultivation (0.21%) and water bodies (0.33%) were marginal, while others, mostly desert (shrubland/riverine/sand), occupied a considerable (10%) area of the cluster .
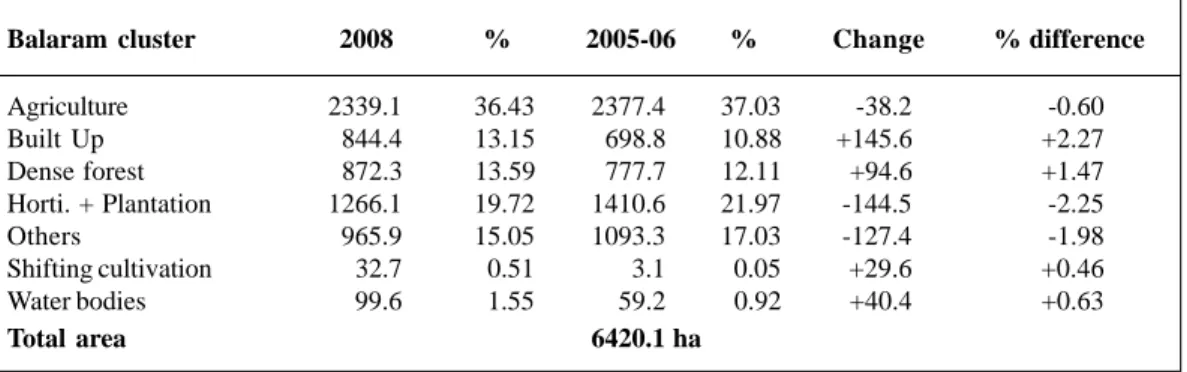
Temporal changes (2005 & 2008) in LULC derived from remote sensing data at Maracherra and Balaram clusters, Dhalai
However, due to the increase in population pressure and the subsequent increase in under-cultivated area by 31.5% of the TGA, this resulted in the complete removal of open forests, which decreased from 31.8% in 2005–2006 to almost negligible in 2008. both plantation and agricultural areas also resulted in a significant reduction in dense forests, from 18.0% (in 2005–2006) to 11.4% in 2008. The overall trend in LULC change in the Maracherra cluster was moving towards deforestation (as evidenced by the reduction of forest areas), mainly driven by population pressure, which led to an increase in settlement areas.
But with the collective efforts of NAIP as well as other line departments, there is a silver lining reflected by an increase in area under horticulture based plantation as well as a decrease in fallows. Soil physical and chemical properties were determined from geo-referenced composite samples of 150 sites at a scale of 1:10,000 representing the agricultural area (693.7 ha) of the Sibbari cluster (Table 10-12).
Spatial distribution of sand, silt and clay (in %) and soil acidity parameters across agricultural area in Sibbari cluster
Map 7 presents a sample of the spatial distribution of soil fertility status, mapped at a scale of 1:10,000 by cluster.
Spatial distribution of soil fertility parameters across agricultural area in Sibbari cluster
- Maracherra cluster, Dhalai, Tripura
Spatial distribution of soil structural properties (sand, silt and clay) and bulk density properties mapped at 1:12,500 scale in the Maracherra Cluster, Dhalai is presented in Map 8. The spatial distribution pattern of soil acidity parameters was mapped at 1:12,500 scale and were shown on map 9. In the studied area (Maracherra cluster), almost 80% of the soil in the agricultural area (TAA) was of moderately acidic reaction (pH>5.0), while the soil in 1/.
Therefore, it requires selective ameliorative measures related to soil acidity to overcome the abiotic stress caused by acidity for optimal crop growth.
Spatial distribution of sand, silt and clay (in %) across agricultural area in Maracherra cluster, Dhalai
Spatial distribution of soil acidity parameters across agricultural area in Maracherra
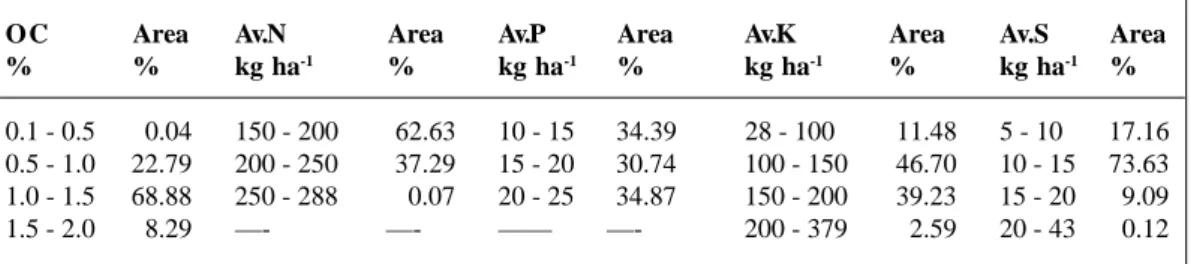
Spatial distribution of soil fertility parameters (SOC, available N, P, K & S) did not show any particular pattern and content varied spatially across clusters (Map 10).
Spatial distribution of soil macro-nutrients across Maracherra cluster, Dhalai
- Balaram cluster, Dhalai, Tripura
Generally, the soil under agricultural area in Maracherra cluster of Dhalai district was low in soil fertility status (low SOC, available N, P, K and S). Therefore, periodic supplementation of plant nutrients from both organic and inorganic sources in balanced ratio is the urgent need for maintaining crop as well as land productivity vis-à-vis soil health and food security in the region. Spatial distribution of soil separates (sand, silt and clay) and bulk density over agricultural area in Balaram cluster, Dhalai, was mapped at a scale of 1:12,500 and is presented in Map 11.
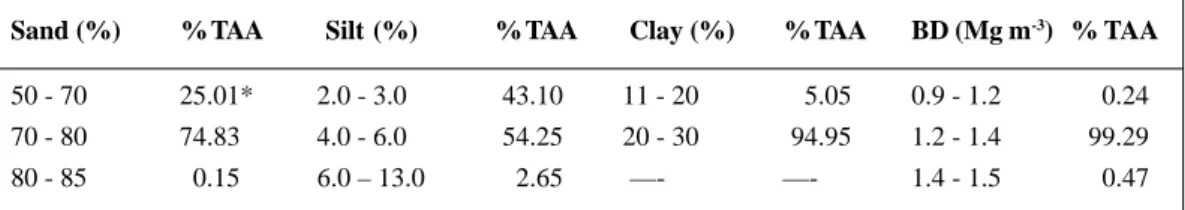
Among the soil discharges, sand was the dominant fraction, with a variation from a minimum content of 40% to as high as 90% and in 45.19% agricultural area, minimum sand content varied from 70-80% (Table 16). In the remaining 54.68% TAA, sand content varied from 40-70%. This shows that soils of the cluster were always coarser in texture with many Table 16: Distribution of soil separates and mass density over agricultural area of Balaram cluster.
Spatial distribution of soil separates and bulk density parameters across agricultural area in Balaram cluster
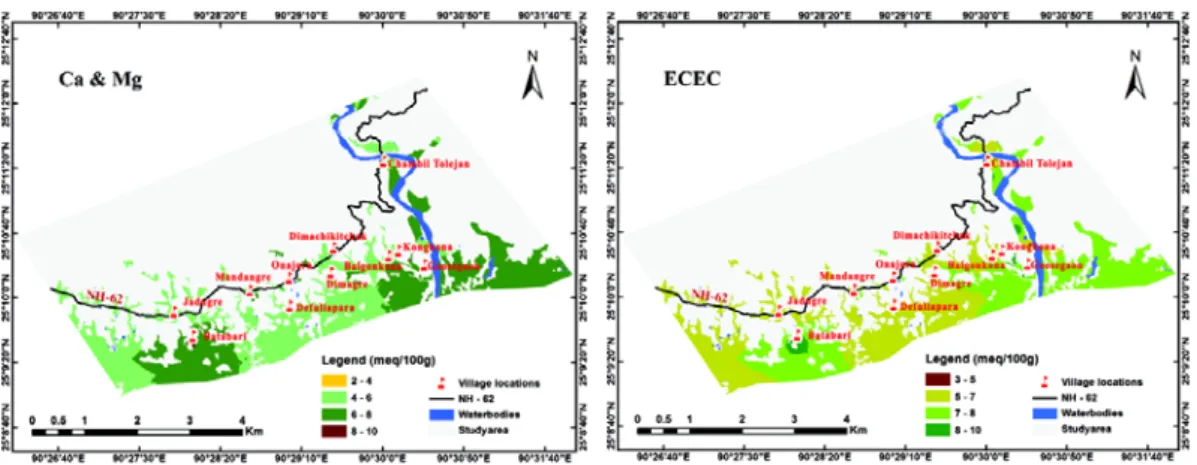
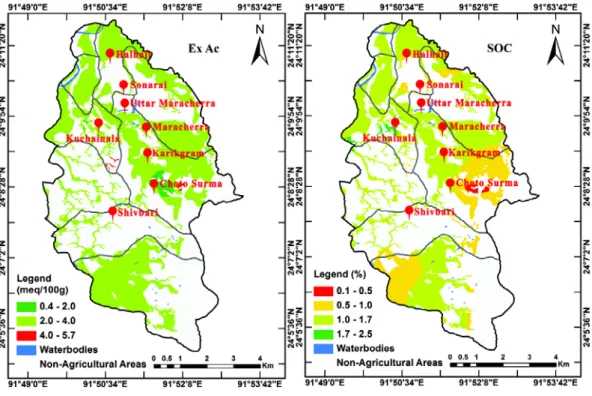
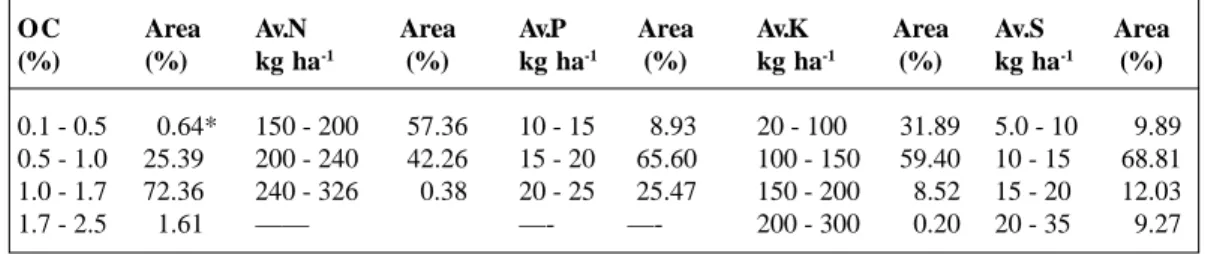
Despite strong soil acidity in much of the agricultural area (>55%) and low bases in >90% TAA, exchangeable aluminum content in more than half of the area (>56% TAA) was below the critical range (1 .0). meq/100 g soil). However, in more than 42% TAA, the level of exchangeable aluminum was above the critical range and thus site-specific soil acid-induced stress management (improvement) is required for optimal crop growth and long-term sustainability of soil health. The spatial distribution pattern of various soil fertility parameters (SOC, available N, P, K. & S) varied widely within the agricultural area of the Balaram cluster and was mapped at a scale of 1:12,500 (Map 13).
Compared to other NE states, the soils of Tripura are low in SOC content (Choudhury et al., 2013) and this is also reflected in the present study. In general, soils were mostly deficient in available phosphorus (<= 25 kg ha-1) and at >34% TAA, available phosphorus was extremely high.
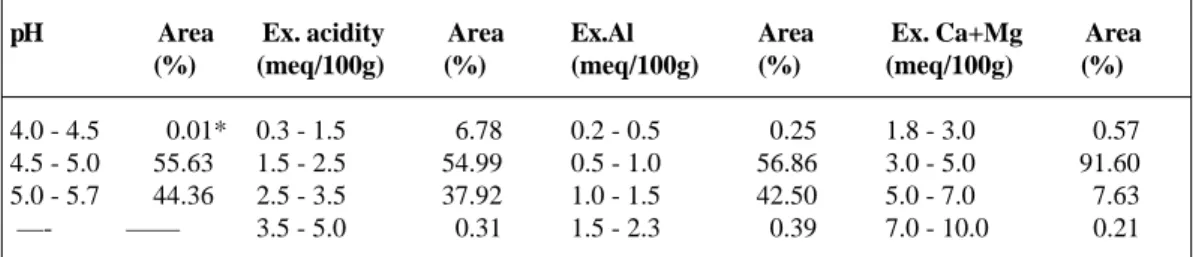
Spatial distribution of soil acidity parameters and SOC content across agricultural areas in Balaram cluster
Spatial distribution of soil fertility parameters across agricultural area in Balaram cluster
- Effect of landuse systems on soil health attributes in Sibbari cluster
- Spatial multi-criteria based soil suitability mapping
The particle size distribution reflected that the pond bed followed by the lowland plateau soils had significantly (p<0.05) finer fractions (silt and .clay) of the soil divisions than the upland soils under vegetable and plantation-horticulture (PH ) (Table 19). This may be due to the higher SOC content as well as the finer fractions (silt and clay) which offset the ponding effect on soil compaction and the subsequent increase in bulk density value was stopped. Practice Table 20: Effect of land use on soil acidity parameters in Sibbari cluster, South Garo Hills, Meghalaya.
Due to the higher SOC content, the available nitrogen (N) content was also significantly higher in lowland paddy soils. Similarly, available potassium (K) content was significantly (p<0.05) higher in lowland paddy soils compared to other land uses (Table 21).
Soil suitability zones derived from spatial multi-criteria decision-making approach for crop intensification in Sibbari cluster, South Garo Hills, Meghalaya
In the case of Sibbari cluster (South Garo Hills), of the total agricultural area (696.7 ha), areas highly suitable for crop reinforcement were negligible (<5.0% of TAA). Therefore, site-specific crop reinforcement may be a good option in these areas (spatially distributed, shown in Map 14). Soil suitability for crop intensification in the remaining 43.3% area falls under medium-low category, and can therefore support less nutrient/water depleting crops/cropping systems (such as vegetables/oilseed pulses).
Site-specific spatial distribution of suitability zones across the Maracherra Cluster was delineated and mapped at a scale of 1:12,500 (Map 15), which will succeed in adopting site-specific methods of soil health restoration. In the Maracherra cluster, more than 1/3 of the agricultural area (>37% of TAA) falls under poor soil suitability class and without any soil health restoration (external nutrient supplementation/in-situ resource conservation), these areas are not conducive to intensive crop cultivation.
Soil suitability zones derived from spatial multi-criteria decision making approach for crop intensification in Maracherra cluster, Dhalai, Tripura
Similarly, in another 16.4% agricultural area of the cluster, site-specific soil health restoration approaches must be followed to increase crop intensification as well as soil crop productivity (Table 22). However, 45% of agricultural land falls under the medium-high soil suitability category, which can support crop intensification. These areas can be utilized for crop reinforcement by growing 2-3 crops in a sequence all year round.
Spatial distribution of land suitability areas in Balaram cluster has been mapped at 1:12,500 scale (Map 16) which will facilitate improvement of reclamation/nourishment/nourishment technology for resource conservation.
Soil suitability zones derived from spatial multi-criteria decision making approach for crop intensification in Balaram cluster, Dhalai, Tripura
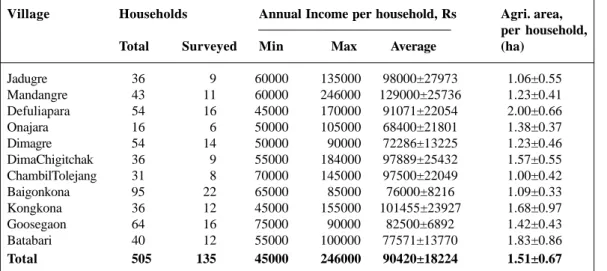
- Socio-economic status on LULC and soil health– distribution of land holding and annual house hold incomes at Sibbari cluster
By integrating spatial multi-criteria land suitability class in GIS together with geo-referenced household survey information and land ownership, we generated information on distribution of agricultural land with different land suitability classes among the three income groups: low, medium and high. In the cluster, more than 90% of the total agricultural land (696.7 ha) falls under medium-low to medium-high category land suitability zone. Majority of the low to medium-low suitability land areas belong to low income group farmers while.
More than 90% of agricultural land (198.4 ha out of 214.4 ha) of the high-income group belongs to soils with high to medium suitability for crop intensification. All this resulted in severe depletion of nutrients, deterioration of soil health and thus low soil suitability.
CONCLUSION
- In Maracherra cluster (Dhalai), total geographical area (TGA) was 5050.9 ha
- In Balaram cluster (Dhalai), total geographical area (TGA) was 6420.1 ha
- In Maracherra cluster (Dhalai), soils were invariably coarser in texture with very high sand content(70 to 80%), moderate in clay content (20-30%), moderately acidic
- In-case of Sibbari cluster, nearly 50% of the total agricultural area (696.7 ha), falls in medium-high category of soil suitability zone and can support intensive cultivation of
- In Balaram cluster, only 40.6% area falls under medium-high soil suitability class
In the case of the Sibbari cluster, almost 50% of the total agricultural area (696.7 ha) falls into the medium-high category of soil suitability zone and can support intensive cultivation into the medium-high category of soil suitability zone and can support intensive cultivation of at least two nutrient-depleted crops per year. In the Maracherra cluster, only 45% of agricultural land falls into the category of medium to high soil suitability, which can support crop intensification. However, a considerable area (>56%) falls under the low to medium soil suitability range and needs regular nutrient replenishment, integrated nutrient management, etc.
Most of the land areas with low to medium-low suitability belonged to the households of the low-income group, while the middle-income group had the main weight in the areas of medium-low to medium land suitability classes high. More than 90% of the agricultural land area (198.4 ha out of 214.4 ha) of the high income group falls in the zone of high to medium land suitability for crop intensification.