Data representation is at the heart of all machine learning algorithms, and their performance mainly depends on the characteristics or representations of the input to which machine learning algorithms can be applied. Feature engineering is a way to leverage human ingenuity and prior knowledge to compensate for the shortcomings of machine learning algorithms. By learning to represent the data, a machine learning algorithm can automatically discover discriminatory information from the input data.
Hand Crafted Feature Extraction
Although a prior knowledge of the domain can be used to extract informative features in the data, learning using a general prior can also be used. Learning to represent input data is mainly motivated by the fact that, for tasks such as classification, machine learning algorithms require data that can be represented mathematically and are computationally convenient. Features can be extracted based on local relationships in the data or based on global relationships.
Learned Representation
11] propose a spatiotemporal convolutional regression network to generate a bounding box for action localization in each frame. More efficient methods generate action localization templates by sampling bounding boxes based on supervoxels. Semi-supervised action localization approaches do not require ground-truth information for all bounding boxes in video frames.
Image Classification
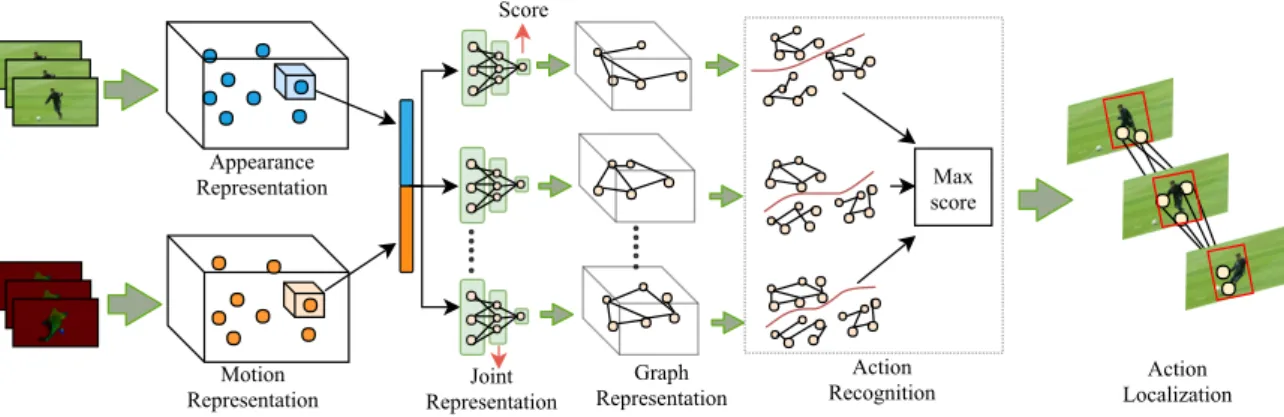
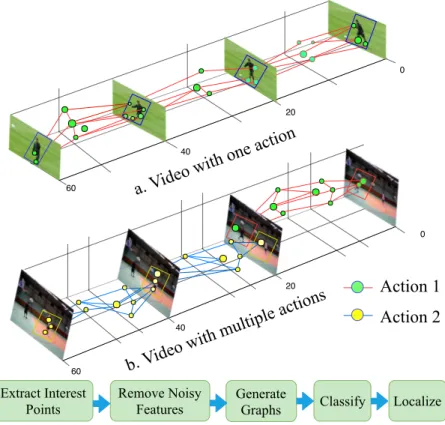
We propose an efficient way to represent an action in a video as a graph for spatiotemporal action recognition and localization in uncropped videos, using only class label information. We construct a graph by extracting key points of interest from a video clip using the Harris 3D corner detector and assign a class label same as that of the video. To classify a graph of local actions into one of the action classes, we use a support vector machine together with a graph kernel.
The experimental results show that the proposed approach outperforms the state-of-the-art methods on the three benchmark datasets, namely UCF101-24, UCF-Sports and JHMDB-21. However, most of the existing methods for action recognition and localization work offline and perform well on cropped videos [1, 3]. Most of the existing deep learning methods [4, 5, 3] also treat each frame independently and thus ignore temporal continuity (i.e. motion information) in a video clip which is crucial for the action recognition and localization.
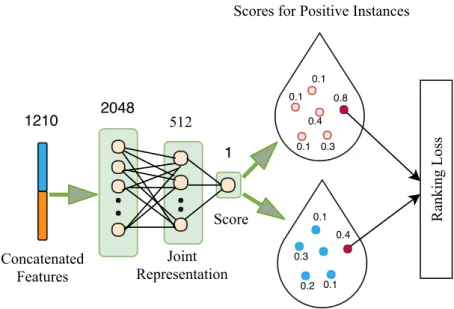
Since our graphical representation of action videos contains structural relationships between regions of interest, it helps to better recognize action in video clips. Each graph node is associated with a point that indicates the degree to which its appearance and motion support the action class of interest. Using deep unsupervised multi-instance learning (MIL) ranking model for joint representation learning and estimation of spatio-temporal salient regions using clip-level annotation.
Localization of the recognized action as non-cubic or arbitrary shaped part of the video based on nodes (ie, local interest points) in the graph.
Proposed methodology
- Extracting Interest Points
- Weakly Supervised Feature Extraction at Interest Points
- Graph Representation of an Action in a Video
- Action Recognition and Localization
Here,Lx,Ly,andLz are the partial derivatives with respect tox,y,etc of the linear scale-space representationL:R2×R×R2+ →Rof f constructed by convolution with a Gaussian kernel g(.;σ2l, τl2) with local scalesσl2 (spatial variance) and τl2 (temporal variance). So, we assigned the label of the video clip to all its local action vectors. To keep the count of the features in F∗ away from the count of the features in F+, we use the hing-loss function.
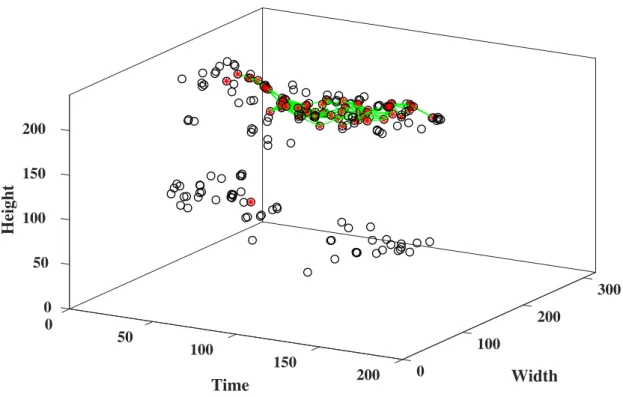
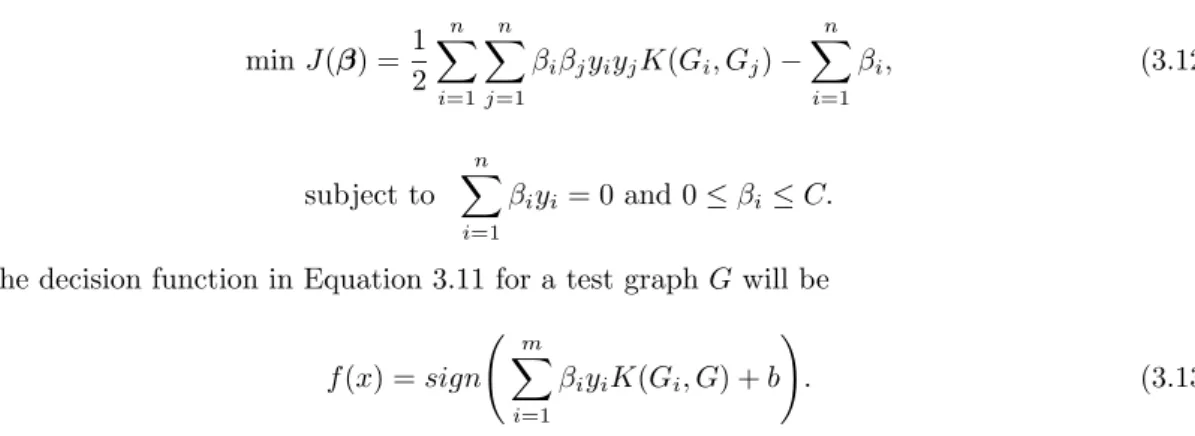
After representing an action in a video as a graph, we classify the graphs into one of the action classes. We train a binary max-margin classifier using the graphs for a certain action category by labeling them as positive class and the rest of the graphs are labeled as negative class. The pipe shape graph connecting the red stars with a green line [—] is the generated graph used for recognizing and localizing the action in this video.
Thelthpower of the adjacency matrix of the resultant graph obtained by direct product gives us the number of total walks. After the successful recognition of a class of actions, the next goal is the localization of the recognized action in space and time. To do this, we take the union of the spatiotemporal regions near each node in the graph that represents the action in the video clip.
Since the ground truths provided for standard datasets are of actors rather than action, we use SSD [9], a CNN-based object detector for detecting persons in those regions of each frame where there is a node in the graph in order to render a pipe with bounding boxes that locate actors playing action across video frames.
Experiments
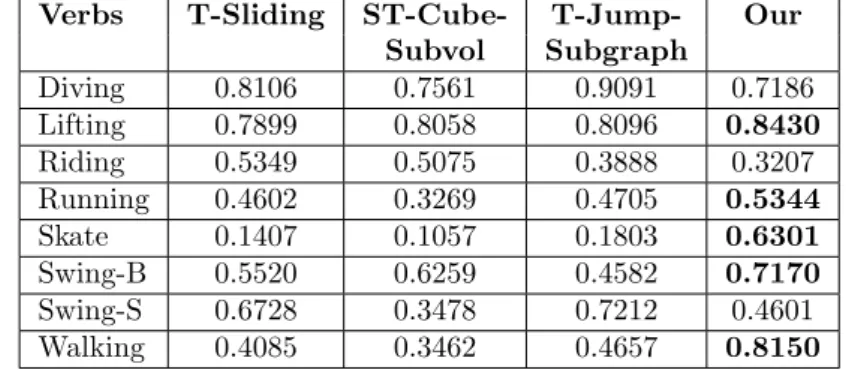
So equation (3.12) can be solved for the graphs constructed from the training videos for each action and using this and solving 3.13 gives the decision for a test video. The results in the table below show that our proposed method outperforms the existing approaches such as T−Sliding,ST−Cube−subvol,T−Subgraph and T−J umb−Subgraph in terms of correctly recognizing each individual action. This improvement in action recognition ability is due to the ability of a labeled graph generated from the joint representation of local features, which is free from the curse of intra-class variability and inter-class similarity .
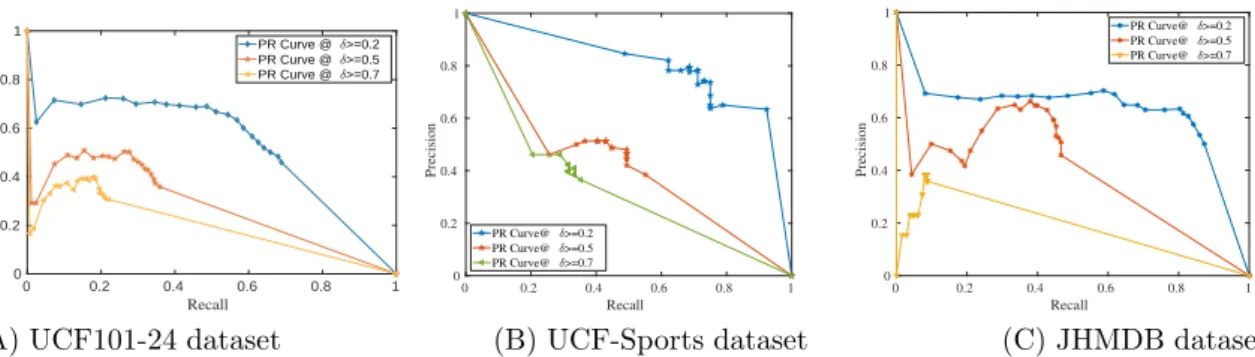
The high area under the curve shows the better recognition and efficient localization of the action in space and time. The consistent performance on all three datasets demonstrates the generalization ability of the proposed approach. The mAP for the proposed approach outperforms all existing weakly supervised approaches and achieves comparable performance to the supervised approaches.
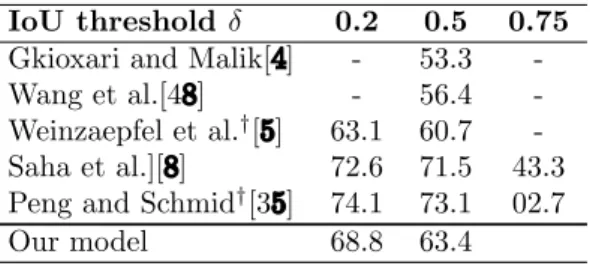
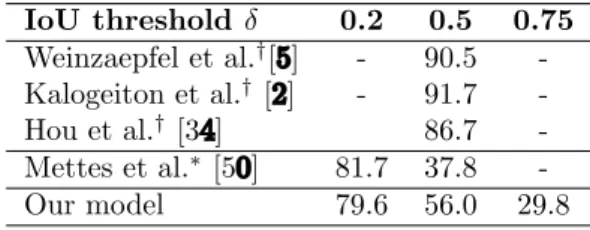
The reason for the success of the proposed approach in spatio-temporal localization of actions compared to existing approaches is the inclusion of the MIL classification framework to calculate the action score and the joint presentation of appearance and information at carefully selected important points. . Comparison of the experimental results of the proposed approach with state-of-the-art approaches on three challenging action localization benchmark datasets confirms the superiority of the proposed approach for both action recognition and action localization with only class label annotations. 3.8 and 3.9 provide a detailed comparison of the proposed approach with some existing fully supervised approaches, showing the trade-off between recall and IoU at multiple thresholds for the UCF101-24 and UCF-Sports datasets, respectively.
Although our approach is weakly supervised, our proposed method achieves comparable performance to fully supervised approaches.
Conclusion
GrAB : Grouped Attention Block for compact CNNs
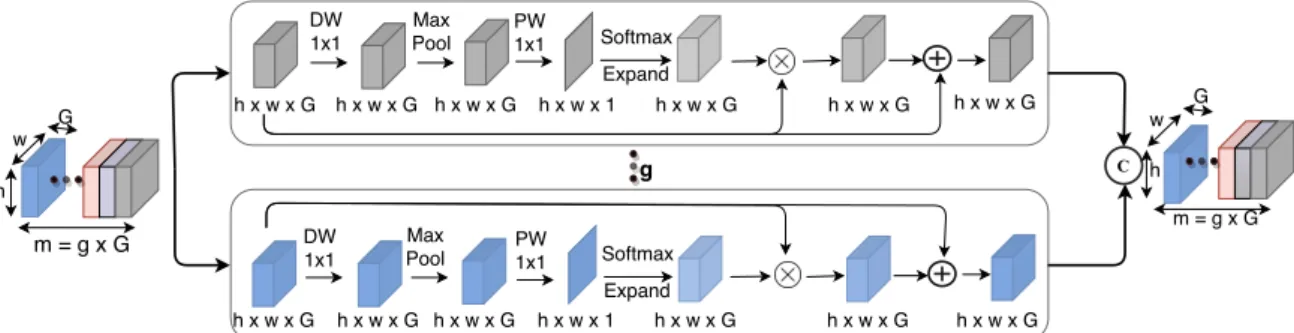
Our goal is to learn to capture the cross-channel interdependencies in the feature maps without incurring significant parameter and computational costs. As shown in Figure 4.2, GrAB divides the input function maps (F) into g mutually exclusive groups [F1, F2, ..Fn˜, ..Fg], where each group has G function maps. 4.1, maxpool3×3,1 is maxpool with kernel size = 3×3 and padding = 1, DW1×1 is depth-wise convolution with kernel size = 1×1, P W1 is pointwise convolution with only one filter, and An˜ is an attention map derived of a group of intermediate feature maps (F˜n).
Attention map (An˜) in each group (subspace) captures the nonlinear dependencies between the feature maps by learning to collect cross-channel information. After the feature redistribution (in Eq. 4.2), each group of feature maps is given the refined set of feature maps (ˆFn˜). The final output of GrAB (ˆF) is obtained by merging the feature maps of each group (Equation 4.3).
Each attention map is capable of capturing the cross-channel information from the feature maps in their respective groups. We note that binning the feature maps into clusters does not incur additional parameter and computational overhead, while learning better cross-channel information. To keep the model simple and desirable for compact CNNs, we avoid intelligent partitioning of feature maps into groups.
Also, it is worth noting that embedding feature maps into groups does not introduce additional parameter and computational overhead during better cross-channel information learning.
Subspace Attention Pooling
From the above discussion, it is clear that better inter-channel information interaction can be achieved when 1< g < and this intuition is confirmed by the experimental results shown in Table 4.2 and Table 4.8. In other words, the amount of calculation and the number of parameters are constant for a given number of channels (m) regardless of the number of formed groups (g). This clustering method allows the network to capture spatial relationships in feature maps.
The merged features are then passed through a multi-layer perceptron that transmits the spatial information from each subspace. The final set of feature maps is obtained by the Gscale(.) operation that distributes the spatial information among the feature maps.
Experimental Evaluation
MobileNet-V1 + GrAB
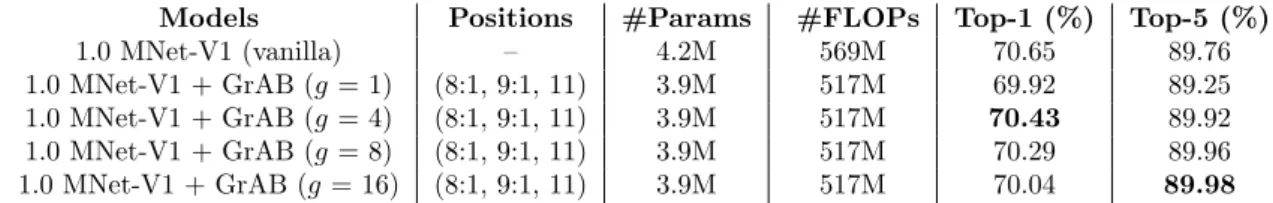
Experiments on ImageNet-1k: We conduct experiments on ImageNet-1K dataset with cluster size 1,4,8,16 and find that our model achieves 70.43% accuracy with cluster size 4. We train MobileNet-V1 for 90 epochs with size 128 package and use the SGD optimizer with the 0.9 boot. Using three GrAB blocks, we achieve a 9.2% and 6.4% reduction in FLOPs and parameters (respectively) with only a 0.22% drop in top-1 accuracy.
The reason is that the number of channels in each group decreases as we increase the number of groups, which hampers the exchange of information across channels. We also perform experiments on scaled version of MobileNet-V1 architecture, where the number of filters in each layer is scaled down by a factor (width multiplier)α, whereα. This happens due to the fact that the scaled version of MobileNet-V1 already has few feature maps, which are further divided into groups and lead to less number of feature maps per group, as happened in the case of g= 4, so that much less information enters the group.
In Table 4.4, we see that the top-1 accuracy of MobileNet-V1 integrated with GrAB is lower than that of the base network, while the top-5 accuracy is higher than the baseline (except g= 1). This implies that misclassification leading to lower top-1 accuracy is correctly predicted in top-5 predictions by the integrated GrAB network. Fine-grained classification: Fine-grained classification is a major challenge due to the high similarity between classes and the significant variation within the classes.
MobileNet-V2 + GrAB
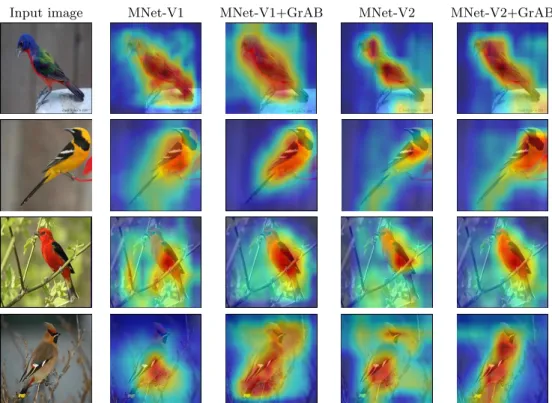
Attention visualization
Efficient Activity Detection in Uncropped Video with Max-Subgraph Search.IEEE Transactions on Pattern Analysis and Machine Intelligence. In Proceedings of the 32nd International Conference on Machine Learning, Volume 37 of Proceedings of Machine Learning Research.