I have conformed to the standards and guidelines of the Institute's Code of Ethics. I am grateful to the head of the Department of Electronics and Electrical Engineering for providing me with every facility to carry out my research work.
Introduction
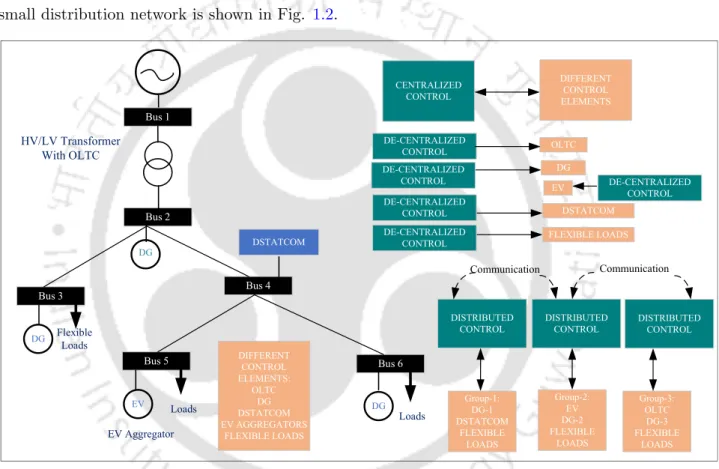
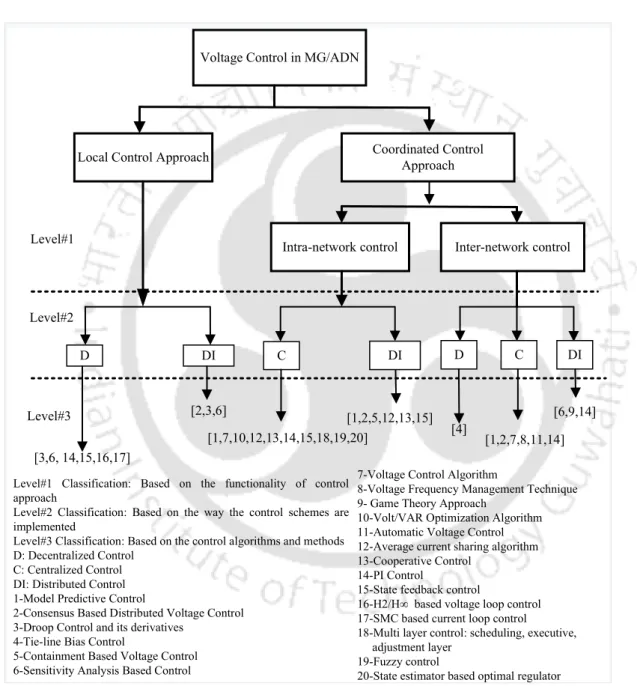
Further, the multi-layer control structure is restructured to a multi-level hierarchy where decentralized and distributed control schemes occupy local level control [7,13]. The choice of control structure varies depending on the type of microgrid (residential, commercial or military) and its legal and physical characteristics (location, ownership, size and topology) [2].
Literature review
The Level #2 further classifies the Level #1 classification based on the manner of implementation of the control approach. Despite several advantages imposed by optimization-based voltage control approaches, several authors opt for non-optimization-based approaches [11,23–25] .
Motivations behind the thesis
In this context, this study proposes a rule-based MPC (RBMPC) approach to optimally coordinate different control actions to maintain voltages within the prescribed limits, as well as to minimize energy losses in the presence of PV units. However, management of line congestion in the presence of DERs (PV and EV) in the coordinated voltage control framework has not been considered in recent works.
Organization of the thesis
Furthermore, recent DER integration standards (the IEEE 1547 standard) suggest the implementation of local characteristics in the DERs to absorb/supply the reactive power. In this context, the local-level controller is incorporated together with the upper-level control structure that adjusts the reactive power setpoints of PV and EV inverters obtained from the upper-level controller.
Contributions of the thesis
In addition, DR is enabled in the third phase of the MPC-based framework through price-based and incentive-based mechanisms. Although the reactive power capacity of the DG units with inverter is examined, power variations in DG units and the load during the day are not taken into account in [14].
Active distribution network modelling
Coordinated control of OLTC and PV inverters utilizing MPC to regulate voltages
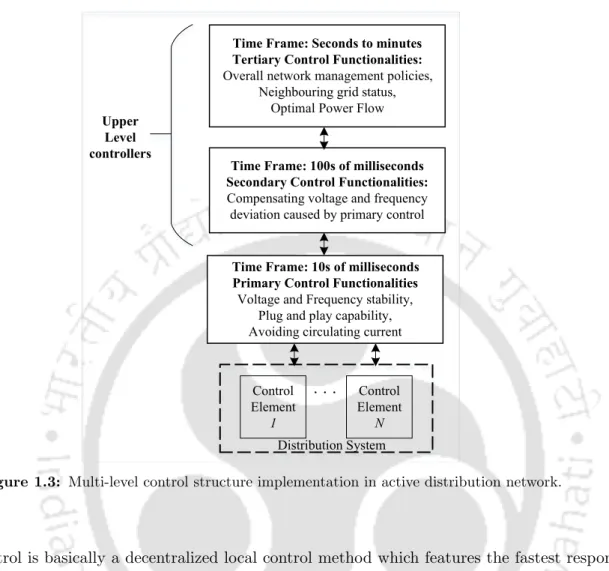
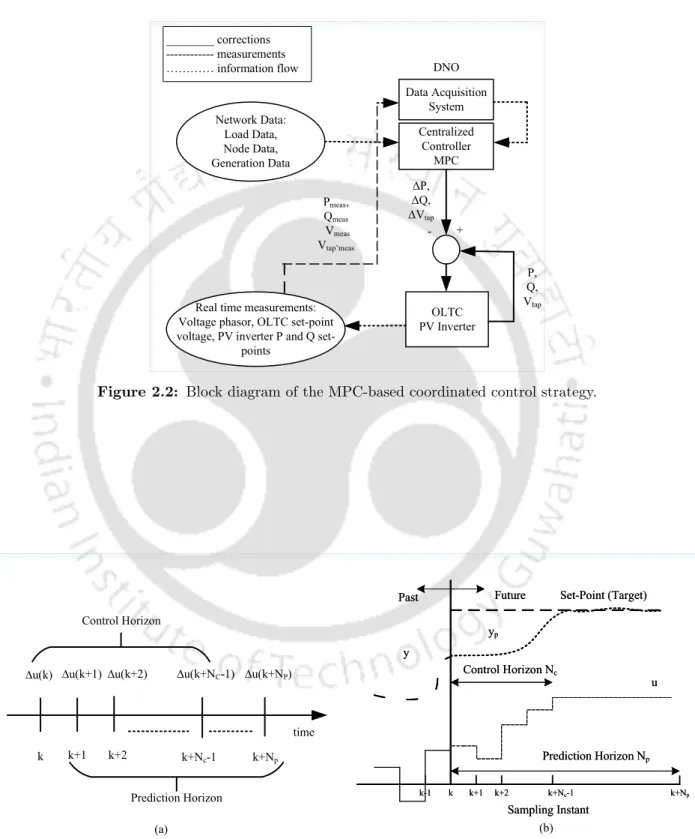
Operating principles of MPC
If the sampling time,ts, is 10 seconds and the control and prediction horizons are both equal to 3, then at each sampling time a sequence of control actions, [∆u(k), ∆u(k+ 1), ∆u(k+ 2) ] is calculated so that the predicted outputs, [yP(k+1),yP(k+2),yP(k+3)] reach the set point as shown in Fig. elements due to latency take some time to put the control actions into practice.
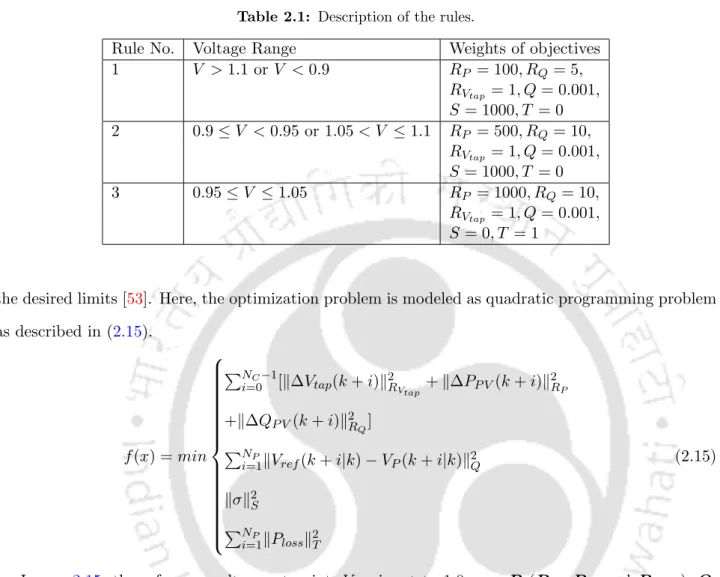
Problem formulation
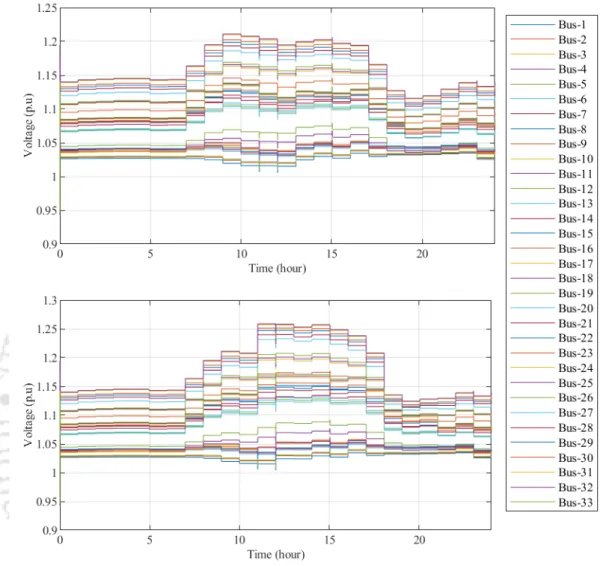
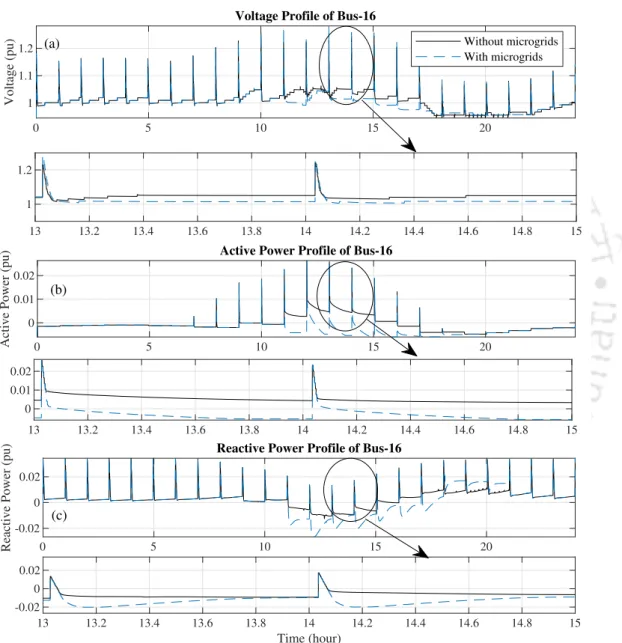
Prediction matrices are formulated with the help of the calculated set of optimal control actions. The increase in bus voltages is due to the high penetration of PV during the day. Since PV power output is a function of solar radiation, voltages are within desired limits most of the time.
Simulation results and analysis
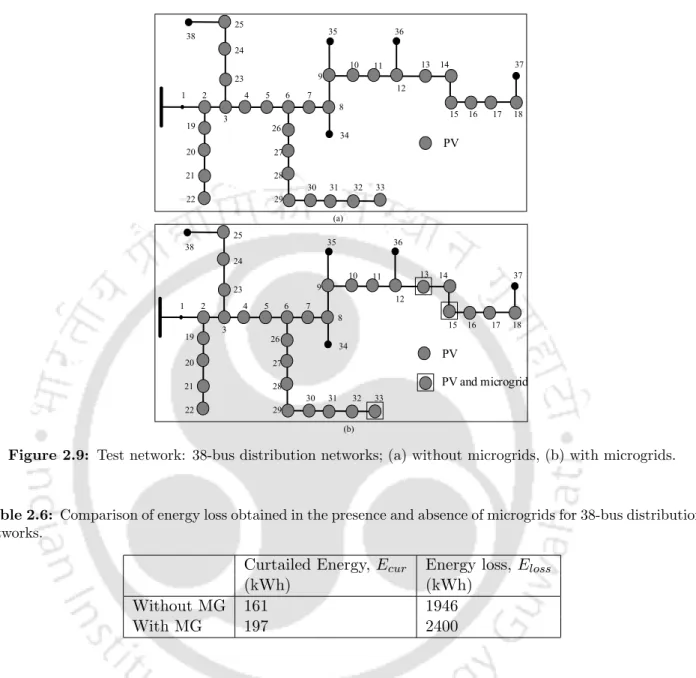
Validation of the Proposed Method in 38-bus distribution networks
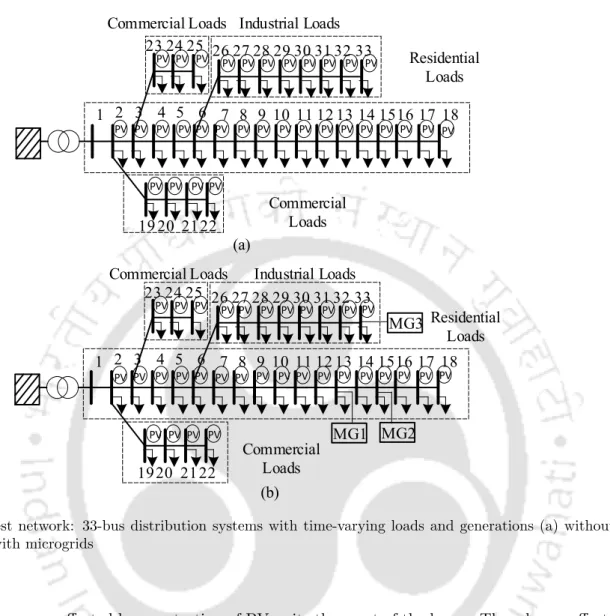
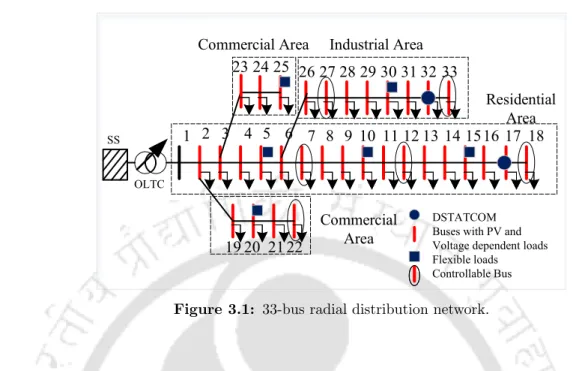
The test network with the accommodation of PV units, microgrids and loads is shown in Fig. The placement of PV plants, microgrids and loads are kept the same as in 33-bus distribution networks. Similarly, active and reactive PV powers change dynamically throughout the day depending on changes in loads and generation.
Conclusion
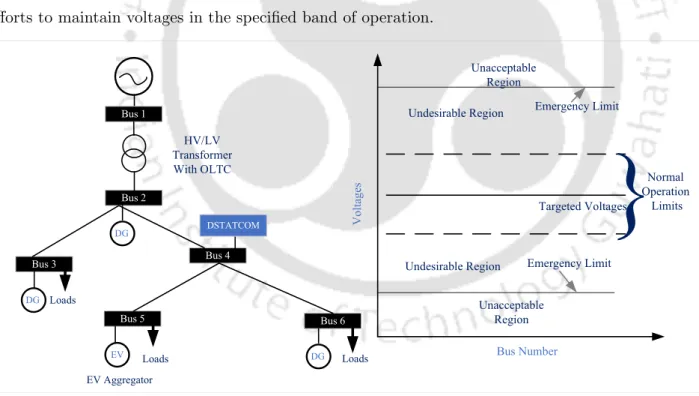
Model Predictive Control-Based Coordinated Voltage Control in Active Distribution Networks Incorporating CVR and DR. Furthermore, the two functions of active distribution management system (ADMS): demand response (DR) and conservation voltage reduction (CVR) are investigated in this voltage control methodology to improve the energy efficiency of the distribution networks. A voltage control strategy has been developed in [43] using OLTC and distribution static synchronous compensator (DSTATCOM) in an ADN.
System description
The remainder of this work is organized as follows: Section 3.2 describes the system examined in this chapter. QmL =Qm,nomL Vm(t)CV Rg(kV Ar),∀m∈ΩV DL (3.3) For the DR scheme, certain loads of the network are modeled as flexible loads. The purpose of the DR scheme in this work is to shift active power demand based on voltage magnitudes and the real-time price of electricity.
Voltage control model for ADN
The optimal plan to be implemented at each sampling point k k+Nc−1 is the solution to the MPC problem. These matrices are further used to represent the objective problem in standard programming form. The sensitivity matrices of the voltage sensitivity model, δV /δu are calculated by the inversion of the Jacobian matrix.
Problem formulation
Model of coordinated voltage control based on predictive control in active distribution networks involving CVR and DR. 3.9) presents the constraints on the manipulated variables or inputs of the MPC-based model. Inputs vary by operation phase. 3.10) describes the limits on the ramp movements of the manipulated variables. The voltage magnitudes as well as the power demand at each sampling point are the states and output of the DR-equipped MPC model, i.e., y = [V(k+i|k), E(k+i|k)].
Results and analysis
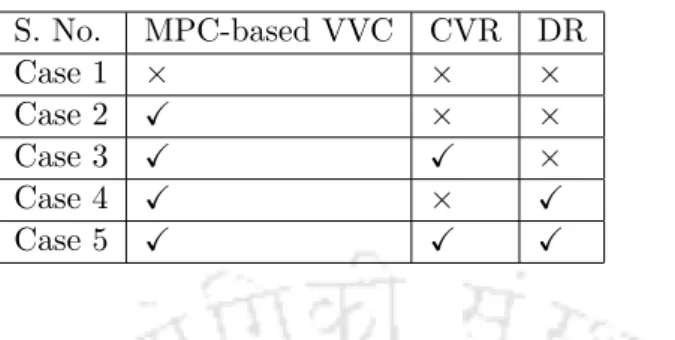
- Voltage profile analysis for different Cases
- Energy loss and energy consumption for different Cases
- Effect of smart inverters in CVR operation
- Effect of timescale decomposition of voltage control devices
- Validation of proposed method in 38-bus distribution networks
The voltage profile of bus-18 exhibits the highest voltage drop for all scenarios and is therefore considered for analysis. When CVR is used in case 3, the voltage magnitudes remain at the lower end of the defined limits. However, the CVR technique in case 5 keeps the voltage magnitudes at the lower end of the desired voltage level.
Conclusion
The proposed scheme works on rule-based model predictive control (RBMPC) to optimally manage the settings of the regulating devices, i.e. OLTC, DSTATCOM, PV generators and EV inverters which have different temporal characteristics. The proposed MPC-based control scheme optimally coordinates the volt/var devices (EVCS, PV inverters, OLTC and DSTATCOM) with different temporal characteristics to control the voltage profile of the network, while performing congestion management. Perform sensitivity analysis to confirm the effectiveness of the coordinated MPC approach.
Active distribution network modeling
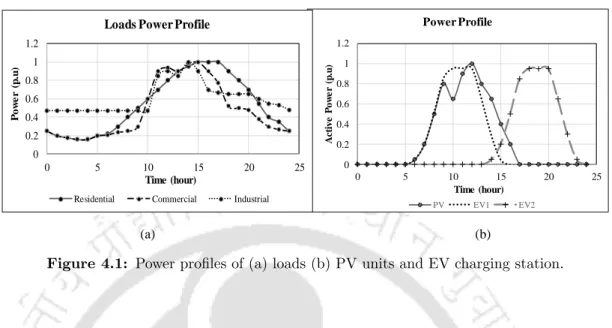
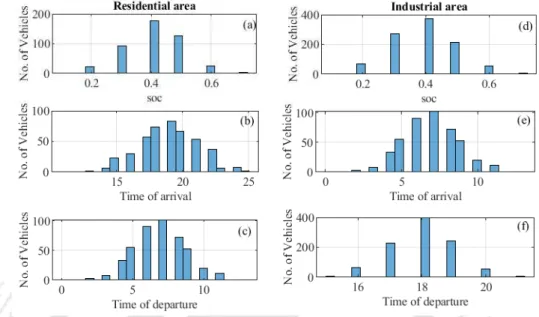
EVCS charging power profiles located in industrial [20] and residential [78] areas of the distribution network are shown in Fig. Reactive power support is one of the vehicle-to-grid services EVs provide to the grid. The profiles of the number of vehicles arriving at the charging station in industrial and residential areas are shown in the figure.
Proposed voltage control approach
Problem formulation
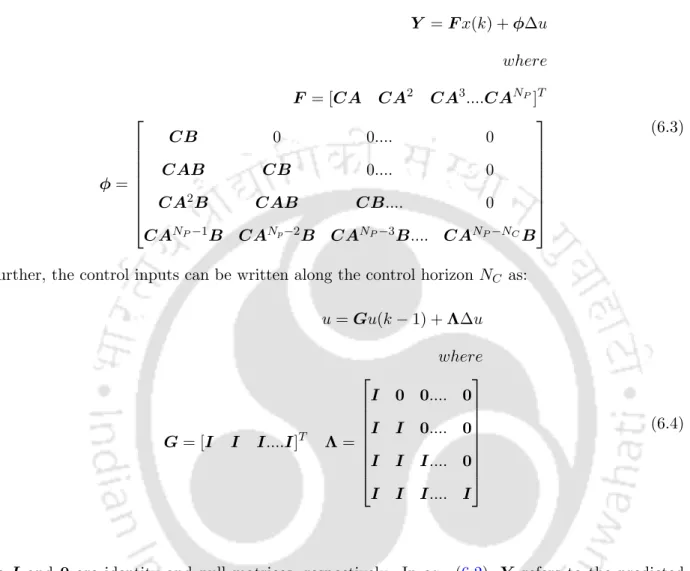
The length of the forecast horizon, NP, is generally equal to or greater than the length of the control horizon, NC. Further, the inputs in a control horizon are written in terms of the previous input and change in input as in equations. In addition, the output weighting matrix is chosen so that the voltage magnitudes of the buses connected to the charging stations reach 1 p.u.
Simulation results and analysis
- Performance analysis of the proposed approach considering placement of EV
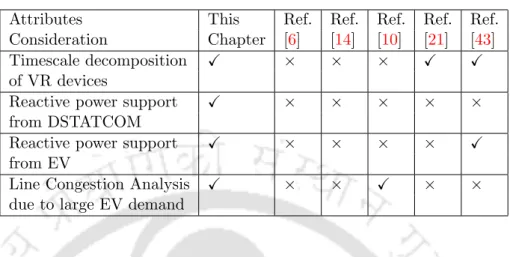
- Comparative analysis
- Sensitivity analysis
- Performance of the proposed control scheme in 38-bus distribution system
In Case C, the proposed approach is investigated with EV charging stations in both the industrial area and the residential area. This subsection compares the performance of the proposed approach with RBMPC and MPC approaches reported in [14]. It should be noted that the LCR of line 24 is less than 1 in the proposed approach.
Conclusion
Background and motivation
This led to a significant increase in the installed capacity of PV generators and the number of EV in the ADN [27]. Consequently, the integration of intermittent renewable-based DG units and uncoordinated charging of EVs have complicated the operation and planning of DNs. The voltage regulation problem is one of the serious concerns arising from the integration of DG units and the uncontrolled charging of EVs.
Literature review
In this work, both the real and reactive power of EVs and PVs will be coordinated together with the reference voltage of the OLTC in a centralized manner. Therefore, a three-stage coordinated voltage control scheme based on MPC principles has been proposed in this chapter to efficiently utilize the multiple devices with different temporal characteristics. Moreover, the satisfaction of the EV user (in terms of the desired SoC at the time of departure) is ensured with the coordinated operation of the control units.
Contributions of this chapter
System description
5.1 (a), (b), and (c) represent the SoC of electric vehicles at the arrival time, turn-on time, and turn-off time of electric vehicles in a residential area. The time of arrival and departure of the largest number of EVs in the industrial area is 9:00 AM. Similarly, the departure time data for residential electric vehicles, the arrival and departure of electric vehicles in an industrial area are generated from the mean and standard deviation data.
Proposed control scheme
Problem formulation
The objective function to be minimized in the third stage is a linear programming problem with economic considerations. These variables are severely penalized by the penalty variable py. 5.19) is the similarity constraint that describes how the SoC of the EV battery is updated at each sampling instant. This is the plant model for MPC and is thus handled at each sampling time.
Local level control
Slack variables, µ are added to OV with the aim of softening the constraint to reduce the possibility of infeasibility. Achieving the final SoC with all EVs at the time of departure is one of the important constraints to be met. Bcapmax}, soclow] (5.21) Here, soclow is limited to 0.2 due to physical considerations of the EV battery.
Results and discussions
- Performance analysis for different types of charging
- Performance analysis during two extreme scenarios
- Performance analysis for different EV penetration
- Validation of the proposed approach in 38-bus distribution networks
- Comparison of execution times for 33-bus and 38-bus distribution networks
The performance of the proposed control method with Type I and Type II loading is tabulated in table 5.3. Nevertheless, the performance with Type I loading is found to be poor compared to Type II loading. To measure the performance of the proposed approach, computation times of the proposed approach are evaluated for both the test networks with Type I loading and Type II loading.
Conclusions
Background and motivation
With the increasing penetration of DG units in the distribution networks, the transformation from passive to active distribution networks has become apparent. The bi-directional power flow in the network poses several challenges to the network operators, such as increasing power loss, power quality issues, voltage and line congestion, to name a few. The traditional voltage control devices have been used exclusively or in combination with the fast control devices in the literature [27].
Related works
Receding Horizon Control for voltage regulation of active distribution networks by scheduling electric vehicle charging based on aggregators' profits. In [30], EV charging planning was carried out to shape the load curve in residential areas. Although these aforementioned works have achieved the goal of voltage regulation with charge scheduling schemes, it should be noted that coordination with other volt/var devices (OLTC, DSTATCOM, PV inverters) is lacking.
Contributions and organization of the chapter
So, sticking to centralized techniques, several authors have developed a centralized control structure that coordinates both traditional and smart inverter-interfaced devices for voltage regulation in different time scales [14,21]. An optimal coordinated control strategy has been developed in [20] to maximize the EV demand while maintaining the desired voltage levels, minimizing current limitation from DG units and OLTC operation. Several authors have further developed fee scheduling algorithms considering EVA's profit and EV users' charging requirements and costs [82,89,90].
System model
Daily energy consumption by EV owners will be in accordance with the agreement signed between EVA and EV users. According to the agreement, EV owners submit their data (battery capacity, initial SoC, all-electric range, SoC requirements and their parking time, (tpark) to EVA upon their arrival at EVCS. EVA then calculates the energy required by every EV owner and further optimizes the charging schedule.
Receding horizon based voltage control framework
6.2), Y refers to the predicted output vector and is the change in the predicted control input vector. While the first value is applied to the system at the next moment, the other values are discarded. Thus, at the next sampling moment, a new control sequence is obtained again, which indicates the principle of the receding horizon.
Problem formulation
Upper level control
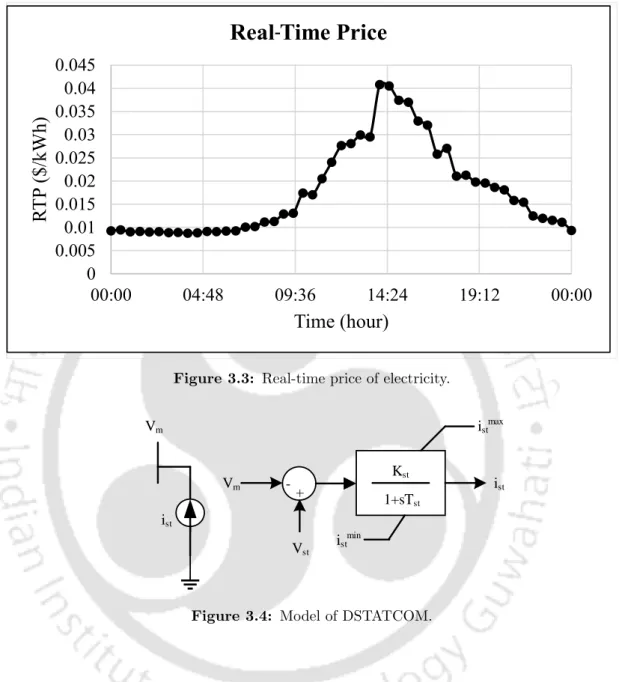
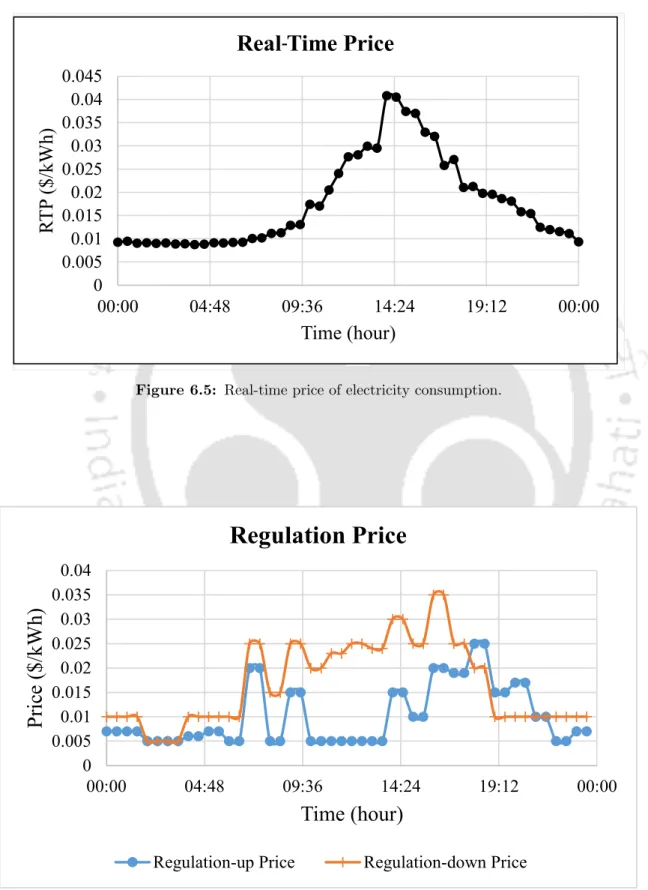
Considering the dependence of charging/discharging events on the half-hourly real-time price of electricity and ancillary services, active power setpoint of EV [PEV(k)] is the input for the third phase. The purchase price of energy is the real-time price (RTP) offered by DNO, as shown in Fig. RT P1 is the selling price of electricity through EVA to the EV users for charging through demand response (DR).
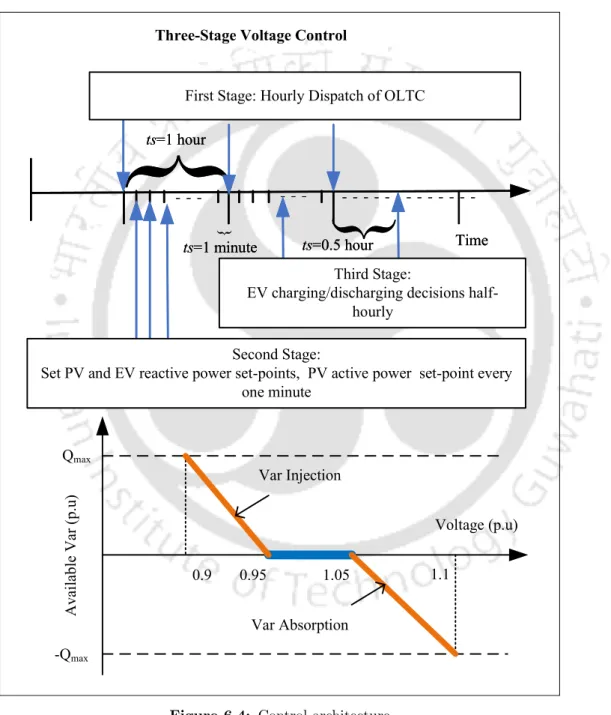
Lower level control
Furthermore, each EVs' SoC will reach the desired SoC by the departure time, td, which is referred to as EV user's constraint. In order to achieve the desired SoC, the lower bound constraint,socmin(k) of eq. 6.16) must be updated at each sampling instant.
Numerical results
Implementation and test network
Simulation results and analysis
- Technical aspects of the proposed control method
- Economical aspects of the proposed control method
- DR analysis
- Cost-economic analysis
- Validation of the proposed approach in 38-bus distribution networks . 138
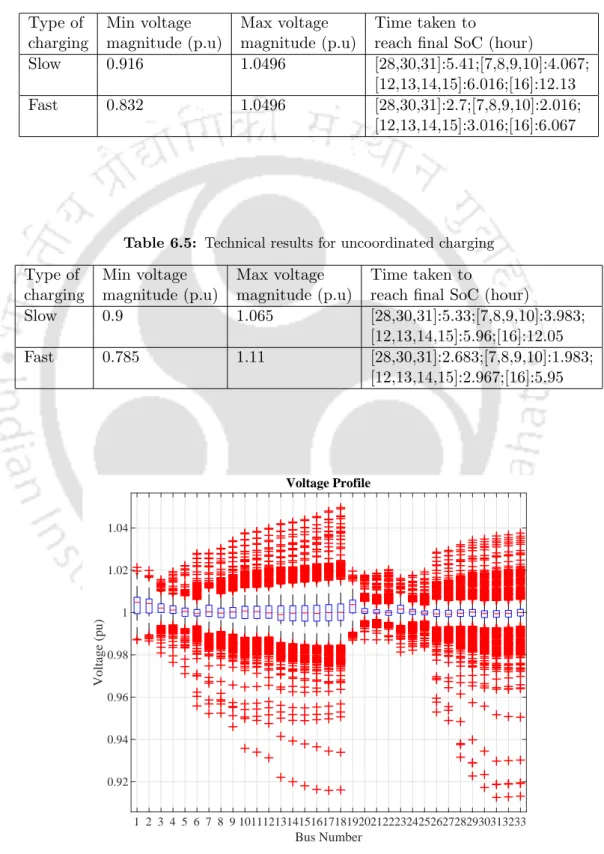
The revenue, cost and profit profiles for the slow charging scheme are shown in fig. From the simulation results in Table 6.6, it can be observed that the profit obtained from EVA in the residential area is greater than that in the industrial area for both schemes. Table 6.8 presents performance metrics such as revenue earned, costs incurred, and profit earned with EVA for the G2V scenario and the G2V and V2G scenarios.
Summary
The number of tap movements and line congestion in the proposed approach is significantly less than the other comparative approaches due to the inclusion of time scale decomposition of volt/var devices and branch current limiting. In Scenario II, due to heavy loading and cloudy condition, more voltage drops in the voltage magnitudes are observed. Furthermore, the reactive power of the fast converters is routed through the local Q(V) characteristics in the second control level.
Scope for future work
Peng, “A robust constrained model for predictive voltage control in active distribution networks,” IEEE Transactions on Sustainable Energy, vol. Piccolo, “A smart strategy for auxiliary voltage control services in distribution networks,” IEEE Transactions on Power Systems, vol. Jalili, “Transactive coordination of electric vehicles with voltage control in distribution networks,” IEEE Transactions on Sustainable Energy, vol.

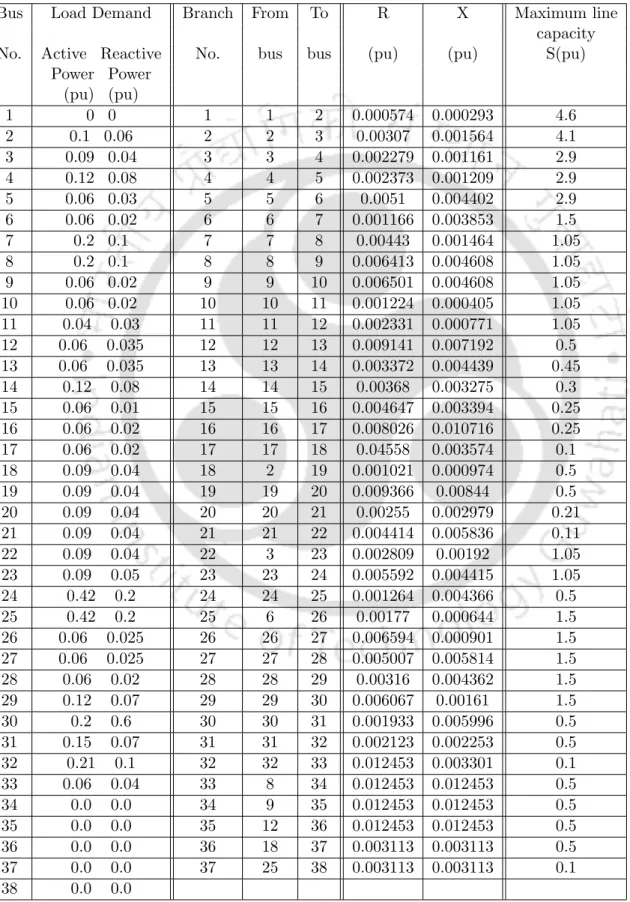
Simulation data for 38-bus radial distribution network
Simulation data for time varying load demand
Simulation data for time varying PV generation, EV demand and MG
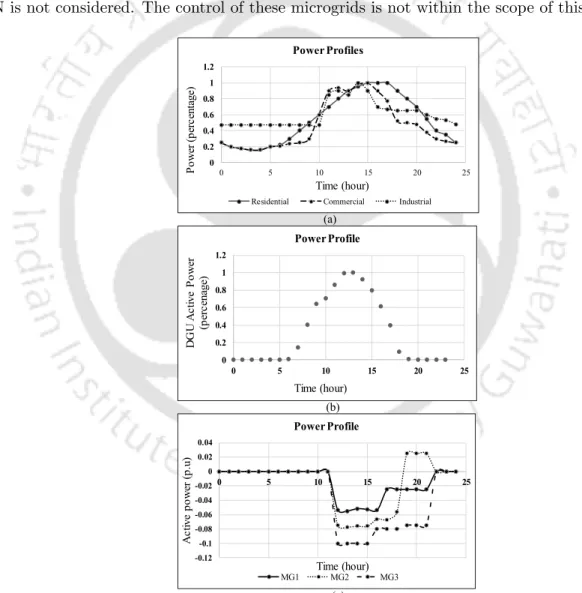
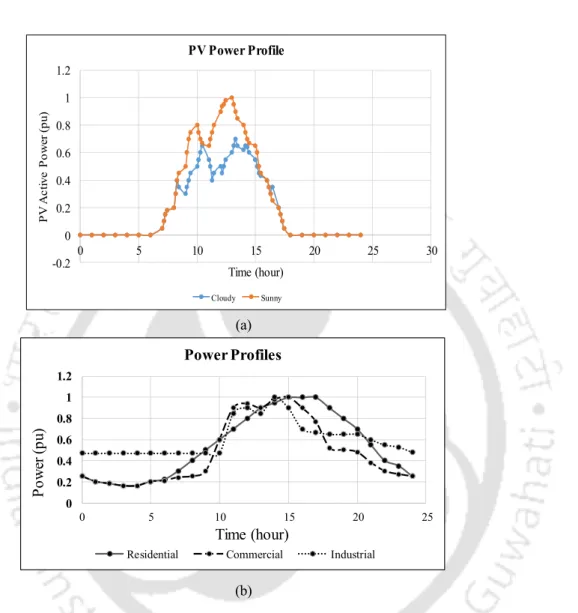
- PV and loads power profiles
- Real-time price of electricity
- Model of DSTATCOM
- Block diagram of the proposed VVC
- Timescale decomposition of VVC devices
- Voltage profile of bus-18 for all the cases
- Power loss profile during the day
- Active power profile of bus-25
- Voltage profile with reactive power support from DSTATCOM and OLTC
- Voltage profile with reactive power support from DSTATCOM, PV inverter and OLTC. 67
- Tap positions corresponding to the single-timescale voltage control scheme
- Test network: 38-bus distribution network
- Voltage profile of bus-18 for Cases 3, 4, and 5 in 38-bus distribution network
- Power profiles of (a) loads (b) PV units and EV charging station
- Block diagram of the proposed control strategy
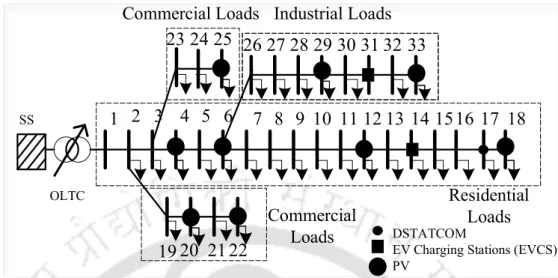
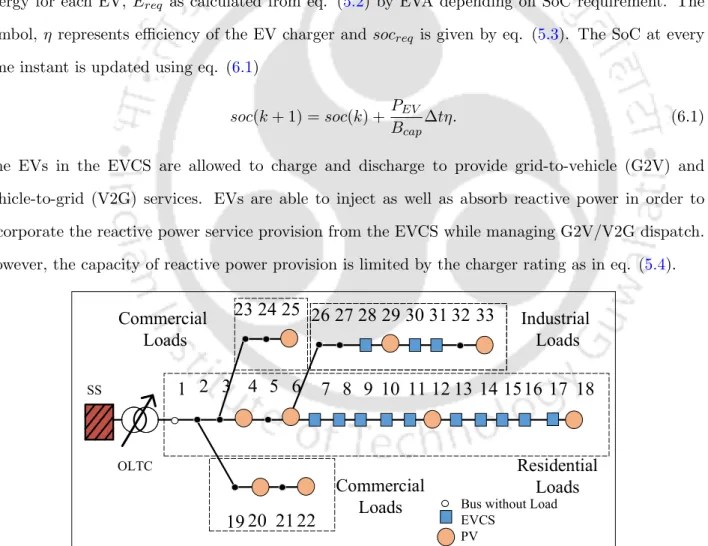
- Test network: 33-bus distribution systems with allocation of loads, PV, DSTATCOM
- Simulation results with Case A for 33-bus distribution network: (a) voltage profile (b)
- Simulation results with Case B for 33-bus distribution network: (a) voltage profile (b)
- Simulation results with Case C for 33-bus distribution network: (a) voltage profile (b)
Arunima Dutta, Sanjib Ganguly, Chandan Kumar, "Voltage control in active distribution networks and an approach based on model predictive control," Proc. Arunima Dutta, Sanjib Ganguly, Chandan Kumar, "Model Predictive Control based Coordinated Voltage Control in Active Distribution Networks using OLTC and DSTATCOM,"Proc. Arunima Dutta, Sanjib Ganguly, Chandan Kumar, "Coordinated voltage control of active distribution networks in presence of PV and energy storage system," Proc.