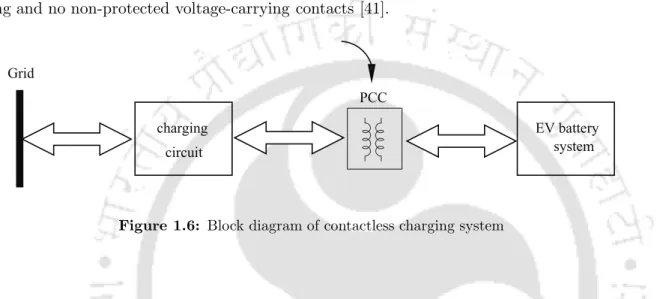
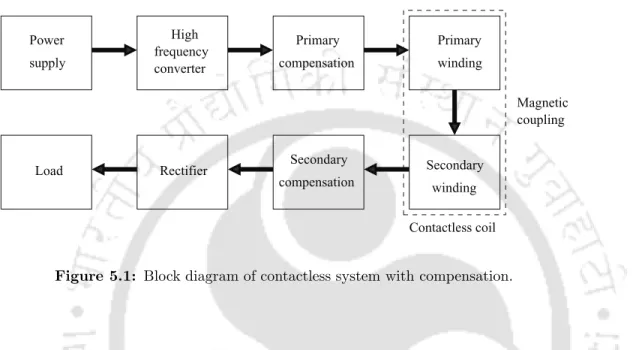
This bidirectional power flow functionality of the charging system has been referred to as grid-to-vehicle and vehicle-to-grid technology. Therefore, compensation capacitors are required on the primary and secondary side of the contactless coil to reduce VA rating of the power supply and to increase the power transfer capability.
Overview
Electric vehicles and charging systems
The charging current can be high in the initial phase and gradually decrease to zero when the battery is fully charged. In a constant current charging scheme, the charging voltage applied to the battery is controlled to maintain a constant current to the battery.
![Figure 1.1: Classification of EV chargers [1–9].](https://thumb-ap.123doks.com/thumbv2/azpdfnet/10513645.0/43.918.153.826.127.909/figure-1-1-classification-of-ev-chargers-1.webp)
Contactless system
The mutual inductance between two coils depends on the distance and relative position of the two coils. A portion of the flux from the current in the second coil will be connected to the first coil, and the total flux connection of the first coil is determined in the same way.

Contactless charging and electric vehicles
With bidirectional converters in the charging system, electric vehicle batteries will be able to transfer power between the grid and electric vehicles [51]. With an additional two-way arrangement of converters in the charging system; An EV can charge its battery from the grid and discharge the stored energy back into the grid.
Major challenges and identified goals
A large number of studies have been found in the literature where the CPT system has been analyzed using a special compensation focusing on a specific application. The problems dealt with in this thesis are described in the previous section, which can provide a better understanding of the work carried out.
Contributions of this thesis
The mutual inductance of the coils is calculated for all possible variations, including lateral and angular deviations in space. Primary compensation is designed to make the primary phase angle equal to the secondary resonant frequency with a minimum VA value from the power supply.
Thesis organization
The analysis compares the efficiency of four compensation topologies so that the real-time performance of CPT systems can be examined. The results of the experiments allow a good understanding of the theory of CPT systems and provide a basis for future design and implementation of CPT systems.
Introduction
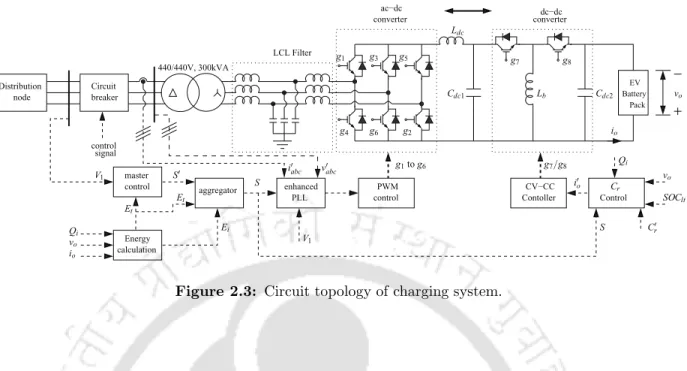
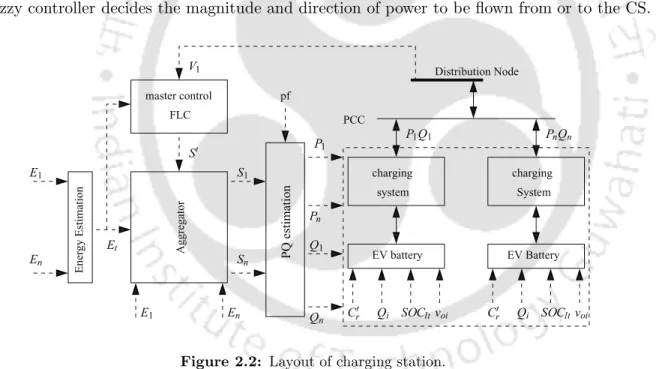
The CS designed in this chapter has multiple charging systems that allow EVs of different ratings to charge or discharge their batteries. EVs in the CS exchange active power or reactive power or both via charging systems to/from the DN.
Voltage regulation at distribution node
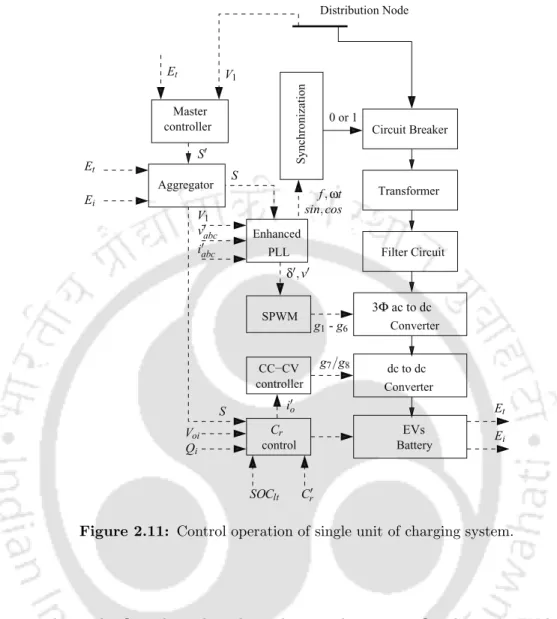
This chapter is organized as follows: Section 2.2 explains the voltage regulation concept at the distribution node.
Frame work of simulation model
Therefore, the limit values of SOC and Cr of the battery were taken into account for the efficient use of the vehicle battery. Thus, according to the SOC limits of the user, the discharge or charge energy of the EV batteries is controlled so that the SOC limits at the end of the time period remain between the range of SOC′ and SOC′′.
Problem definition
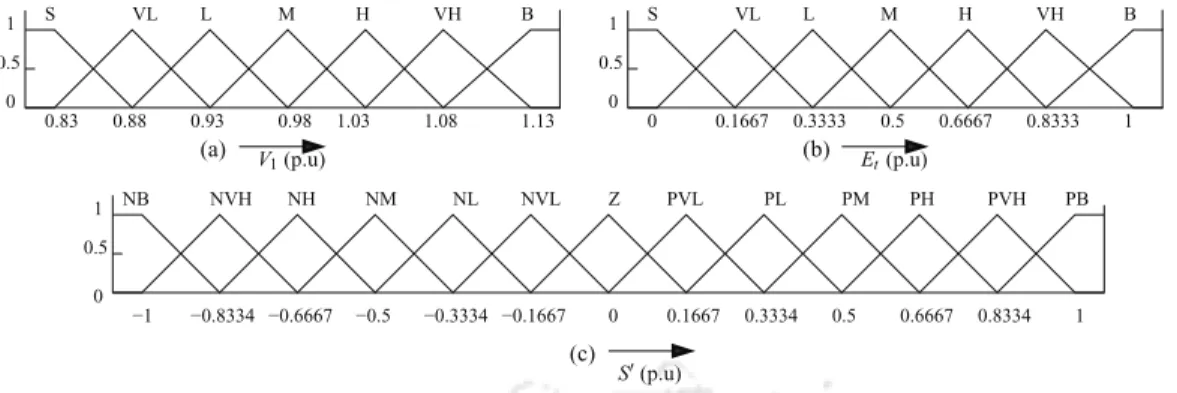
The FLC rules are formed based on the variation of the DN voltage and the energy state of the battery. In this way, the power flow of the charging system is controlled based on the state of the grid and the energy availability of electric vehicles.
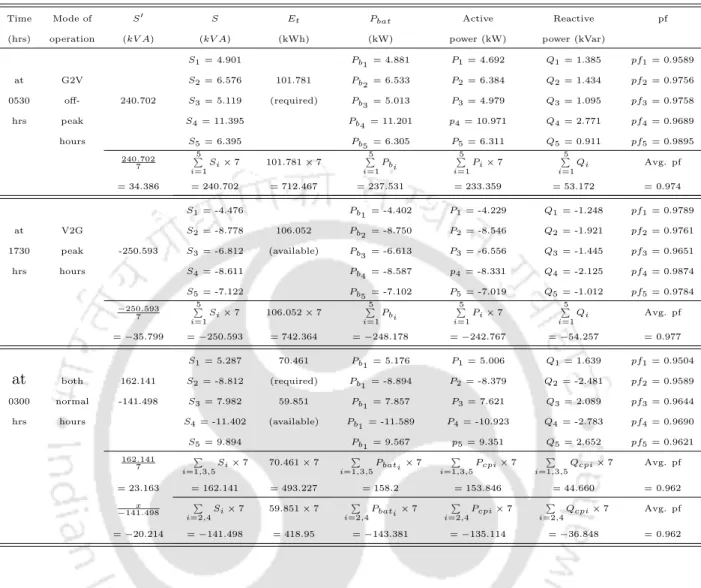
Result analysis
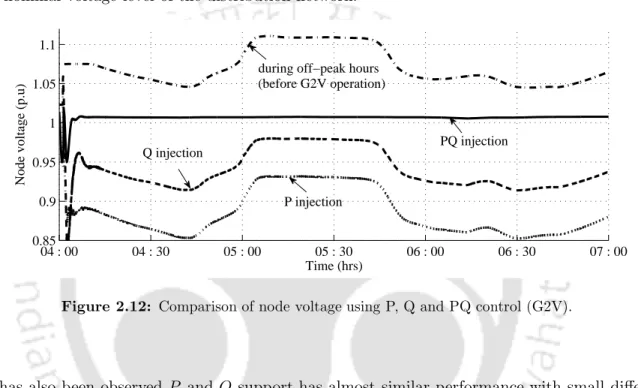
This is evident from figure 2.12; the junction voltage is high around 1.1 p.u before the CS is supported. In Figure 2.13 there is initially a drop in the junction voltage of approximately 0.86 p.u during peak hours.
Conclusions
The results show that the charging system and its controllers prove to be efficient in performance as it provides better voltage control while managing the EV batteries in the CS. Recent developments in modern power electronics have made contactless charging of EVs an economically feasible solution.
Introduction
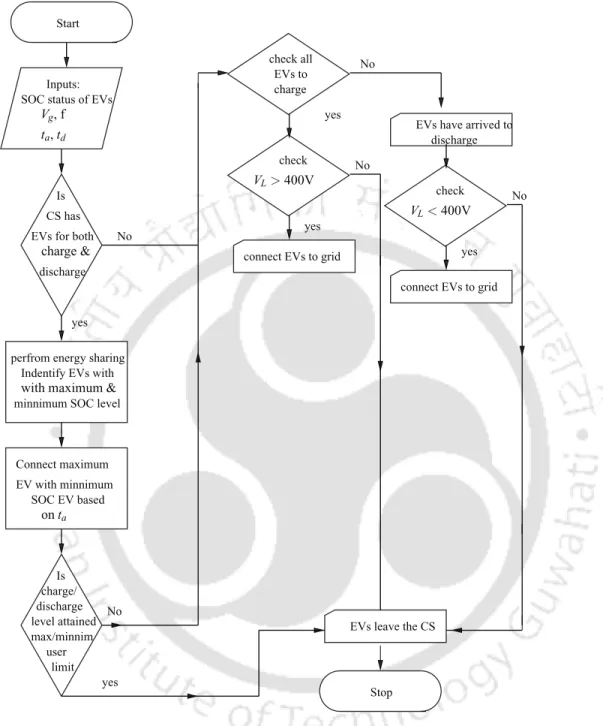
However, if the charging/discharging processes of electric vehicles are uncontrolled, this can have a negative impact on the electric grid and batteries of electric vehicles; must be scheduled in CS. Individual charging systems are monitored to control the flow of power during charging and/or discharging of electric vehicles.
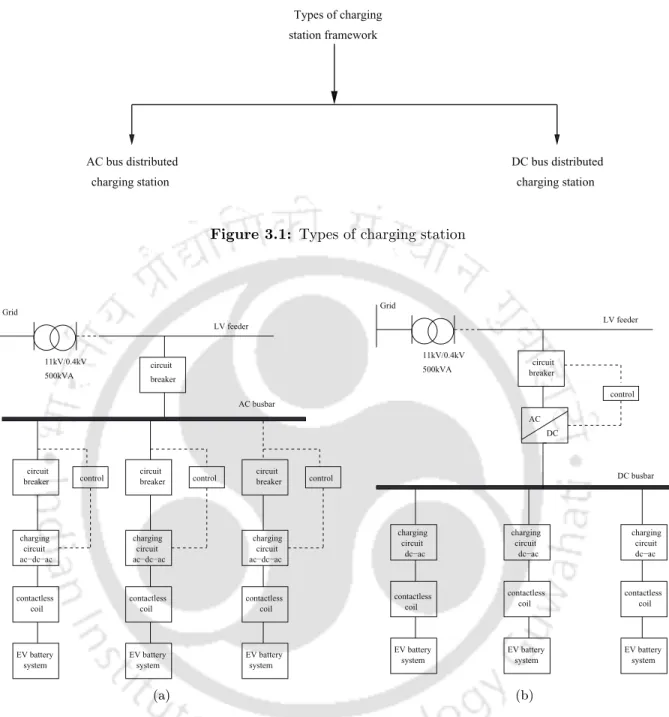
Modeling of contactless charging station
The reclosing control shown in Figure 3.3 controls the entire CS by scheduling the charging and discharging of several EVs that have arrived at the CS. In Figures 3.3 and 3.4, CB1..CBn refer to circuit breakers and CP1..CPn refer to charging points for 'n' parallel connected charging system.
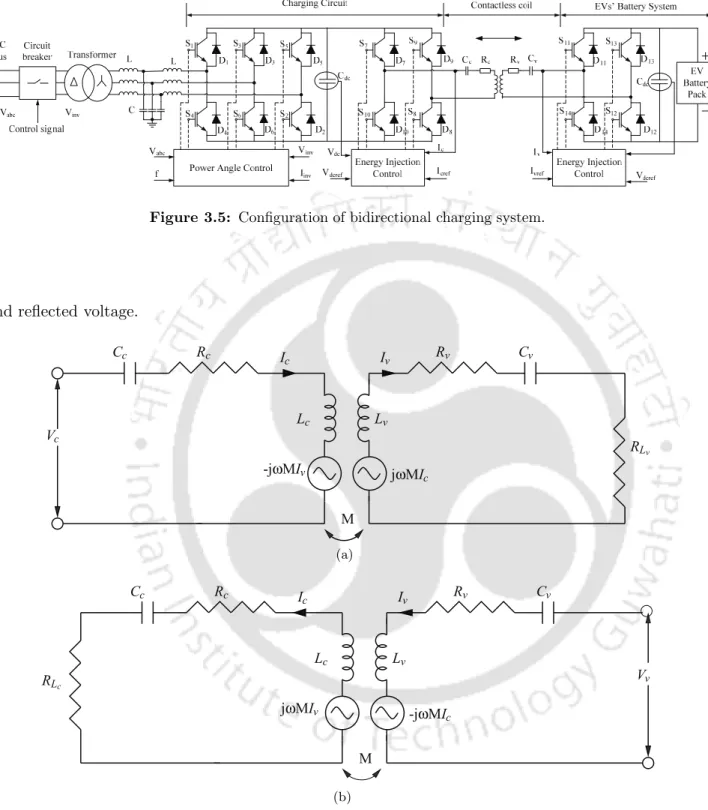
Bidirectional contactless charging system
The EV battery is considered a load during G2V operation and consumes power from the charging circuit. Therefore, the current in the charging circuit is given by (3.8), where Zt,1 is the total impedance seen from the charging circuit.
Problem description
The reclose control keeps any updates about the EV arriving at the CS and assigns the charging systems. EVs are connected to the power supply through three-phase converters (S1 - S6) present in the charging system.
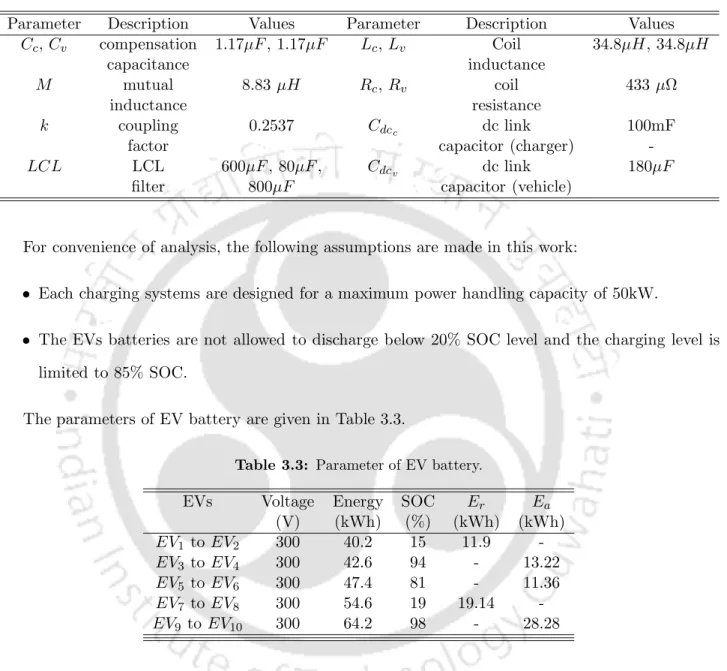
Simulation results
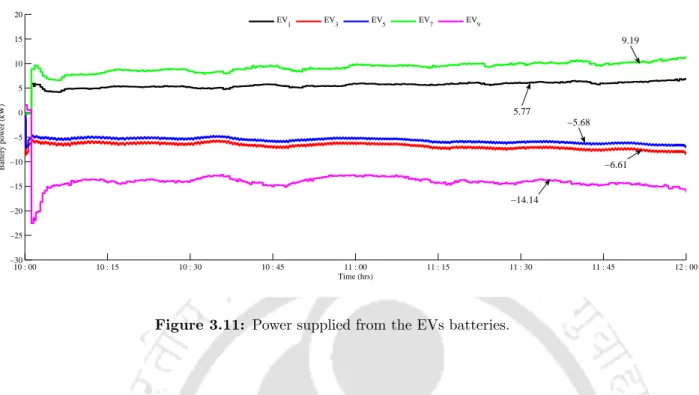
High SOC battery charging systems are allowed to discharge their energy to support a low SOC EV charging system. The EV1 and EV7 arrived in a low SOC battery charging system to charge their batteries.
Conclusions
The next chapter discusses an analytical approach to calculate the MI between two coils, including lateral and angular displacements.
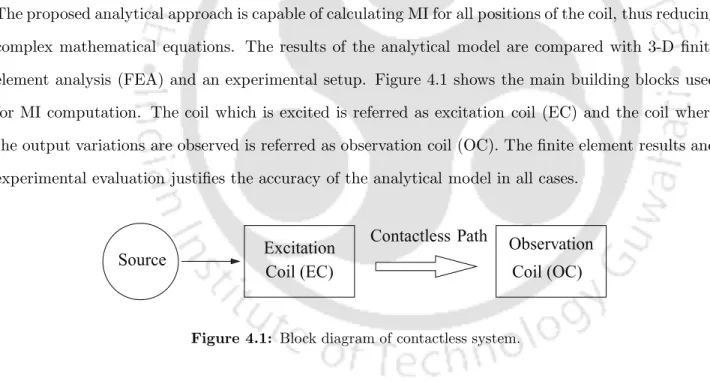
Introduction
The results of the analytical model are compared with 3-D finite element analysis (FEA) and an experimental setup. The finite element results and experimental evaluation justify the accuracy of the analytical model in all cases.
Possible variations of square coils
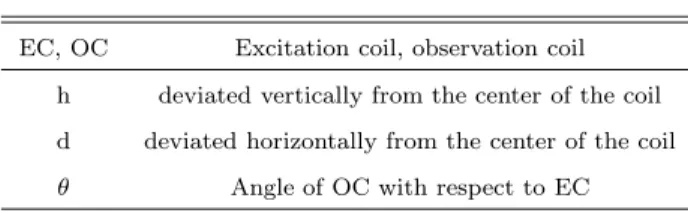
Two types of variations like vertical and planar variation are analyzed in this case as shown in figure 4.3(a) and figure 4.3(b). For LM, horizontal and lateral variations are studied, which are shown in Figure 4.3(c) and Figure 4.3(d).
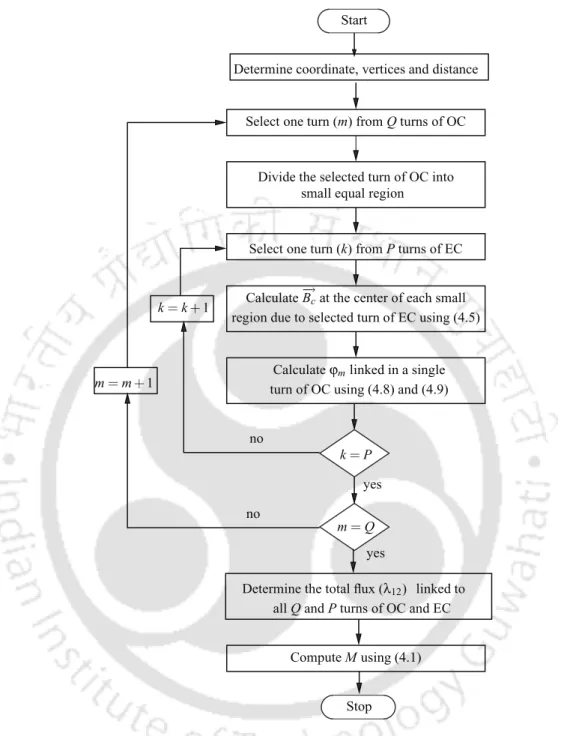
Analytical modeling of square coil
The magnetic field −B→c at the center of the small region is induced due to EC.−B→c is calculated for the curves P of EC and is given by (4.5). B is the magnetic field due to a current-carrying circuit of EC as shown in Fig. 4.5(a) and is given by (4.6).

Finite element modeling of square coil
The flux coupled into a single turn (ϕm) of OC is obtained by adding all the fluxes using (4.9). The FEA models are formed for all configurations of the coils and different positions of OC by changing their coordinates.
Experimental verification
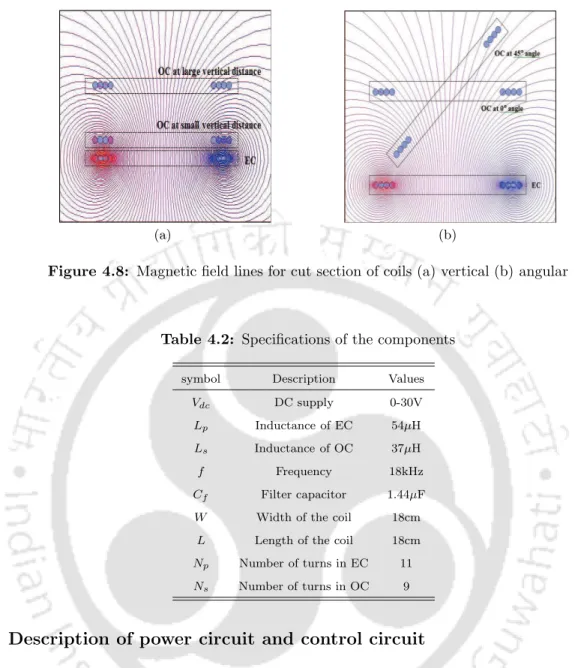
The fan-shaped arrangement shown in Figure 4.7(b) is the side view of the angular variation of the helix. L Coil length 18cm Np Number of turns in EC 11 Ns Number of turns in OC 9.
OGate
Numerical results and discussion
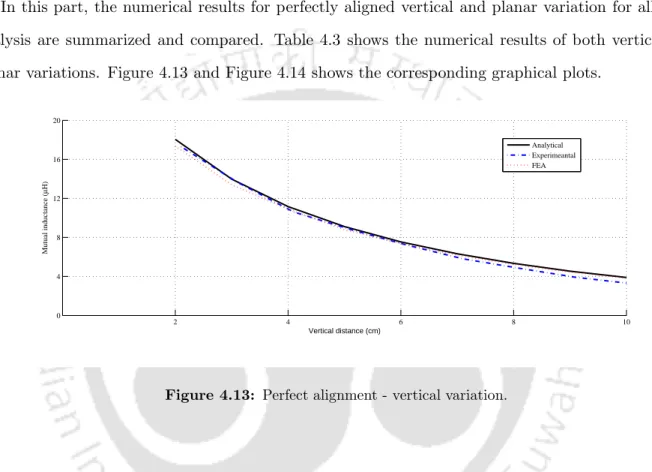
In this section, the numerical results for perfectly matched vertical and planar variation for all three analyzes are summarized and compared. In this section, the numerical results for angular displacement for all three analyzes are summarized and compared.
Conclusions
From the results it was observed; the greater the distance between EC and OC, the lower the coupling coefficient and MI value. Therefore, it is possible to use compensating elements on both sides of contactless coils to improve the MI value and increase the power transfer capability.
Introduction
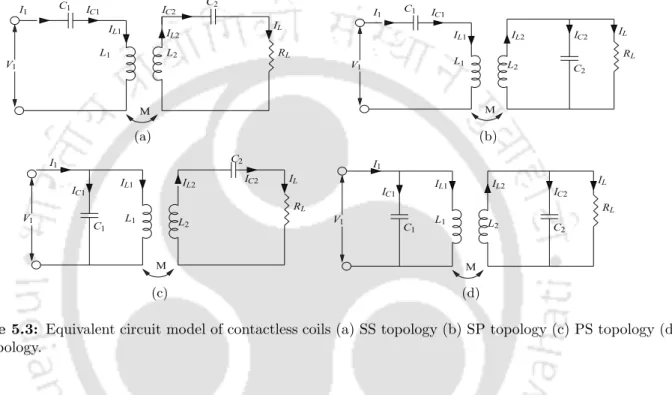
The primary side and the secondary side of the coil are tested with series and parallel compensation circuits. Other parameters prefixed in this study are coil shape, coil dimensions and circuit topology.
Steady state electric circuit analysis
Therefore, the impedance of the secondary, as seen through the primary, is purely resistive in nature. In (5.3) the coupling between the primary and secondary coil depends on the leakage inductance (L1, L2) and the magnetizing inductance (M).
Description of experimental set-up
In the first stage, an SG3525-based PWM controller was used to control the frequency of the inverter. The output frequency of the frequency controller (HIN and LIN) is determined using the on-board oscillator present in the SG3525 controller, where the system frequency is controlled by a timing resistor (Rt), a timing capacitor (Ct) and a damping resistor (Rd).
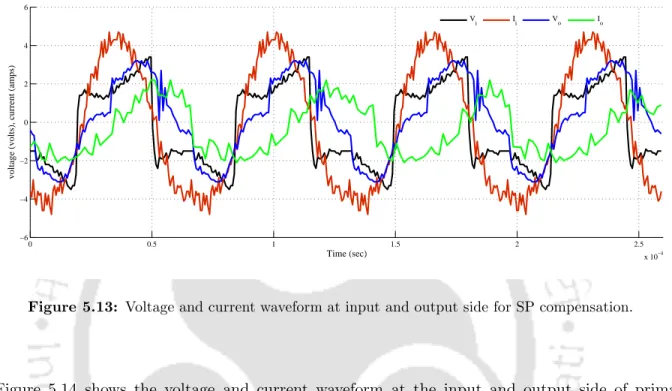
Results and discussion
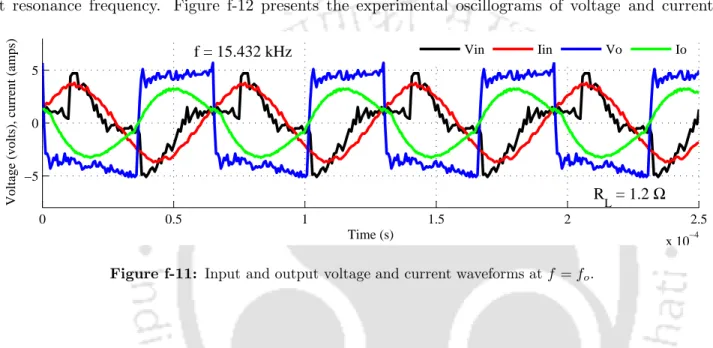
The oscillograms of the capacitor and inductor voltage and the current on the secondary side of the system are shown in Figure 5.17. Figure 5.29 shows that the efficiency of the system decreases with distance, regardless of variations in load resistance.
Conclusions
The analysis shows that the secondary series compensation has good performance for variable frequency operation. The performance of SP and PS is comparable in the case of variable load and distances.
Concluding remarks
Therefore, mutual inductance is one of the crucial factors in the design of a CPT system and will play a key role in determining the efficiency, power transfer, compensation capacitor etc. However, the most important features of the CPT system are the physical isolation between the source and the load as secondary winding of the coil is movable and connected to the load.
Suggestions for future work
It will be an interesting and useful research to analyze the stability of converters and controllers in the contactless charging system. It would be interesting to analyze the performance of the charging system with other control methods.
Additional figures from Chapter 2
Fuzzification & defuzzification for master control of Chapter 2
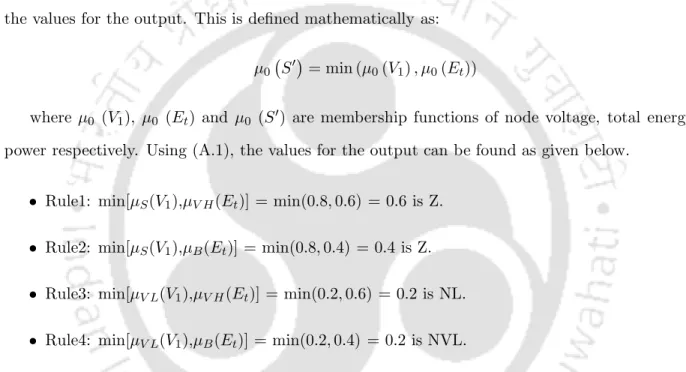
This means that the minimum degree of membership values of the inputs will be the values for the output. Now based on (A.2), the peak value of the output power can be calculated from Figure A.5 as given in (A.2).
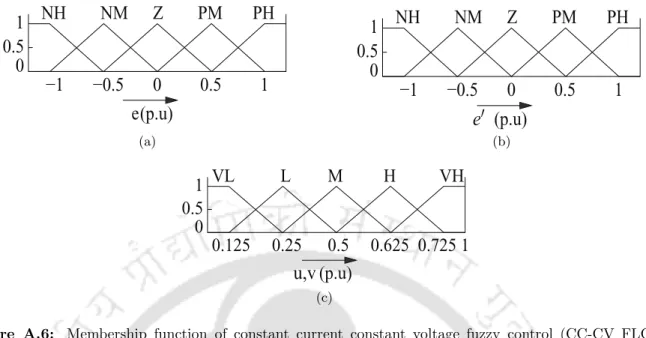
Membership function and rule base of CC-FLC, M-FLC and PA-FLC of Chapter 2
It is found by taking the membership function of the premise and multiplying the certainty to determine the quantity. This means that the controller has directed the power to be sent to the DN from the CS.
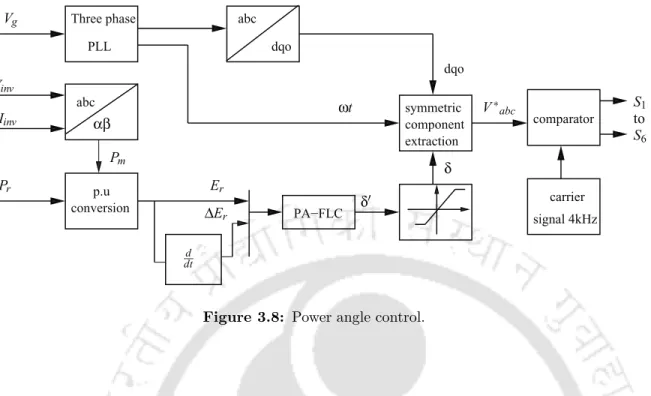
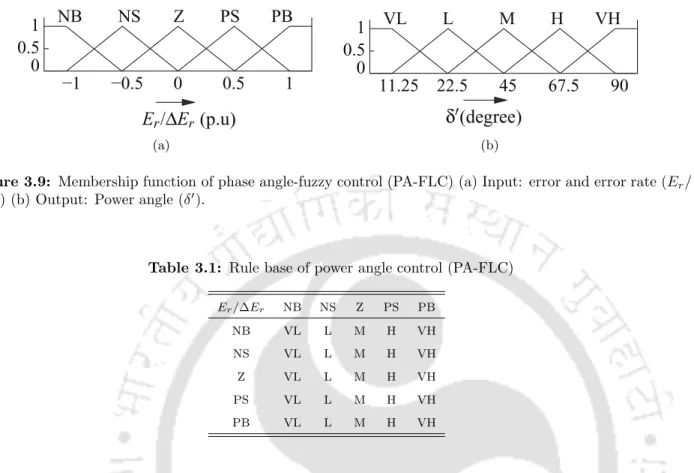
Fuzzification and defuzzification process for power angle control of Chapter 3
These rules indicate that the measured power (Pm) from the charging system is more than the reference power (Pr), therefore the power must be adjusted to the level of Pr. The next step is the inference process, where each rule is checked for membership degrees for participating inputs.
Sample calculation for mutual inductance of Chapter 4
Consider two square coils of length (L) and width (W) 18 cm with a conductor diameter of 1.83 mm. The numerical values obtained at each step for several OC plants are summarized in Table A.3 for the cases discussed above.
Remaining results of Chapter 5
The current in the primary side is seen to lag the voltage, while the current in the secondary side leads the voltage. This shows for the primary side circuit the inductive reactance is more and for the secondary side circuit the capacitive reactance is more.