It is certified that the thesis work entitled “Momentum and Heat/Mass Transfer Phenomena of Contaminated Bubbles in Power-law Liquids” by Venkate Swamy Nalajal (Roll No) was done under my supervision and that this work has not been submitted elsewhere for acquisition degrees Effect of Wall Retardation on the Heat Transfer Phenomenon of a Closed 113 Contaminated Spherical Bubble in Power Law Fluids Using Ansys Fluent.

Nomenclature
Re = Reynolds number, dimensionless R∞ = domain radius, dimensionless Sc = Schmidt number, dimensionless Sh = Sherwood number, dimensionless. To = temperature of force-law fluid, K Ts = temperature of bubble surface, K Uo = free stream velocity, ms-1.
Greek symbols
ABSTRACT
INTRODUCTION
- General Introduction
- Classification of Fluids
- Newtonian fluids
- Non-Newtonian fluids
- Organization of Thesis
The viscosity of a Newtonian fluid is independent of the shear rate and shear stress at a given temperature and pressure. The relationship between shear stress and shear rate of these fluids depends on the duration of the shear and its kinematic history.

LITERATURE REVIEW
- Partially Contaminated Bubbles
- Flow phenomena 1. Newtonian fluids
- Heat/mass transfer phenomena
- Swarms of Bubbles, Drops and Particles
- Flow phenomena
- Heat/mass transfer phenomena
- Objective of Thesis
Ruckenstein (1964) obtained an expression for the mass transfer coefficient of swarms of spherical bubbles and droplets using a free surface cell model in the creeping and potential flow regimes for large values of Peclet numbers, i.e. within the framework of a thin concentration boundary layer. . In the limit Re → 0 and Pe → ∞, Pfeffer (1964) obtained the following expression for the Sherwood number using the cell free surface model together with the solution of the thin boundary layer diffusion equation of Levich (1962).
PROBLEM STATEMENT AND DESCRIPTION
- Single and Swarms of Bubbles in Contaminated Power-law Liquids using In-house Solver
- Governing equations
- Boundary conditions
- Individual and total drag coefficients
- Local and average Sherwood numbers
- Streamlines and vorticity profiles
- Unconfined Single Bubble in Contaminated Power-law Liquids Using ANSYS Fluent
- Confined Single Bubble in Contaminated Power-law Liquids using ANSYS Fluent
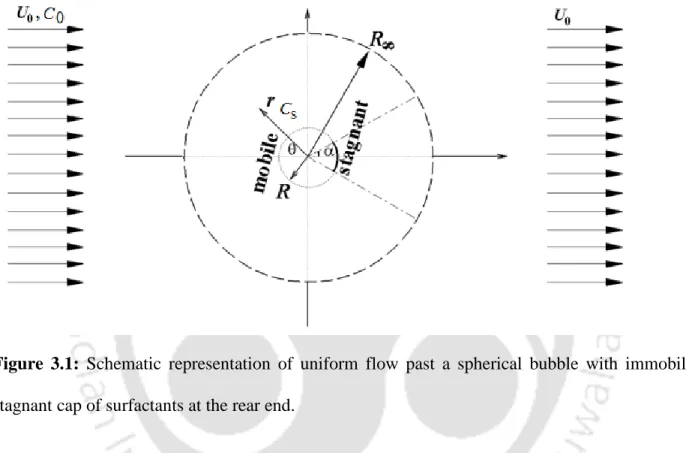
Within the framework of the spherical stagnant shell model, the degree of contamination is expressed by the shell angle "α" measured from the rear stagnation point. Therefore, it is difficult to imagine critical values of the Reynolds number below which the bubble remains spherical in surfactant-laden power-law fluids. Conversely, one can easily calculate the value of R∞ for known values of the volume fraction of the dispersed phase and radius of the bubble.
Furthermore, in the Re → 0 limit, they developed approximate results between the degree of contamination and the inverse value of the capillary number. Depending on the location of the bubble, the upstream distance is Lu and the downstream distance is Ld.
NUMERICAL METHODOLOGY
- In-House SMAC Solver
- Staggered grid arrangement
- Discretization of governing equations
- SMAC-implicit algorithm
- Segregated algorithm for species heat/mass transfer
- Solution Methodology Using Fluent Software
This sequence of time steps is continued until the velocity field satisfies the equation of continuity within a prescribed level. The location of the velocity components is therefore at the center of the cell planes to which they are normal and the grid points for the pressure and species concentrations are at the center of the cell. In the first step, we assume the pressure field at the (ts)th time step and “predict” the velocity field at the (ts+1)th time step using the Gauss-Seidel iterations.
The concentration profile in the continuous phase is obtained with a similar implicit algorithm using the QUICK and second-order central difference schemes for the convective and diffuse terms of the species mass transfer equation, respectively. After obtaining the stable concentration field for the continuous phase, one can easily calculate the values of the local and average Sherwood numbers, as explained in the previous chapter as functions of relevant dimensionless parameters.

CHOICE OF NUMERICAL PARAMETERS
- Drag Behavior of Unconfined Single Bubble using In-house Solver
- Domain and grid study
- Validation
- Drag Behavior of Unconfined Single Bubble using Ansys Fluent
- Domain and grid study
- Validation
- Heat Transfer Phenomena of Unconfined Single Bubble using Ansys Fluent
- Grid study
- Validation
- Wall Retardation Effect on Drag Behavior and Heat Transfer Phenomena of Single Bubble using Ansys Fluent
- Entry and exit effects
- Grid study
- Validation
- Drag Behavior and Mass/Heat Transfer Phenomena of Bubble Swarms using In-house Solver
- Grid study
- Validation
A comparison of the actual Cd values of the clean bubble and the fully contaminated bubble with their literature counterparts is presented in Table 5.2 and Table 5.3. The present heat transfer results are compared with literature values for the case of contaminated bubbles in Newtonian fluids (Table 5.8) and the agreement between the two values is excellent (within the range of discrepancy is ± 2-3%). Furthermore, the actual values of the average Nusselt numbers of completely clean (completely mobile, α = 0) and completely contaminated (completely immobile, α = π) bubbles in power fluids are also compared with literature values (Table 5.9 ) and the agreement is satisfactory.
A mesh independence study is performed for bubble swarms with holdup = 0.1 in Newtonian fluids at Re = 200 and is shown in Table 5.15. Similarly, Table 5.18 shows a comparison between the present values of the drag coefficients of clusters of fully contaminated bubbles (α = 180°) in Newtonian fluids at different Reynolds numbers.

RESULTS AND DISCUSSION
- Flow Patterns
- Surface pressure distribution
- Surface vorticity distribution
- Drag phenomena
Qualitatively similar observations on streamline and vorticity patterns are made for other combinations of the Reynolds number and the power law index. Qualitatively similar observations were made for other combinations of the Reynolds number and the power law index. Furthermore, the maximum increase in the vorticity value at the leading edge of the stationary cap of a contaminated bubble surface also increases with decreasing power law index.
The Cd versus Re characteristic curve was recovered for all values of the power law index and the stagnant cap angle. For all values of Reynolds number and stall angle, the drag ratio increases with the power law index.

Cap angle
Drag behavior of partially contaminated single bubble using Ansys Fluent
- Drag phenomena
- Surface viscosity distribution
However, this crossover Reynolds number appears to be independent of the degree of pollution. For all values of the cap angle, below this crossover Reynolds number, the normalized drag coefficient is large for a fluid causing shear thinning, while the opposite trend holds for a fluid causing shear thickening. Regardless of the cap angle values, above these crossover Reynolds numbers, the normalized drag coefficients of shear-thickening fluids are large compared to those of Newtonian fluids, while the reverse is true for shear-thinning fluids.
For a pure bubble in shear-thinning fluids (Figures 6.15 (a) and 6.15 (b)), i.e., for α = 0°, the surface viscosity is minimal at the front stagnation point, it gradually increases to a certain maximum value around the equator of the bubble surface and then again gradually decreases to a certain intermediate value at the rear stagnation point. On the other hand, for contaminated bubbles in shear-thinning fluids (Figures 6.15(a) and 6.15(b)), the surface viscosity follows the surface viscosity curve of a clean bubble along the moving part of.

Heat Transfer Phenomena of Unconfined Partially Contaminated Single Bubble in Power-law Fluids using Ansys Fluent
- Isotherm contours
- Surface Nusselt number
- Average Nusselt number
However, for fixed values of Reynolds/Prandtl numbers and top angles, the thermal boundary layer thickness. Moreover, for fixed values of the upper boundary angle and Reynolds number (Re > 20), the degree of distortion of the isotherm contours decreases with increasing power law index. For clean bubbles, regardless of the power index and Prandtl number values, the surface Nusselt number decreases from the front stagnation point to the rear stagnation point without any rise at the back of the bubble.
This reduction is strongly function of the Reynolds/Prandtl numbers and the power law index. This sudden reduction in the value of the surface Nu of the contaminated bubble at the leading edge of the stationary shell increases with increasing Reynolds number and/or Prandtl number and/or with decreasing power law index.

Wall Retardation Effect on Drag Behavior of Contaminated Spherical Bubble in Power-law Fluids
- Flow patterns
- Surface pressure and shear stress distribution
- Drag phenomena
Furthermore, for all α ≥ 60°, the size of the recirculation wake increases with decreasing power law index. Regardless of the values of the power index and Reynolds number, as the wall factor increases, the size For fixed values of the cap angle and Reynolds number, the total drag coefficient increases as the value of the power index increases.
Furthermore, unlike the motion of an unbounded bubble in power-law fluids,. For all values of Reynolds number and shroud angle, the drag ratio decreases with increasing power index.

Wall Retardation Effect on Heat Transfer Phenomena of Confined Contaminated Spherical Bubble in Power-law Fluids using Ansys Fluent
- Isotherm contours
- Average Nusselt number
The average Nusselt number increases with increasing Peclet number for all pitch angles, Reynolds numbers and power indices. Additionally, the average Nusselt number decreases with increasing top angle for all Reynolds numbers, Peclet numbers, and power law indices. For Pr ≥ 100, the average Nusselt number increases with increasing power law indices for α ≤ 60o and decreases with increasing power law indices for α ≥ 90o.
For Pr ≥ 100, the average Nusselt number decreases with increasing power-law indices for all angles above. The average Nusselt number increases with increasing wall retardation at moderate Reynolds and Prandtl numbers.
Drag Behavior of Contaminated Bubble Swarms in Newtonian and Power-law Fluids
- Flow patterns
- Surface pressure distribution
- Surface vorticity distribution
- Drag phenomena
Furthermore, this sudden increase in the surface pressure coefficient at the leading edge of the stationary cap is maximal for a = 90° compared to other values of the stationary cap angle. Furthermore, regardless of values of the Reynolds number and stagnant hood angle, the maximum value of the pressure coefficient at the leading edge decreases as the value of holdup increases. For fully contaminated bubbles (α = 180°), for Re > 20, due to recirculation wake formation, the eddy current decreases from its maximum value (at about θ to some negative value at the flow separation point and finally returns to its zero value at the rear stagnation point (θ = 180°) due to the recirculation wake formation.
Moreover, for a fixed value of bubble holdup, as the value of Reynolds number increases, the value of vorticity at the leading edge of the quiescent shroud increases. Qualitatively similar trends are observed for other combinations of Reynolds number, bubble holdup, power index, and stagnation angles; therefore they are not repeated.

Mass Transfer Phenomena of Contaminated Bubble Swarms in Power- law Fluids
- Concentration contours
- Surface Sherwood number
- Average Sherwood number
For fully contaminated bubbles, the surface Sherwood number decreases from the front stagnation point to the rear stagnation point, except for power-law fluids of n = 0.6 at Sc = 100 (Figure 6.63d). As traverse from the leading edge of the stationary shell to the trailing stagnation point, the surface Sherwood number of partially contaminated bubbles follows the surface Sh trends of fully contaminated bubble trends. Qualitatively similar trends observed as in the case of stopping 0.1 (Figure 6.63); however, the local value of Sherwood number increases with increasing discontinuity.
The average Sherwood number increased with increasing Peclet number for all Reynolds numbers, cut angles and holdups. The average Sherwood number increased with increasing hold due to the increased nuisance for all Reynolds numbers, Peclet numbers, and cut angles.

CONCLUSIONS AND FUTURE SCOPE
- Conclusions
- Scope for Future Work
The average Nusselt number of contaminated bubbles increases with increasing Peclet number and/or with decreasing cut angle and/or with decreasing power law index. For all values of the Reynolds number, the drag ratio decreases with increasing cap angle and/or with increasing power law index. The average Nusselt number increases with increasing Reynolds number and/or Prandtl number and/or cut angle.
The size of the recirculation wake increases with increasing Reynolds number and/or decreasing bubble retention and/or decreasing power law indices and/or with increasing cap angle. The concentration boundary layer becomes thinner with increasing Reynolds number and/or Schmidt number and/or decreasing power law indices and/or cut angle.
Dhole, S.D., Chhabra, R.P., Eswaran, V., Flow of power-law fluids past a sphere at intermediate Reynolds numbers, Ind. Dhole, S.D., Chhabra, R.P., Eswaran, V., Drag of a spherical bubble rising in power-law fluids at intermediate Reynolds numbers, Ind. Dhole, S.D., Chhabra, R.P., Eswaran, V., Mass transfer from a spherical bubble rising in power-law fluids at intermediate Reynolds numbers, Int.
Gummalam, S., Chhabra, R.P., Increasing velocity of a swarm of spherical bubbles in non-Newtonian fluids by power law, Can. Jaiswal, A.K., Sundararajan, T., Chhabra, R.P., Flow of power-law fluids through particle assemblies of intermediate Reynolds numbers, Can.
APPENDIX A
Evaluation of Drag Coefficient
In the right-hand side of the above expression, the first and second integr4ents represent the respective pressure and friction components of the drag coefficient.
APPENDIX B
Evaluation of Sherwood Number
APPENDIX -C
Discretization of Governing Equations
Discretization of r-component of Momentum Equation
Discretization of θ-component of Momentum Equation


