Due to the increasing frequency of heart diseases in developed and developing countries, continuous body monitoring of ECG signals using the concept of IoT and Body Sensor Network has become necessary. In this work, we propose a new low complex, low power algorithm and architecture for E.C.G. Instead of going for artificial intelligence based pattern matching and complex DSP algorithm, we have used the simplicity of Hurst exponent and Haar wavelet to filter out abnormal E.C.G.
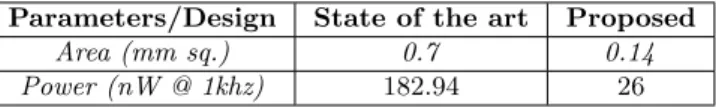
Modification was presented on the standard Hurst Exponent method to improve its classification quality which outperforms the standard methods available for abnormal E.C.G classification in terms of the number of anomalies that can be classified and the classification efficiency as well. Along with the algorithm, we propose the corresponding low complex architecture mining algorithm architecture holistic design view. The proposed architecture was synthesized using U M C130nm technology and it occupies 0.14mm2, while the state-of-the-art method requires 0.7mm2.
Similarly, the power consumption for the proposed design is 26 nW at 1 kHz, while the prior art method consumes 182.94 nW at 1 kHz. The low power and smaller area are the key parameters that make this design more suitable for ASIC implementation.
Motivation
Telecardiology can be very useful for developing and under developed countries due to their smaller doctor to patient ratio. The classification can be used as a primary data filter to determine whether weather samples require detailed processing or not. Any algorithm to be implemented on battery-powered chip has low-power and low-area constraints, which are not met by algorithms mentioned in ref.
Recently, one robust classification technique based on Hurst exponent was published from our research group [8] [9], which was shown to outperform the state-of-the-art classification approaches. Therefore, in this work, we propose a low complexity architecture of this classifier by exploiting architecture algorithm holistic design view so that it can be targeted to CPS (Cyber Physical System) or IOT-enabled remote personal healthcare application. Next, we propose an improved classifier that is shown to outperform that proposed in [8] [9].
Along with the algorithm, a low complexity architecture was also proposed using algorithm architecture holistic design view. All the proposed architecture and algorithms are validated using MIT-BIH database and have been experimented on real hardware.
Literature Survey
However, the main focus in that paper was to propose a robust classifier, but not on its application in remote personalized healthcare due to its computationally intensive nature.
Contribution of Thesis
Thesis Organization
Electrocardiography
ECG Recording
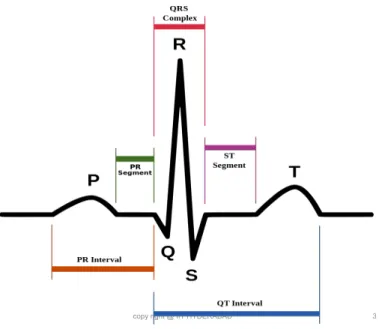
ECG Signal
CVDs in This Thesis
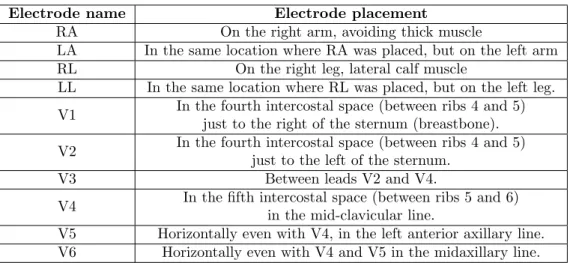
ECG Data Acquisition
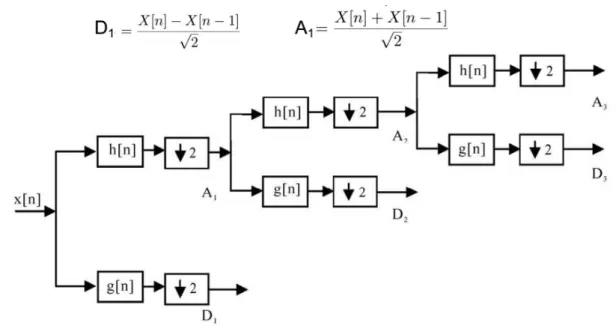
Discrete Wavelet Transform (DWT)
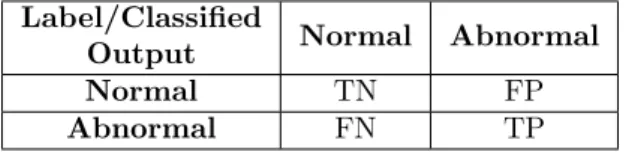
Evaluation of Classifier
Based on the data obtained above, we can determine some parameters for the performance of the classier, which will be discussed below. The sensitivity of the test is the percentage of people known to have the disease who test positive for it. The specificity of a test is the percentage of healthy patients known not to have the disease who will test negative for it.
Introduction
History of Hurst Algorithm
Formulating Hurst Algorithm
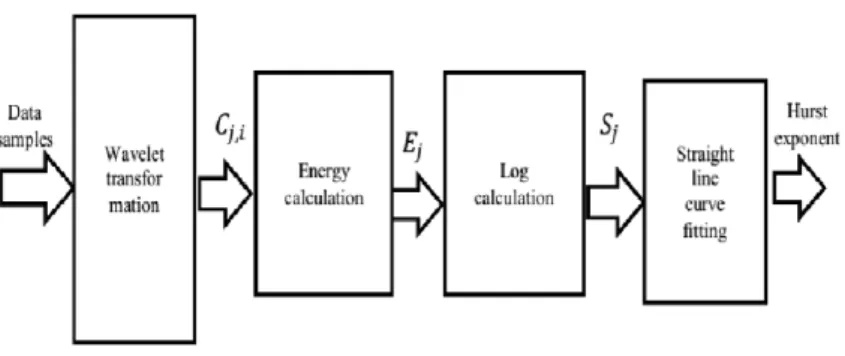
From transformed wavelet component, Cjienergy is calculated at each scale in log domain, which is used to fit straight line. The Hurst exponent thus calculated from the slope of the fitted line (m) is used as a measure for detecting normal and abnormal E.C.G.
Hurst Algorithm as CVD Classifier
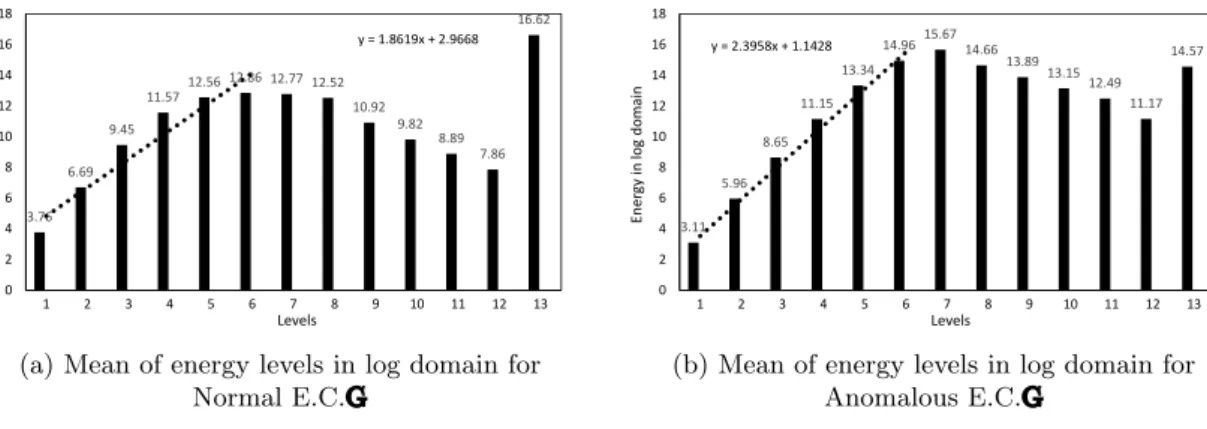
The Hurst exponent thus calculated from the slope of the fitted line (m) is used as a measure for detecting normal and abnormal E.C.G. a) Average energy levels in the log domain for Normal E.C.G. b) Average energy levels in the log domain for Anomalous E.C.G. The normal class consists of all ECG signals collected from normal patients, while in the abnormal class we considered all the ECG signal of the sick patient. Chandra et al have tried to classify ECG signals between the two classes mentioned above.
It is worth noting that in the algorithm, converting the energy to the log domain and obtaining the slope of the straight line makes the algorithm stable for any ADC, i.e. The paper [8] does not talk about which energy levels should be chosen and why in context. of E.C.G signals. In this paper we have tried to address this issue to make the algorithm more perfect in terms of sensitivity and specificity to E.C.G signals.
Proposed Hurst Based CVD Classification Method
Normal EKG signals are highly periodic in nature and have R-peak that has sudden high amplitude. In abnormal ECG signals, there is no sudden change in amplitude compared to normal signal. By mapping the time domain characteristics of normal and abnormal ECG signals to frequency domain, we can expect a high amplitude around the 20-30 Hz band as R peak lies in it.
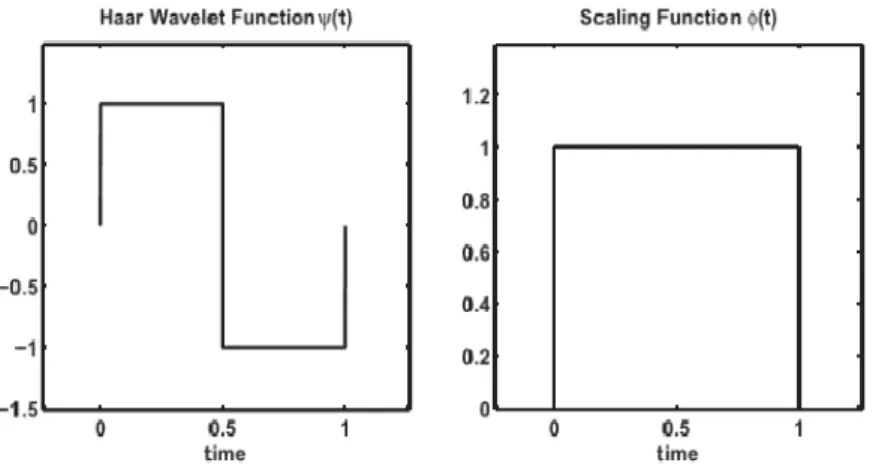
To reduce the computational complexity, we have used the Haar wavelet as the mother wavelet for our analysis. Fig.3.4a shows that the energy level of the ECG signal increases monotonically from level 1 to level 6 and then starts to decrease monotonically. In modification, we have tried to exploit the frequency component analysis of normal E.C.G signal to select the best energy levels which follow scaling properties of straight line curve fitting.
The R peaks are missing, so the power in the high frequency components is less than normal. This has a remarkable effect on the Hurst parameter because it depends on the slope of the fitted line at the chosen energy levels. Figures 3.4a and 3.4b show energies in the logarithmic domain on different scales of normal and abnormal E.C.G.
Note that the energy first level in normal E.C.G is more than the corresponding case in anomalous E.C.G. This sets the basis for choosing correct energy levels for straight-line fitting, so that more contrast in Hurst exponent can be obtained. Observing from the figures, we can say that level 1 to level 6 of energy shows the straight line characteristic compared to rest.
Recall that in order for the Hurst exponent to measure self-similarity, we must choose energy levels that follow scaling properties (ie straight-line function in log domain). So we can conclude that energy level 1 to energy level 6 is best for straight line curve fitting. Note that the slope (fitted equation is on the figure) for abnormal E.C.G is greater than normal E.C.G.
Theoretical Threshold Calculation
Robustness of Proposed Algorithm Towards Scaling Is- sues of ADCssues of ADCs
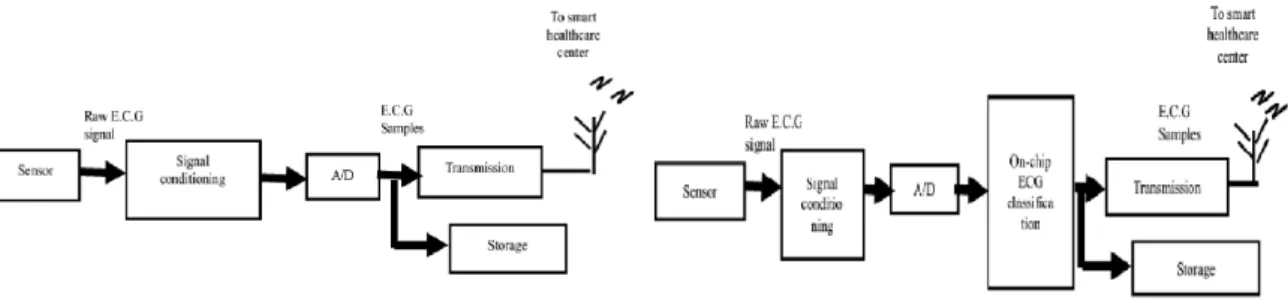
In this scenario, when classification system migrates from one ADC to another, it needs to recalibrate according to the input range and resolution of ADC. Analog front filters the physical signals to ECG signals input frequency range, removes 50 Hz power line interference, adjusts the gain according to the need of ADC and then forwards the signal to ADC block for digitization. The calculated energy is susceptible to scaling effect when changing the ADC system, because we calculate energy directly from amplitudes of ECG signals.
This effect of scaling in Energies can easily propagate to Hurst exponent and can degrade the classification efficiency. So to stop the propagation of scaling effect in ADC, energy of each level is passed through logarithmic block. The proposed methodology is therefore robust against the scaling effect in ADC and can be used across all types of ADC.
Introduction and Architectural Constraints
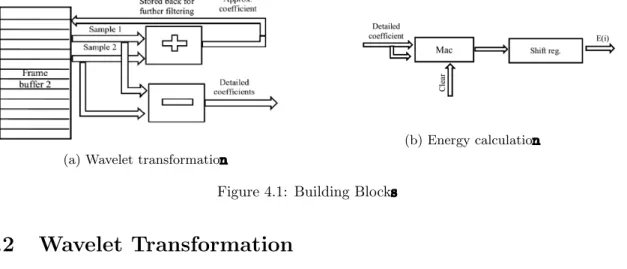
Wavelet Transformation
The detailed coefficients are used for further calculation, while approximate coefficients are refined again to obtain detailed coefficients.
Energy Calculation
Factor 2 is done in the energy calculation phase because during the energy calculation we square the coefficients, so 1. The activation signal is issued by the control unit according to the number of elements at each level. Later the shift register must be shifted one more bit for the factor offset.
Log Calculation
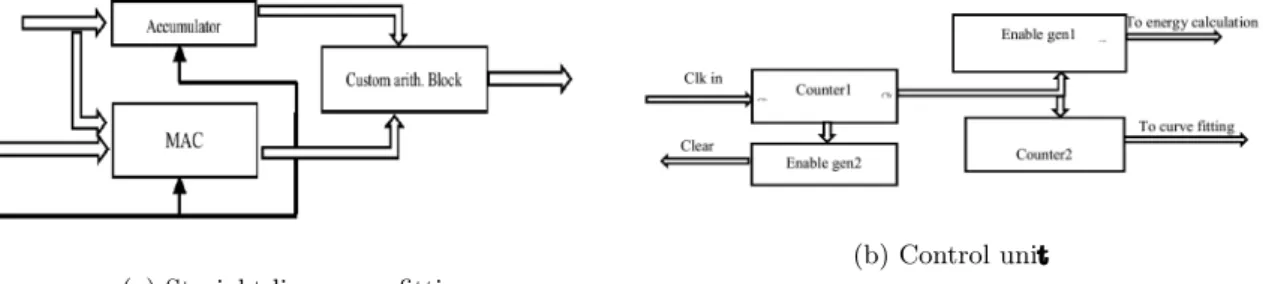
Straight Line Curve Fitiing
Decision Making Block
Control Unit
Database Selection and Preprocessing
Threshold Selection
Experimental Results
Algorithm
Architecture
The proposed design occupies much less area (almost 6 times less) and low power (almost 6 times) compared to the state-of-the-art technique. This makes it suitable for resource-constrained environments such as IoT and remote healthcare where power consumption is low and the area of extreme need is small. The reason for using fixed-point representation is low complexity, low power, and easy implementation.
The loss of accuracy when using a 16-bit fixed point representation is very small, which can be ignored regarding the advantage of low power and ease of implementation. In Fig.5.3 we can see the switching of the “classified result” pin when abnormal samples are input. The presented work attempts to use the Hurst exponent for the implementation of low-complexity and low-power architecture for E.C.G classification.
Here in this work, we have tried to use the simplicity of the Hurst exponent and Haar wavelet to present the binary classification of the ECG signal. The standard Hurst exponent method has been fine-tuned for ECG classification to increase its accuracy. T ompkins (1997) A multipleclassifier architecture for ECG beat classification, IEEE Workshop on Neural Network for Signal Processing, 172181.
Setarehdan, (2006) Neural network based arrhythmia classification using heart rate variability signal, Proceedings of the EUSI-PCO. Sastry, Soumya Jana, Telecardiology: Hurst Exponent Based Anomaly Detection in Compressively Sampled ECG Signals IEEE healtcom International Conference 2013. Comparison of FCM, PCA and WT Techniques for ECG Arrhythmia Classification Using Artificial Neural Network .
16] Karraz, G.; Magenes, G.;, Automatic heart beat classification using neural network classifier based on a Bayesian framework, Society for Engineering in Medicine and Biology, 2006. 17] Karraz, G.; Magenes, G.;, Automatic heartbeat classification using neural network classifier based on a Bayesian framework, Society for Engineering in Medicine and Biology, 2006. 26] Taihai Chen; Mazomenos, E.B.; Maharatna, K.; Dasmahapatra, S.; Niranjan, M., "Design of a low-power on-body ECG classifier for remote cardiovascular monitoring systems", New and Selected Topics in Circuits and Systems, IEEE Journal on , vol.3, no. 1, pp.75,85, March 2013 Application in Medical Care, 1978.