Journal of Structural Engineering
Optimization Based Improved Softened Membrane Model for Rectangular Reinforced Concrete Members under Combined Shear and Torsion
--Manuscript Draft--
Manuscript Number: STENG-6964R2
Full Title: Optimization Based Improved Softened Membrane Model for Rectangular Reinforced Concrete Members under Combined Shear and Torsion
Manuscript Region of Origin: INDIA
Article Type: Technical Paper
Section/Category: Analysis and Computation
Funding Information: Science and Engineering Research Board
(SB/S3/CEE/0060/2013) Dr Suriya Prakash
Abstract: Reinforced concrete (RC) elements are often subjected to combined actions including torsion under seismic events. Understanding the behavior of RC members under combined actions including torsion is essential for safe design. Behavioral predictions of RC columns under combined loading can be improved by including the bi-directional stress effects. The objective of this work is to propose improved combined actions softened membrane model (CA-SMM) for predicting the behavior of RC elements under combined torsion (T) and shear loading (V). In this approach, the rectangular cross-section is modeled as an assembly of four cracked shear panels. The applied external loads are distributed among these four shear panels. This assumption helps in reducing the complex stress state from combined loading to four different simple stress states on these panels. Additional equilibrium and compatibility conditions are
imposed, and the system of non-linear equations are solved by using an optimization technique called gradient descent method. The developed improved model (CA-SMM) is validated with the experimental data available in the literature. After that, an
interaction between the shear and torsion is developed to understand the behavior under various combinations of torsion and shear. A parametric study is carried out for understanding the effect of various sectional parameters such as longitudinal reinforcement ratio, transverse reinforcement ratio, and concrete strength. The predictions of the improved model had a close correlation with the test results.
Corresponding Author: Suriya Prakash, Ph.D.,
Indian Institute of Technology Hyderabad Sangareddy, Telangana INDIA
Corresponding Author E-Mail: [email protected]
Order of Authors: Sriharsha Reddy Kothamuthyala, Mtech Nikesh Thammishetti, Mtech
Suriya Prakash, Ph.D.,
Chandrika Prakash Vyasarayani
Suggested Reviewers: Ashraf Ayoub, PhD
Professor, City University of London
Professor Ayoub and his group have worked extensively on behavior of RC members under combined loading including torsion.
Mohamad Elgawady, PhD
Professor, Missouri University of Science and Technology
Dr. Elgawady has extensively worked on behavior of RC members under torsional loading.
Abdeldjelil Belarbi, PhD
Professor, University of Houston
Powered by Editorial Manager® and ProduXion Manager® from Aries Systems Corporation
Has extensively worked on devleopment of improved models for combined loading including torsion
Ananth Ramaswamy, PhD
Professor, Indian Institute of Science
Has extensively worked on behavior of RC members and on development of improved models
Opposed Reviewers:
Additional Information:
Question Response
Authors are required to attain permission to re-use content, figures, tables, charts, maps, and photographs for which the authors do not hold copyright. Figures created by the authors but previously published under copyright elsewhere may require permission. For more information see
http://ascelibrary.org/doi/abs/10.1061/978 0784479018.ch03. All permissions must be uploaded as a permission file in PDF format. Are there any required
permissions that have not yet been secured? If yes, please explain in the comment box.
No
ASCE does not review manuscripts that are being considered elsewhere to include other ASCE Journals and all conference proceedings. Is the article or parts of it being considered for any other
publication? If your answer is yes, please explain in the comments box below.
No
Is this article or parts of it already published in print or online in any
language? ASCE does not review content already published (see next questions for conference papers and posted
theses/dissertations). If your answer is yes, please explain in the comments box below.
No
Has this paper or parts of it been
published as a conference proceeding? A conference proceeding may be reviewed for publication only if it has been significantly revised and contains 50%
new content. Any content overlap should be reworded and/or properly referenced. If your answer is yes, please explain in the comments box below and be prepared to provide the conference paper.
No
ASCE allows submissions of papers that are based on theses and dissertations so long as the paper has been modified to fit the journal page limits, format, and tailored for the audience. ASCE will
No
Powered by Editorial Manager® and ProduXion Manager® from Aries Systems Corporation
consider such papers even if the thesis or dissertation has been posted online provided that the degree-granting institution requires that the thesis or dissertation be posted.
Is this paper a derivative of a thesis or dissertation posted or about to be posted on the Internet? If yes, please provide the URL or DOI permalink in the comment box below.
Each submission to ASCE must stand on its own and represent significant new information, which may include disproving the work of others. While it is acceptable to build upon one’s own work or replicate other’s work, it is not appropriate to fragment the research to maximize the number of manuscripts or to submit papers that represent very small incremental changes. ASCE may use tools such as CrossCheck, Duplicate Submission Checks, and Google Scholar to verify that submissions are novel. Does the manuscript constitute incremental work (i.e. restating raw data, models, or conclusions from a previously published study)?
No
Authors are expected to present their papers within the page limitations described in <u><i><a
href="http://dx.doi.org/10.1061/978078447 9018" target="_blank">Publishing in ASCE Journals: A Guide for
Authors</a></u></i>. Technical papers and Case Studies must not exceed 30 double-spaced manuscript pages, including all figures and tables. Technical notes must not exceed 7 double-spaced manuscript pages. Papers that exceed the limits must be justified. Grossly over- length papers may be returned without review. Does this paper exceed the ASCE length limitations? If yes, please provide justification in the comments box below.
No
All authors listed on the manuscript must have contributed to the study and must approve the current version of the manuscript. Are there any authors on the paper that do not meet these criteria? If the answer is yes, please explain in the comments.
No
Was this paper previously declined or withdrawn from this or another ASCE journal? If so, please provide the previous manuscript number and explain what you have changed in this current version in the comments box below. You may upload a separate response to reviewers
No
Powered by Editorial Manager® and ProduXion Manager® from Aries Systems Corporation
if your comments are extensive.
Companion manuscripts are discouraged as all papers published must be able to stand on their own. Justification must be provided to the editor if an author feels as though the work must be presented in two parts and published simultaneously.
There is no guarantee that companions will be reviewed by the same reviewers, which complicates the review process, increases the risk for rejection and potentially lengthens the review time. If this is a companion paper, please indicate the part number and provide the title, authors and manuscript number (if available) for the companion papers along with your detailed justification for the editor in the comments box below. If there is no justification provided, or if there is insufficient justification, the papers will be returned without review.
No
If this manuscript is intended as part of a Special Issue or Collection, please provide the Special Collection title and name of the guest editor in the comments box below.
No
Recognizing that science and engineering are best served when data aremade available during the review and discussion of manuscripts andjournal articles, and to allow others to replicate and build on workpublished in ASCE journals, all reasonable requests by reviewers formaterials, data, and associated protocols must be fulfilled. If you are restricted from sharing your data and materials, please explain below.
No
Papers published in ASCE Journals must make a contribution to the core body of knowledge and to the advancement of the field. Authors must consider how their new knowledge and/or innovations add value to the state of the art and/or state of the practice. Please outline the specific contributions of this research in the comments box.
Accurate predictions of the behaviour of RC members subjected to combined loading is essential for optimal design solutions. Only limited analytical models are available for predicting the response of rectangular RC members subjected to combined loading including torsion. This study presents an improved and robust combined actions softened membrane model (CA-SMM) for the analysis of rectangular RC members. In particular, the following advancements are made in the CA-SMM model developed in this study:
1.Sophisticated softened membrane based model is adopted for analysing the behaviour of RC members subjected to combined shear and torsion loading.
2.The effect of bi-directional stress (Poisson’s effect) is considered in the formulations of CA-SMM for improved post-peak predictions.
3.An improved tension stiffening effect model is used to account for the strain gradient effect.
4.A robust optimization based solution algorithm is proposed for significantly reducing the computational time involved in the analysis of RC members under combined actions including torsion.
The flat fee for including color figures in print is $800, regardless of the number of color figures. There is no fee for online only color figures. If you decide to not print figures in color, please ensure that the color figures will also make sense
No
Powered by Editorial Manager® and ProduXion Manager® from Aries Systems Corporation
when printed in black-and-white, and remove any reference to color in the text.
Only one file is accepted for each figure.
Do you intend to pay to include color figures in print? If yes, please indicate which figures in the comments box.
If there is anything else you wish to communicate to the editor of the journal, please do so in this box.
No
Powered by Editorial Manager® and ProduXion Manager® from Aries Systems Corporation
Optimization-Based Improved Softened Membrane Model for Rectangular
1
Reinforced Concrete Members under Combined Shear and Torsion
2 3
Sriharsha Reddy Kothamuthyala
(1), Nikesh Thammishetti
(2), Suriya Prakash S
(3),
4Chandrika Prakash Vyasarayani
(4) 56
(1) Graduate Student, Email: [email protected] 7
Department of Civil Engineering, IIT Hyderabad, India 8
(2) Ph.D. Candidate, Email: [email protected] 9
Department of Civil Engineering, IIT Hyderabad, India 10
(3) Associate Professor and Corresponding Author, Email: [email protected] 11
Department of Civil Engineering, IIT Hyderabad, India 12
(4) Associate Professor, Email: [email protected] 13
Department of Mechanical and Aerospace Engineering, IIT Hyderabad, India 14
15
Abstract 16
Reinforced concrete (RC) elements are often subjected to combined actions including torsion under seismic 17
events. Understanding the behavior of RC members under combined actions including torsion is essential 18
for safe design. Behavioral predictions of RC columns under combined loading can be improved by 19
including the bi-directional stress effects. The objective of this work is to propose improved combined 20
actions softened membrane model (CA-SMM) for predicting the behavior of RC elements under combined 21
torsion (T) and shear loading (V). In this approach, the rectangular cross-section is modeled as an assembly 22
of four cracked shear panels. The applied external loads are distributed among these four shear panels. This 23
assumption helps in reducing the complex stress state from combined loading to four different simple stress 24
states on these panels. Additional equilibrium and compatibility conditions are imposed, and the system of 25
non-linear equations are solved by using an optimization technique called gradient descent method. The 26
developed improved model (CA-SMM) is validated with the experimental data available in the literature.
27
After that, an interaction between the shear and torsion is developed to understand the behavior under 28
various combinations of torsion and shear. A parametric study is carried out for understanding the effect of 29
various sectional parameters such as longitudinal reinforcement ratio, transverse reinforcement ratio, and 30
concrete strength. The predictions of the improved model had a close correlation with the test results.
31 32
Keywords: Combined loading; RC Member; Shear; Softened Membrane Model (SMM); Torsion 33
34
Manuscript Click here to download Manuscript Manuscript_final.docx
INTRODUCTION 35
Reinforced concrete (RC) bridge columns are subjected to combined loading including torsion under 36
seismic events. In general, numerous structural elements namely arch ribs, L-shaped bridge columns, and 37
spiral staircases are subjected to combinations of loading. General system of forces and moments acting in 38
RC member subjected to combined loading are shown in Fig. 1. Accurate predictions of the behavior of RC 39
members subjected to combined loading is essential for optimal design solutions. In typical design practices 40
of RC members, the effect of the torsional moment is ignored or indirectly considered in the design.
41
However, previous studies indicate that the presence of torsion during seismic events could significantly 42
affect the performance of the RC members (Tirasit and Kawashima 2007, Prakash et al. 2010, Prakash et 43
al. 2012). Previous researchers have extensively studied predicting the behavior of RC columns subjected 44
to torsional loading analytically through various approaches (Onsongo 1978, Chalioris 2007, Prakash and 45
Belarbi 2010, Belarbi et al. 2010, Deifalla 2015, Mondal et al. 2017). The cyclic torsional behavior of the 46
square and circular RC columns has also been investigated (Li 2012, Chalioris and Karayannis 2013, Li 47
and Belarbi 2013). In the past, only few studies (Klus 1968, Lampert and Thurlimann 1969, McMullen and 48
Warwaruk 1970, Onsongo 1978, Ewida and McMullen 1982, Greene and Belarbi 2009 ) have 49
experimentally investigated the effect of combined bending moment, shear and torsional loads on the 50
behavior of RC members.
51 52
Noncircular RC members warp under torsional loading (Collins and Mitchell 1997, Hsu 1993, Jeng 2014, 53
Zhang and Hsu 1998; Mullapudi and Ayoub 2013) and pose challenges in developing a rational model 54
under combined loading including torsion. Different analytical models such as softened truss model (STM) 55
from University of Houston (Hsu and Belarbi; Hsu and Zhu 2002; Greene and Belarbi 2009; Mondal and 56
Prakash 2015) and modified compression field theory (MCFT) from University of Toronto (Onsongo 1978;
57
Rahal 1993, Rahal and Collins 1995) were developed. These rational models were based on the principles 58
of mechanics and evolved over the years with increasing sophistication. The present study comes in the 59
purview of studies that include modeling the behavior of cracked concrete using STM developed at the 60
University of Houston. Mondal and Prakash (2015a, 2015b) showed that inclusion of tension stiffening 61
could significantly improve the torque twist prediction using STM. The effect of Poisson’s ratio is observed 62
by the researchers and is found to be significant in the prediction of the behavior of RC members. Due to 63
the Poisson effect, the stresses get induced in the direction perpendicular to the direction in which loads are 64
applied. This stress state is known as bi-directional stress state and occurs due to Poisson effect. Zhu and 65
Hsu (2002) proposed a softened membrane model (SMM) including the effect of bi-directional stress states.
66
Jeng and Hsu (2009) proposed a softened membrane model for torsion (SMMT) for rectangular cross 67
sections by considering the effect of strain gradient. The consideration of bi-directional stresses using 68
Poisson’s ratio helps in predicting the post-peak behavior accurately (Hsu and Zhu 2002). The fundamental 69
differences between CA-STM and CA-SMM are summarised in Table 1. SMMT was extended to other 70
geometries, and configuration like box girders (Greene and Belarbi 2009), hollow RC members (Jeng and 71
Hsu 2009), and rectangular sections strengthened with fiber reinforced polymer (FRP) composites 72
(Ganganagoudar et al. 2016) under pure torsion. Ganganagoudar et al. (2016) have also extended the SMM 73
based model for torsion (SMMT) for circular members and validated with the experimental test results.
74 75
Previous researchers have developed rational models for analysis of RC members under bending, shear, 76
axial load and their combinations (Rahal and Collins 1995; Mullapudi and Ayoub 2010, 2013). However, 77
combined loading with torsion can result in brittle failure of RC members and calls for deeper understanding 78
and development of improved models. Using MCFT, Rahal and Collins (1995) proposed a theoretical 79
model for predicting the behavior of RC rectangular columns subjected to combined torsion and shear 80
loading. They have modeled the rectangular section as an assembly of four cracked shear panels. The 81
applied loads are distributed among the shear panels in such a way that equilibrium and compatibility 82
conditions are satisfied. The stress states in each shear panels will be different due to different loads acting 83
on it. Greene and Belarbi (2009a, 2009b) developed a softened truss model (STM) based approach for 84
predicting the response of rectangular girder subjected to combined loading. Greene’s model is developed 85
based on STM and can predict the behavior until peak load. Also, both the previous MCFT and STM 86
approaches were iterative and ignored the bi-directional stress effects. Recently, Silva et al. (2017) adopted 87
an optimization technique for solving the system of equations for analyzing the behavior of concrete 88
members. Adopting such optimization technique significantly reduces the computation time in the case of 89
multiple variables in the system. Developing a more sophisticated SMM theory for combined loading 90
analysis and solving the system by adopting an optimization technique is the focus of this study.
91 92
RESEARCH SIGNIFICANCE AND OBJECTIVES 93
Only limited analytical models are available for predicting the response of rectangular RC members 94
subjected to combined loading including torsion. This study presents an improved and robust combined 95
action softened membrane model (CA-SMM) for the analysis of rectangular RC members. To include the 96
effects of combined actions, the cross-section of the concrete member is modeled as an assembly of four 97
shear panels. The equations satisfying the equilibrium and compatibility conditions between the panels are 98
developed. Solving the nonlinear set of equations using trial and error is tedious especially in the case of 99
combined loading. In this study, an optimization technique namely gradient descent method is adopted to 100
solve the CA-SMM system of non-linear equations rather than conventional trial and error approach. In 101
particular, the following advancements are made in the CA-SMM model developed in this study:
102
1. Sophisticated softened membrane based model is adopted for analyzing the behavior of RC 103
members subjected to combined shear and torsion loading.
104
2. The effect of bi-directional stress (Poisson’s effect) is considered in the formulations of CA-SMM 105
for improved post-peak predictions.
106
3. An improved tension stiffening effect model is used to account for the strain gradient effect.
107
4. A robust optimization based solution algorithm is proposed for significantly reducing the 108
computational time involved in the analysis of RC members under combined actions including 109
torsion.
110 111
COMBINED ACTION-SOFTENED MEMBRANE MODEL (CA-SMM) 112
Assumptions of the model 113
The improved CA-SMM model makes the following assumptions for satisfying the equilibrium and 114
compatibility conditions. The assumptions made are related to the modeling of geometry, strain profile, and 115
various material aspects as given below:
116
i. The rectangular cross-section is divided into four RC shear panels. The overall distribution of stresses 117
across the section are consolidated into four stress states, and each panel corresponds to a particular 118
stress state.
119
ii. The concrete member is assumed to act as a truss after cracking, i.e., concrete in diagonal struts is 120
assumed to resist the compression stresses, steel in longitudinal and transverse directions resist the 121
tensile stresses.
122
iii. The externally applied loads on the member are distributed to each of the panels as uniform normal 123
and shear stresses.
124
iv. The model neglects the dowel action of the reinforcement and assumes a perfect bond between 125
concrete and reinforcement.
126
v. Bredt’s thin tube theory is considered for satisfying the torsion equilibrium at the sectional level. In 127
case of solid sections, the core of the member does not contribute to the torsional resistance and 128
therefore, neglected as per this theory.
129
The assumption of a concrete member acting as a truss is valid for a cracked RC member. The behavior of 130
the concrete member is known to be linear until cracking. The stress and strain at cracking can be calculated 131
from the expressions given by Collins and Mitchel (1991). The behavior is linear until cracking, and the 132
post-cracking behavior is predicted using the proposed CA-SMM theory.
133
The idealization of RC cross-section:
134
A rectangular RC section can be idealized as a thin-tube, assuming the shear stress due to torsion to be 135
constant over the thickness of the thin-tube. The centreline of the shear flow zone in a rectangular cross- 136
section has dimensions of byb0, and a constant thickness of td i, along each side as shown in Fig. 2. The 137
modeled thickness of each panel is the depth of the shear flow zone td in that panel. The width of panels 138
1 and 3 ish0, and b0for panels 2 and 4. The cross-sectional area of a panel (𝐴𝑜) is equal to a product of 139
its modeled width and thickness. The idealised 𝑏𝑜, ℎ𝑜, 𝐴𝑜 and 𝑝𝑜 are calculated using Eq. 1, formulated by 140
Greene and Belarbi (2009). The panel dimensions used to analyse the cross-section and the cross-sectional 141
area of panel one is shown in Fig. 2.
142
𝑏𝑜= 𝑏 − (𝑡𝑑,1+𝑡2 𝑑,3) (1a) 143
ℎ𝑜 = ℎ − (𝑡𝑑,2+𝑡2 𝑑,4) (1b) 144
𝐴𝑜= 𝑏𝑜ℎ𝑜 (1c) 145
𝑝𝑜= 2(𝑏𝑜+ ℎ𝑜) (1d) 146
The longitudinal and transverse reinforcement in the section also has to be distributed among the shear 147
panels. If the sections have symmetrical reinforcement, then longitudinal steel and transverse steel are 148
distributed equally among all the shear panels. The transverse reinforcement is distributed equally among 149
all the shear panels as it is symmetric for all the specimens adopted in the current study. The longitudinal 150
steel area is assigned to that shear panel in which the longitudinal bar is located. In the cases of overlap of 151
steel area between two shear panels, it is distributed as a function of the width of the shear panels that are 152
overlapping. A detailed account of the distribution of longitudinal reinforcement can be obtained from 153
Greene and Belarbi (2009).
154 155
Equilibrium equations 156
The applied external loads are distributed as normal, and shear stresses on the membrane element. Fig. 3 157
depicts the stress state at the element level. The normal stresses are distributed among the concrete and steel 158
components of membrane element. The principle of transformation is used for determining the stresses in 159
principal directions 1 and 2, making an angle 𝛼𝑖 with 𝑙-direction. It is worth mentioning that SMM is based 160
on fixed angle theory. More details on fixed angle theory can be found elsewhere (Hsu and Zhu 2002, 161
Ganganagoudar et al. 2016). The cracks are assumed to occur in the principal directions of RC composite 162
element. The crack angle in the concrete element will be different as it is subjected to shear stresses. The 163
equilibrium equations (Eqs. 2-4) of membrane element can be derived using the principle of transformation.
164
The planes of primary interest in the membrane element are the principal planes (1-2 planes) and the planes 165
in which loads are applied (L-T planes), as shown in the Fig. 3.
166 167
𝜎𝑙,𝑖 = 𝜎2𝑐,𝑖𝑐𝑜𝑠2𝛼𝑖+ 𝜎1𝑐,𝑖𝑠𝑖𝑛2𝛼𝑖+ 2𝜏12𝑐,𝑖𝑠𝑖𝑛𝛼𝑖𝑐𝑜𝑠𝛼𝑖+ 𝜌𝑙𝑓𝑙 (2) 168
𝜎𝑡,𝑖= 𝜎2𝑐,𝑖𝑠𝑖𝑛2𝛼𝑖+ 𝜎1𝑐,𝑖𝑐𝑜𝑠2𝛼𝑖− 2𝜏12𝑐,𝑖𝑠𝑖𝑛𝛼𝑖𝑐𝑜𝑠𝛼𝑖− 𝜌𝑡𝑓𝑡 (3) 169
𝜏𝑙𝑡,𝑖= ((−𝜎2𝑐,𝑖+ 𝜎1𝑐,𝑖)𝑠𝑖𝑛𝛼𝑖𝑐𝑜𝑠𝛼𝑖+ 𝜏12𝑐,𝑖(𝑐𝑜𝑠2𝛼𝑖− 𝑠𝑖𝑛2𝛼𝑖)) . 𝑠𝑖𝑔𝑛(𝑞𝑖) (4) 170
171
The shear flow due to torsional loading is constant along the cross-section. The applied shear loads are 172
distributed in accordance with the direction of load application as shown below in the Fig. 4. The shear load 173
is added to loads on one of the panels and is subtracted from the other panel due to combined shear and 174
torsion loading (Fig. 4). Eq. 5 (Rahal and Collins 1995, Greene and Belarbi 2009) gives the net shear flow 175
(qi) in each panel.
176
𝑞1= 𝑇𝑥
2𝐴0+ 𝑉𝑦
2ℎ0 (5a) 177
𝑞2= 𝑇𝑥
2𝐴0+ 𝑉𝑧
2𝑏0 (5b) 178
𝑞3= 𝑇𝑥
2𝐴0− 𝑉𝑦
2ℎ0 (5c) 179
𝑞4= 𝑇𝑥
2𝐴0− 𝑉𝑧
2𝑏0 (5d) 180
181
Bredt’s thin tube theory:
182
When torsion acts on an RC member, it induces shear stress within the member. Bredt’s thin tube theory 183
assumes that the applied torsion is resisted by the shear stresses developed across a tube of thickness known 184
as shear flow depth. The elastic shear stress distribution varies linearly across the section with maximum 185
stress at the surface and reaches zero at the center. However, Bredt’s thin tube theory assumes the stress 186
distribution to be constant across the depth of thin tube as shown in Fig. 5. The relation between the external 187
torque and shear flow is given by Bredt’s thin tube theory, as in Eq 6.
188
𝑇𝑥 = 𝑞 [2(𝑏0
2 ℎ0+ ℎ0
2 𝑏0)] (6𝑎) 189
From the Fig. 6 (Hsu 1993), the integration around the cross section gives twice the area inscribed by shear 190
flow region:
191
[2(𝑏0
2 ℎ0+ ℎ0
2 𝑏0)] = 2𝐴0 192
𝑇𝑥 = 2𝐴0𝑞 (6b) 193
Compatibility equations:
194
The equations of compatibility (Eqs. 7-10) are derived using the principle of transformation (Hsu and Zhu 195
2002). In-plane strain compatibility should be satisfied for all the membrane elements.
196
𝜀𝑙,𝑖 = 𝜀2,𝑖𝑐𝑜𝑠2𝛼𝑖+ 𝜀1,𝑖𝑠𝑖𝑛2𝛼𝑖+ 𝛾12,𝑖𝑠𝑖𝑛𝛼𝑖𝑐𝑜𝑠𝛼𝑖 (7) 197
𝜀𝑡,𝑖 = 𝜀2,𝑖𝑠𝑖𝑛2𝛼𝑖+ 𝜀1,𝑖𝑐𝑜𝑠2𝛼𝑖− 𝛾12,𝑖𝑠𝑖𝑛𝛼𝑖𝑐𝑜𝑠𝛼𝑖 (8) 198
𝛾𝐿𝑇,𝑖 = (2(−𝜀2,𝑖+ 𝜀1,𝑖)𝑠𝑖𝑛𝛼𝑖𝑐𝑜𝑠𝛼𝑖+ 𝛾12,𝑖(𝑐𝑜𝑠2𝛼𝑖− 𝑠𝑖𝑛2𝛼𝑖)). 𝑠𝑖𝑔𝑛(𝑞𝑖) (9) 199
𝜀𝑡,𝑖 = 𝜀2,𝑖+ 𝜀1,𝑖− 𝜀𝑙,𝑖 (10) 200
201
The equations of compatibility are derived at the section level by imposing the strain compatibility 202
requirement at the center of the cross-section. It is assumed that shear stress due to combined shear flows 203
from an applied torsion and shear acts as a uniformly distributed shear stress, LT, over the thickness of the 204
shear flow zone. Eq. 11 gives the curvature of the concrete strut of each panel.
205 206
𝛹𝑖 =−𝜀𝑡̅̅̅̅̅̅2𝑠,𝑖
𝑑,𝑖 (11)
207
The thickness of shear flow zone (𝑡𝑑,𝑖) is calculated using a simplified expression given by Ganganagoudar 208
et al. (2016), as given below 209
𝑡𝑑,𝑖 = −𝜀̅̅̅̅̅̅𝛹2𝑠,𝑖
𝑖 (≤ 𝑏𝑜
2) (12a) 210
𝛹𝑖 = 𝜃sin (2𝛼𝑖) (12b) 211
𝐻𝑖 = 𝛾 4𝜀̅̅̅̅̅2,𝑖
𝐿𝑇,𝑖sin (2𝛼𝑖) (12c) 212
𝑡𝑑,𝑖 = 2(𝐻+4)1 [𝑃𝑐(1 +𝐻2) − √(1 +𝐻2)2− 4𝐻(𝐻 + 4)𝐴𝑐] (12d) 213
where 𝜃 = [(𝛾𝐿𝑇,1+ 𝛾𝐿𝑇,3)ℎ0+ (𝛾𝐿𝑇,2+ 𝛾𝐿𝑇,4)𝑏0]2𝐴1
0 (13) 214
The calculated shear flow depth 𝑡𝑑,𝑖 should be limited to the thickness of the wall in the case of hollow 215
specimen and should be limited to half of the depth of the idealized cross-section (𝑏𝑜
2) in the case of solid 216
cross-sections.
217 218
Constitutive laws:
219
The constitutive laws shown in Fig. [7, 8] are adopted in this study. The constitutive laws used in this study 220
are developed based on flat panels which are a 2D element (Vecchio and Collins 1986, Hsu 1993) and 221
includes the effects of softening and tension stiffening. Torsion is a 3-dimension problem. However, these 222
constitutive laws are the current state of the art. The evaluation of constitutive laws for a 3-dimension panel 223
is recently investigated by Labib et al. (2017). These constitutive laws for compression and tension based 224
on a warped 3-dimension panel, Poisson effect on these 3-D panels and their application for torsion are not 225
fully understood yet and is scope for further work.
226 227
Concrete in compression:
228
The presence of tensile cracks in principle compression plane causes softening of concrete struts. The 229
softening coefficient (𝜁) of concrete is a function of principle tensile strain (Vecchio and Collins 1986), 230
compressive strength (Zhang and Hsu 1998) and deviation angle (β). The softening co-efficient used by 231
Jeng and Hsu (2009), that accounts for all the above effects has been used in the present study. The concrete 232
compression law has been given in Eq. 14.
233
𝛽𝑖 = 12[𝑡𝑎𝑛−1(𝜀 𝛾12𝑐,𝑖
2𝑐,𝑖−𝜀1𝑐,𝑖)] (14a) 234
𝜁𝑖 = 5.8
√𝑓𝑐′ 0.9
√1+400𝜀̅̅̅̅̅̅2𝑐,𝑖 (1−𝛽240𝑖) (14b) 235
𝜎2𝑐,𝑖 = 𝐾2𝑐,𝑖 𝜁𝑓𝑐′ (14c) 236
𝐾2𝑐,𝑖 = [𝜀̅̅̅̅̅̅𝜁2𝑠,𝑖
𝑖𝜀0−3(𝜁𝜀2𝑠,𝑖2
𝑖𝜀0)2] for 𝜀̅̅̅̅̅̅𝜁2𝑠,𝑖
𝑖𝜀0 ≤ 1 (14d) 237
𝐾2𝑐,𝑖 = 1 − 3𝜀𝜁𝑖𝜀0
̅̅̅̅̅̅2𝑠,𝑖− 3𝜀1
̅̅̅̅̅̅2𝑠,𝑖[(𝜀(4𝜀̅̅̅̅̅̅− 𝜁2𝑠,𝑖 𝑖𝜀0)3
0− 𝜁𝑖𝜀0)2] for 𝜀̅̅̅̅̅̅𝜁2𝑠,𝑖
𝑖𝜀0 ≥ 1 (14e) 238
Concrete in tension:
239
The current study employs the tension stiffening relation used by Jeng and Hsu (2009) for modeling the 240
tension behavior of concrete. Fig. 9 shows the tension constitutive law of the concrete.
241
𝑓𝑐𝑟 = 0.652√𝑓𝑐𝑘 (15a) 242
𝐸𝑐 = 5620√𝑓𝑐𝑘 (15b) 243
𝜎1𝑐,𝑖 = 𝐸𝑐𝜀̅̅̅̅1,𝑖 for 𝜀̅̅̅̅̅𝜀1𝑠
𝑐𝑟 ≤ 1 (15c) 244
𝜎1𝑐,𝑖 = 𝑓𝑐𝑟(𝜀𝜀𝑐𝑟
̅̅̅̅̅1,𝑖)0.4
for 𝜀̅̅̅̅̅𝜀1𝑠
𝑐𝑟 ≥ 1 (15d) 245
246
Stress-strain relationship of steel:
247
The smeared stress-strain behavior of steel embedded in concrete as adopted by Jeng (2009) and 248
Ganganagoudar et al. (2016) in the previous SMMT formulations is used in the present study (Fig. 9). In 249
the below equations, 𝑓𝑠,𝑖 represents both longitudinal and transverse steel.
250
𝑓𝑠,𝑖= 𝐸𝑠𝜀̅̅̅̅ for 𝜀𝑙.𝑖 ̅̅̅̅ ≤ 𝜀𝑙.𝑖 ̅̅̅̅̅ (16a) 𝑙𝑛.𝑖 251
𝑓𝑠.𝑖= [(0.91 − 2𝐵𝑖) + (0.02 + 0.25𝐵𝑖)𝜀𝜀̅̅̅̅𝑙.𝑖
𝑙𝑦] for 𝜀̅̅̅̅ ≤ 𝜀𝑙.𝑖 ̅̅̅̅̅ (16b) 𝑙𝑛.𝑖 252
𝐵𝑖 = [(𝑓
𝑐𝑟⁄𝑓𝑙𝑦)1.5
𝜌𝑖 ] (16c) 253
𝜀𝑙𝑛.𝑖
̅̅̅̅̅ = 𝜀𝑙𝑦 ( 0.93 − 𝐵𝑖) (16d) 254
255
The constitutive relation for concrete in shear 256
The shear modulus is expressed as a function of normal stresses and strains in concrete element. The 257
relation is given in Eq. 17.
258
𝜏12𝑐,𝑖 = (−𝜎2(𝜀2𝑐,𝑖+ 𝜎1𝑐,𝑖)
1,𝑖−𝜀2,𝑖) 𝛾12𝑐,𝑖 (17) 259
260
Poisson’s effect in SMMT:
261
Stresses in one direction can result in the development of stresses in its perpendicular direction due to 262
Poisson’s effect. This Poisson’s ratio is considered in the formulation of CA-SMM. The strain in one 263
direction is not only a function of stress in its direction but will also depend on the stress in its perpendicular 264
direction. Zhu and Hsu (2002) investigated the Poisson’s ratio of shear panels experimentally and proposed 265
a parameter called Hsu/Zhu ratio, which quantifies the bi-directional stress effect. Hsu/Zhu ratio relates the 266
strains and bi-directional stresses as given in equation 17.
267 268
𝜀1 = 𝜎𝐸1𝑐
1𝑐− 𝜐12𝜎𝐸2𝑐
2𝑐 (17a) 269
𝜀2 = 𝜎𝐸2𝑐
2𝑐− 𝜐21𝜎𝐸1𝑐
1𝑐 (17b) 270
where 271
𝜐12 = (0.16 + 680𝜀𝑠𝑓) for 𝜀𝑠𝑓 ≤ 𝜀𝑦
(18a)
272𝜐12 = 1.52 for 𝜀𝑠𝑓 ≥ 𝜀𝑦 273
𝜐21= 0 (18b) 274
275
Here, 𝜐12 is the strain increment in direction 1 for an applied unit strain in direction 2. Now, defining 276
uniaxial strains as 𝜀̅ = 1 𝜎𝐸1𝑐
1𝑐 and 𝜀̅ = 2 𝜎𝐸2𝑐
2𝑐 and re-writing the equation (17), the relation between uniaxial 277
strains and biaxial strains can be arrived.
278
𝜀1 = 𝜀̅ − 𝜐1 12𝜀̅1 (19a) 279
𝜀2 = 𝜀̅ − 𝜐2 21𝜀̅2
(19b) 280
After re-arranging the equations (19), one can get 281
𝜀̅ = 1 (1−𝜐𝜀1
12𝜐21)+(1−𝜐𝜐12𝜀2
12𝜐21) (20a) 282
𝜀̅ = 2 (1−𝜐𝜐21𝜀2
12𝜐21)+(1−𝜐𝜀1
12𝜐21) (20b) 283
The constitutive law of material relates stresses and uniaxial strains as given by equation (18).
284 285
OPTIMIZATION BASED GRADIENT DESCENT METHOD 286
An alternative and efficient procedure to the conventional trial and error method is used for solving the 287
system of equilibrium and compatibility equations in CA-SMM. Gradient descent method is a first-order 288
iterative optimization algorithm for finding the minimum of a multi-variable function. To solve for the local 289
minimum of a function, the subsequent iterations take steps in a direction negative to the gradient of the 290
function at the current point. The solution algorithm is described in detail in the following sections.
291 292
Primary Variables 293
The primary variables are the variables that are varied numerically until the objective functions are set to 294
zero. In the proposed algorithm, the primary variables are 𝑇𝑥, 𝜀2𝑠,𝑗,𝜀1,𝑖, and 𝛾12,𝑖 (j = 2,3,4 and i = 1,2,3,4).
295
𝜀2𝑠,1 of panel 1 is fixed for each step and is incremented until a concrete failure strain of -0.0035. The 296
primary variable 𝜀2𝑠,𝑗 is varied until the shear stresses 𝐹𝐶𝐴𝑆𝑀𝑀(𝑗) (j=2,3,4) of Eq. 21 are in agreement. The 297
equilibrium Eq. 2- 3 are summed and subtracted to get the set of objective functions 𝐹𝐶𝐴𝑆𝑀𝑀(𝑖 + 8) and 298
𝐹𝐶𝐴𝑆𝑀𝑀(𝑖 + 12), whose primary variables are chosen as 𝜀1,𝑖 and 𝛾12,𝑖, respectively.
299 300
Residual Equations and Objective function 301
The set of equations of the model that has to be solved are developed from the equilibrium and compatibility 302
conditions as explained in earlier sections. This set of equations that has to be solved are called residual 303
equations as given in Eq. 21.
304
[
𝐹𝐶𝐴𝑆𝑀𝑀(1) 𝐹𝐶𝐴𝑆𝑀𝑀(𝑗) 𝐹𝐶𝐴𝑆𝑀𝑀(𝑖 + 8) 𝐹𝐶𝐴𝑆𝑀𝑀(𝑖 + 12)]
=
[
𝜏𝑙𝑡,1− 𝑞1
𝑡𝑑,1
⁄
𝜏𝑙𝑡,𝑗− 𝑞𝑗
𝑡𝑑,𝑗
⁄
(𝜌𝑙𝑓𝑙+ 𝜌𝑡𝑓𝑡)𝑖− ((𝜎𝑙,𝑖+ 𝜎𝑡,𝑖) − (𝜎2𝑐,𝑖+ 𝜎1𝑐,𝑖))
(𝜌𝑙𝑓𝑙− 𝜌𝑡𝑓𝑡)𝑖 – ((𝜎𝑙,𝑖− 𝜎𝑡,𝑖) − (𝜎2𝑐,𝑖− 𝜎1𝑐,𝑖)𝑐𝑜𝑠2𝛼𝑖+ 2𝜏12𝑐,𝑖𝑠𝑖𝑛2𝛼𝑖)]
(21) 305
The above set of equations are compactly represented as 𝒇(𝒙) = 0 . 306
where 𝒙 is a vector of primary variables taken as 𝒙 = {𝑇𝑥, 𝜀2𝑠,𝑗,𝜀1,𝑖, 𝛾12,𝑖}. (where j = 2,3,4 and i = 1,2,3,4). In 307
conventional way of solving, the function 𝒇(𝒙) is solved by trial and error way of varying primary variables. It 308
is very tedious and time consuming. In the present study, the set of equations of the model are solved by 309
adopting an optimisation technique (Gradient descent method). Instead by directly solving for 𝒇(𝒙) = 0, we 310
will minimise the objective function “𝐽”. The objective function “𝐽” is the norm of the function 𝒇(𝒙), as defined 311
in Eq. 22.
312
𝐽 = 12(𝒇𝑇(𝒙). 𝒇(𝒙)) (22) 313
The scalar output given by the objective function at every step is called a residue. The residue is zero only when 314
each of the residual functions 𝑓1(𝒙), 𝑓2(𝒙) …𝑓12(𝒙) is zero. The value of primary variables gets updated for 315
each step as per gradient descent method as given in Eq. 23.
316
𝒙+ = 𝒙−− 𝛾𝜕𝐽𝜕𝒙 (23) 317
where 𝛾 is chosen as a small incremental decimal value such that 𝐽(𝒙+) < 𝐽(𝒙−) . 318
The characteristic of residue (𝐽) at a fixed value of 𝜀̅̅̅̅̅̅ for specimen tested by Klus (1968) is shown in 2𝑠,1 319
Fig. 10, till the objective function reaches a tolerable value. The tolerance for Klus specimen has been set 320
a value of 1𝑒−3 after 5700 steps (Fig. 10). By moving towards the minimum of the objective function (𝐽) 321
at each step, the residue (𝐽) decreases. The optimal minimum solution within the tolerant limits is obtained 322
by minimising the objective function.
323 324
Solution procedure 325
The proposed solution algorithm is explained in Fig. 11. The solution algorithm is executed using a program 326
developed and executed in the software MATLAB. The geometry of the member cross-section, the 327
equivalent longitudinal and transverse reinforcement in each panel, the mechanical properties for the 328
concrete and steel, the ratios of the internal acting forces to the torsional moment (NX/TX, VY/TX, VZ/TX) 329
and the initial strain 𝜀2𝑠,1, are known or assumed to start with. The unknown variables 𝑇𝑥, 𝜀2𝑠,𝑗,𝜀1,𝑖, and 330
𝛾12,𝑖 (j = 2,3,4 and i = 1,2,3,4) are determined by solving the nonlinear system of twelve equations 𝒇(𝒙) = 331
0. For these system of equations, the residue of the objective function (𝐽) should be within an acceptable 332
tolerance. This is formulated as a nonlinear least-squares problem, where FCA–SMM, Eq. (21) are the residual 333
equations.
334 335
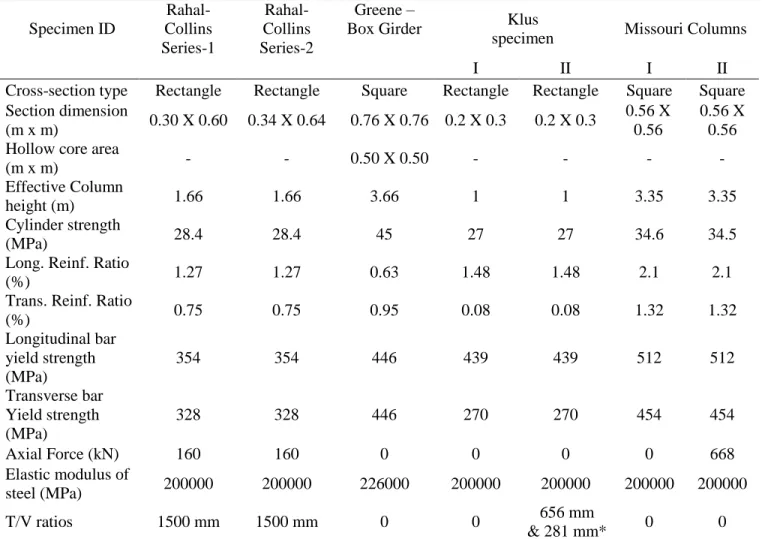
EXPERIMENTAL VALIDATION 336
The proposed solution algorithm is validated using experimental data obtained from the literature. Prakash 337
et al. (2010, 2012) conducted experiments on RC columns subjected to torsion. Li (2013) tested square 338
columns with torsion and axial loads. Columns tested by Prakash and Belarbi (2010) and Li et al. (2013) 339
are denoted as Missouri columns. Rahal and Collins (1993) and Klus (1968) tested RC beams under 340
combined torsion and shear loading. The data of following RC members are used in validation of the CA- 341
SMM model proposed in this study: Missouri-1 (Pure Torsion); Missouri 2 (Torsion + Axial); one RC 342
square girder of Greene (Pure Torsion); two beams tested by Rahal and Collins (Torsion + Shear + Axial) 343
and three beams tested by Klus (one in Pure Torsion and two in Torsion + Shear). The details of all these 344
specimens are given in Table 2. Cross sections of specimens are shown in Fig. 12.
345 346
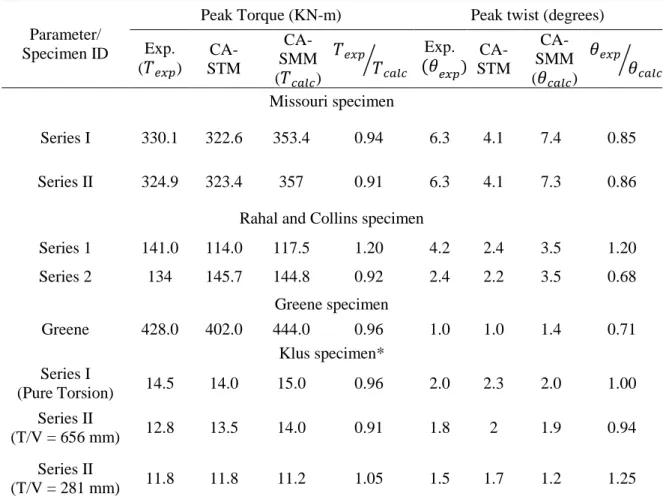
Torque – Twist Behavior:
347
The torque-twist behavior of the specimens under different load combinations is shown in Fig. 13. The 348
behavior is linear until cracking. The stiffness reduces considerably after the peak torque. The peak torque 349
and the corresponding twist are captured reasonably well by the CA-SMM. The proposed model predicted 350
the peak torque and twist more accurately for the specimen of Missouri, Rahal, and Collins while the results 351
of CA-STM are close to experimental peak values of Greene’s and Klus specimen. However, it can be 352
observed from the Table 3 that the predictions in the peak torque and peak twist predictions of CASTM and 353
CASMM are very close. The observed behavior until cracking is similar to the torsional response of plain 354
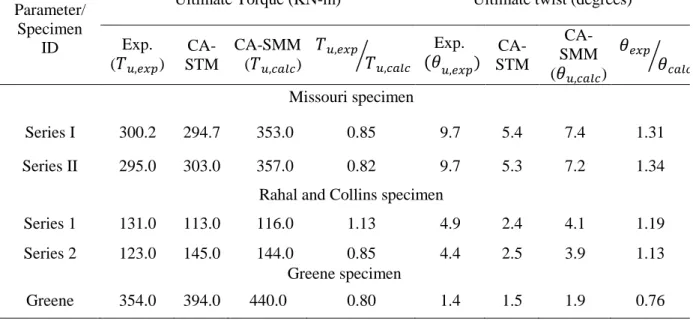
concrete elements as observed by Karayannis and Chalioris (2013). Comparison of predictions is provided 355
in Table 3 and Table 4. Table 3 presents the comparison of values of peak torque and twist values. Table 4 356
presents the comparison of values of ultimate torque and corresponding ultimate twist values. It is evident 357
that the response predicted by the CA-SMM is better in the post-cracking regime and close to the 358
experimental peak values. It is observed that due to consideration of bi-axial stress effects, CA-SMM 359
predicts the ultimate torque values with fair accuracy. The ultimate twist values predicted by the CA-SMM 360
are close to experimental values. Specimens considered for analysis had the following failure progression:
361
shear cracking followed by yielding of transverse reinforcement and the longitudinal reinforcement 362
respectively. All the specimens finally failed by crushing of the concrete under diagonal compression. The 363
same failure progression was observed in the predictions of CA-SMM. The strain distribution in the steel 364
for the specimens is shown in Figs. [14-15]. The parametric study also depicts that the effect of transverse 365
steel on torsional behavior is very significant when compared to any other sectional parameters.
366 367
Distribution of Strains in Reinforcement:
368
Predictions of behavior at the local level, i.e. the distribution of strains in reinforcement are analyzed using 369
CA-SMM. Variation of strain in longitudinal and of transverse steel reinforcement with change in applied 370
torque are presented in Figs. 14 &15. It is worth mentioning that the strains predicted by the model are 371
smeared strains. The strains are calculated as an average of all the strains smeared across the number of 372
cracks. Before the onset of cracking in the concrete, the contribution from reinforcement is negligible. After 373
cracking, steel reinforcement gets engaged and starts contributing to the load resistance. Moreover, the 374
transverse reinforcement is known to be a prime contributor in resisting shear, and torsional loads and the 375
same is reflected in the predictions (Figs. 14,15). It can be observed that at any given loading level, the 376
strains in the transverse steel reinforcement is higher than that of strains in the longitudinal steel. Due to 377
unavailability of experimental data pertaining to the longitudinal and transverse strains, only the analytical 378
predictions are presented in the Fig. [14-15]. When the section is subjected to the combined loading of 379
torsion and shear as shown in the direction as represented in Fig. 4, the shear flow due to torsion and shear 380
gets added up in panel 3 and gets subtracted in panel 1. The shear flow in the panels 2 and 4 are only due 381
to torsion and are not affected by the applied shear in Y-direction. It is due to this difference in the shear 382
flow that the strains are different in each of the panels for the specimen that are loaded with torsion and 383
shear (Fig. 15). The strains predicted by the model are observed to be increasing smoothly with an increase 384
in the level of torsional loading. Steel in the transverse direction is the key component of resisting shear 385
and torsion. It is expected typically that the strains in the transverse direction increase till the loading 386
reaches peak value and decreases after that (Ganganagoudar et al. 2016, Prakash et al. 2012). The model 387
is capable of capturing the same trend of strain variations in accordance with the expectation, that in Fig.
388
15 the transverse strains were increasing smoothly till the peal load is reached and decreased after that.
389 390
The interaction between torsion and shear loads 391
The torsion and shear loads are distributed as shear stresses at the element level. Therefore, the presence of 392
any external shear loads directly influences the shear flow (𝑞𝑖) of the cross-section. The presence of shear 393
load either increases or decreases the shear flow in the panels depending on its direction of application. The 394
effect of shear load and torsion on shear flow has been quantified through Eq. (5). The developed algorithm 395
has been used for developing these interaction diagrams of torsion and shear. Fig. 16 depicts the validation 396
of predicted interaction with that of the experimental data of specimens tested by Rahal and Collins and 397
Klus. The results predicted by the algorithm are in good agreement with the experimental results.
398 399
Parametric studies using CA-SMM 400
The effect of transverse reinforcement ratio (𝜌𝑡), longitudinal reinforcement ratio (𝜌𝑙) and concrete strength 401
(𝑓𝑐𝑘 ) on the behavior of specimens are investigated by carrying out a detailed parametric study and shown 402
in Fig. 16. The torsion shear interaction curves are plotted for the Rahal and Collins series 2 specimen by 403
varying the parameters (𝜌𝑙, 𝜌𝑡𝑎𝑛𝑑 𝑓𝑐𝑘). Torsion (T) and shear (V) interaction curves are presented in Fig.
404
16. Transverse reinforcement is a key element in resisting the shear loads. Therefore, the increase in 405
transverse reinforcement ratio directly increases the torsional capacity of the specimen. The parametric 406
study of varying concrete compressive strength and longitudinal reinforcement ratio for predicting the 407
torsion shear interaction is also presented in Fig. 16. The variation in torsional capacity with respect to the 408
variation of longitudinal reinforcement is observed to be marginal and insignificant.
409 410
SUMMARY AND CONCLUSIONS 411
A robust algorithm is used in this study for predicting the behavior of RC members subjected to different 412
combinations of torsion, shear and axial loads. The set of equations of CA-SMM are employed by modeling 413
the geometry of section as an assembly of four shear panels. The accuracy in predictions can be improved 414
by increasing the number of panels and by establishing compatibility conditions among the panels, but this 415
occurs at the cost of a significant increase in computation time. Also, the inclusion of bending effects 416
(Ewida and McMullen 1981, Rahal 2007) and prestress effects (Karayannis et al. 2000) would also be 417
interesting. The bending effects can be included by altering the longitudinal strain variable in the solution 418
algorithm and is scope for future work. It is also to be noticed that the constitutive laws adopted in the 419
model are derived based on 2-dimensional flat panels. Since torsion is a 3-dimensional problem, it causes 420
the walls of the member to warp. However, the constitutive laws for warped 3-dimensional elements are 421
not established yet. Currently researchers (Labib et al., 2017) are focusing in the direction to establish the 422
constitutive laws of concrete based on 3-dimensional panels. It is referred to future work that the results 423
can be refined accurately by adopting constitutive laws that are developed based on a 3-dimensional panel.
424
Based on the results presented in this study, the following major conclusions can be drawn:
425
1. An improved analytical model is proposed for predicting the response of the RC rectangular members 426
using softened membrane model at the element level analysis. The predictions from the analytical 427
model were in agreement with the experimental results.
428
2. For combined shear and torsional loading, the inclusion of Poisson’s effect and strain gradient effect 429
resulted in improved torque twist predictions and strain variations in the reinforcement.
430
3. Transverse reinforcement plays a key role in improving the overall torque – twist performance of RC 431
members under combined torsion and shear loading. It is observed that the reinforcements in panel 3 432
(torsion and shear as additive) experienced higher strain levels than the other individual panels.
433
4. A detailed parametric investigation considering the effect of concrete strength and various steel 434
reinforcement ratio under combined shear and torsion loading was carried out. Results indicate that the 435
transverse reinforcement plays a major role in the load resistance when compared to longitudinal 436
reinforcement ratio and concrete strength under all combinations of torsion and shear loading.
437
Acknowledgements 438
This analytical work is carried out as part of the project funded by SERB, Department of Science and 439
Technology, India. Grant No. SB/S3/CEE/0060/2013 and FAST center of excellence for sustainable 440
development at IIT Hyderabad. Their financial support is gratefully acknowledged.
441 442
Notations:
443
The notations used in the paper are:
444
𝐴𝑙 The total cross-section area of longitudinal steel bars 𝐴𝑡 The cross-section area of transverse steel bar
𝐴𝑜 The core area of the idealized cross-section
B Variable as defined in the constitutive relation of steel bar 𝑏 Breadth of the actual cross-section
𝑏𝑜 Breadth of the idealised cross-section 𝐸𝑐 Modulus of elasticity of concrete 𝐸𝑠 Modulus of elasticity of steel