This criterion considers the local mobility of the eigenvectors and is used to remove motion artifacts from single-channel EEG signals. 88 6.7 Dominant frequencies (fd) of the estimated eigenvectors ofu for SN R= 1. c) EEMD and (d) proposed SSA technique.
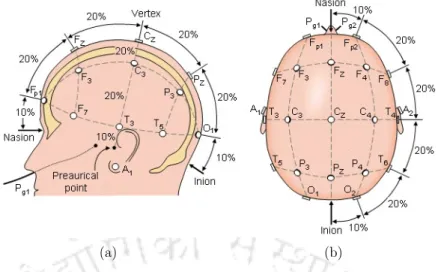
Basics of Electroencephalogram (EEG) Signals
Rhythmic Components of EEG Signals
Moreover, they are very prominent in the occipital region and appear as oscillatory components in the 8−12 Hz frequency band. Delta (δ) rhythms: These are low frequency rhythmic signals and are usually generated in dreamless or deep sleep.
Artifacts in EEG Signals
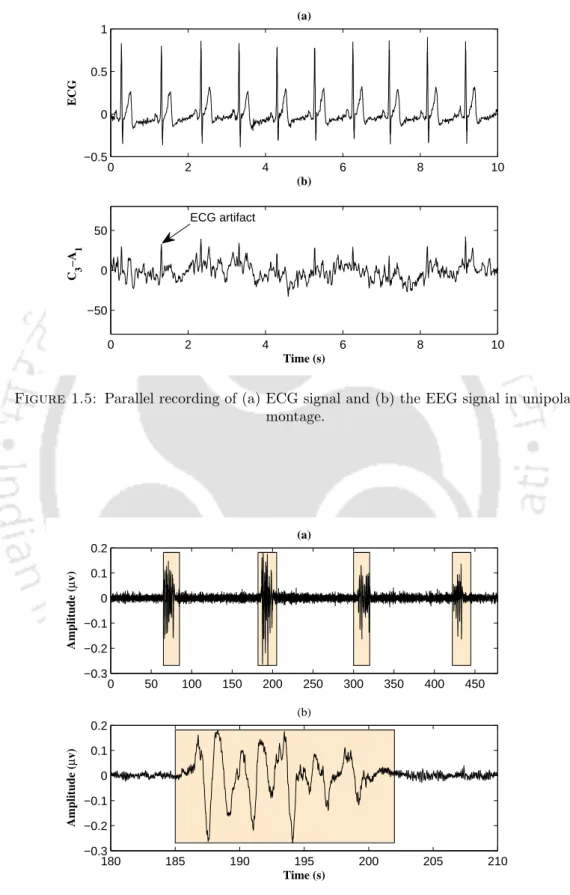
These artifacts were more predominant in the EEG signals obtained from the temporal channels (T7−P7 andT8−P8), as shown in Fig. Whereas the ECG artifact could be clearly seen in the EEG signal when unipolar montage is used, and it is clearly seen in Fig. .
Applications of EEG signals
Literature Review on Artifact Removal Techniques
Multichannel EEG signals
Notably, this technique is more effective in removing EOG artifact from multichannel EEG signals [38–41]. The main difference between CCA and ICA is that the former estimates resources based on second-order statistics (SOS), while the later uses HOS of the data.
Single Channel EEG signals
Generally, the reference EOG signal is recorded from the eye using additional electrode. Furthermore, since SSA is data-driven technique, the performance is independent of the morphology of the EOG artifact.
Outline of the Thesis
Independent Component Analysis
ICA algorithms find the de-mixing B with the bij elements taking into account the statistical independence of the signal. This algorithm finds the de-mixing matrix B based on the non-Gaussianity of the sources to be extracted [90].
Canonical correlation analysis
To demonstrate the performance of the CCA algorithm, we have considered multichannel EEG data contaminated with muscle artifacts, as shown in Fig. Finally, muscle artifact-corrected EEG signals are obtained by multiplying the canonical components by the inverse of the de-mixing matrix W, whose columns are the eigenvectors derived using (2.4).
![Figure 2.4: Ten second multichannel EEG epoch recordings contaminated by muscle artifacts [6]](https://thumb-ap.123doks.com/thumbv2/azpdfnet/10344558.0/32.893.177.751.176.1086/figure-second-multichannel-epoch-recordings-contaminated-muscle-artifacts.webp)
Methods for Processing Single channel EEG signals
- w-ICA
- EEMD-ICA/CCA
- Adaptive noise canceler
- Singular spectrum analysis
Unlike basic ICA, where the matrix mixes the sources in different channels (see Fig. 2.1), in the case of source separation from single-channel signals, it is assumed that the mixing matrix A mixes the sources into different decomposed components. Using either least mean square (LMS) or recursive least square (RLS) algorithms [77], the weights of the adaptive filter are updated.

Conclusion
Then, a new clustering criterion for SSA is introduced and its performance in motion object removal from single-channel EEG signal is evaluated. Recently, in [98], a combined EEMD and CCA technique, namely EEMD-CCA, has been proposed to remove motion artifact from a single-channel EEG signal.
A New grouping criteria for SSA
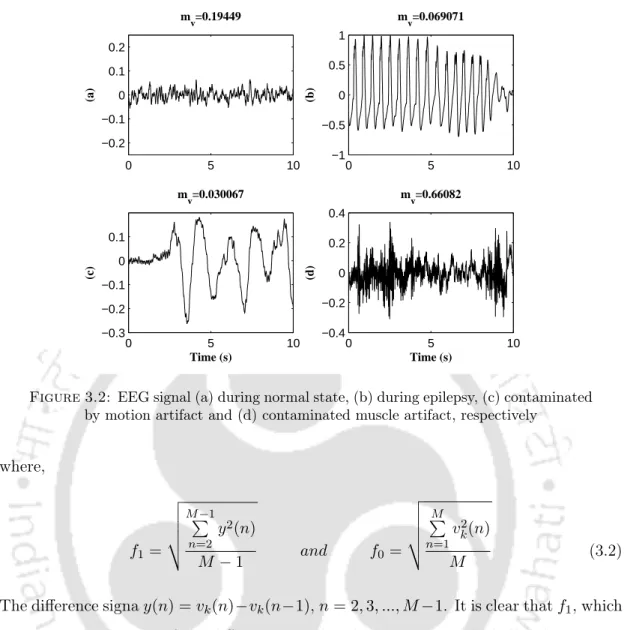
In addition, the mobility of the EEG signal is even less when it is contaminated by motion artifacts. It is noticeable that when the EEG signal is contaminated by motion artifacts, its value is very small compared to the EEG signal in other conditions. Therefore, we assume that the local mobility of the eigenvector associated with the motion artifact is small compared to the eigenvector associated with the EEG.
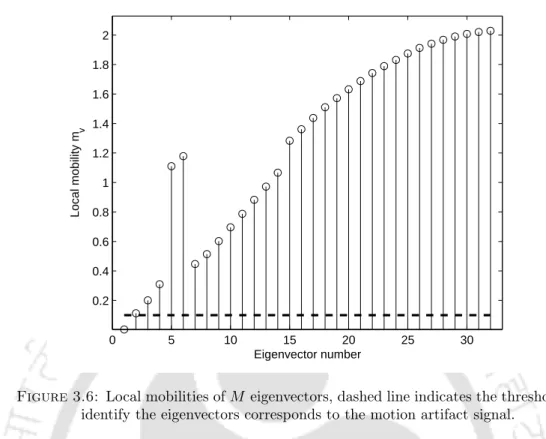
In other words, the local mobility of the eigenvectors associated with artifact (low for motion and eyeblink artifacts) is small, and it is increased for eigenvectors associated with the EEG signal.
Simulation Studies
Performance measures
To quantify the ability of the proposed modified SSA technique in removing motion artifact from a single-channel EEG signal, we consider two performance measures, namely the difference in the signal-to-noise ratio ∆SN R and the artifact reduction percentage η. Here, the error signal is the difference between the contaminated and the true ground EEG signal. However, this depends on how well the artifact removal technique estimates the motion artifact signal.
Therefore, we tested the proposed modified SSA technique on residual object-contaminated single-channel EEG records21 in which the α component of the EEG signal was recorded.

Computational complexity Analysis
The evaluation of the last step of the proposed modified SSA requires O(NM) calculations to map the estimated trajectory matrix in a single channel signal. To compare the computational complexity of the proposed modified SSA technique with EEMD-CCA, we define the free parameters Ne, Ns, Nymph and J as the number of ensembles, the number of sieving operations, the number of IMFs and the number of observations. Finally, the overall computational complexity of EEMD-CCA is equal to the sum of individual complexities of both EEMD and CCA.
Although CCA reduces the computational complexity three times compared to the proposed modified SSA technique, CCA alone cannot be used for single-channel signal analysis.
Conclusion
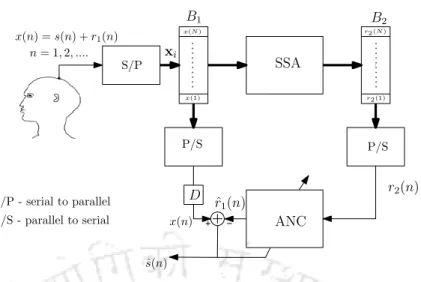
Extraction of EOG reference signal for ANC
In MDL, criteria have been proposed to automatically identify the subspace of the EOG signal. However, such criteria impose constraints that the energy of the signal of interest must be high and it must be a well-defined signal. This is due to the fact that the location of the EEG electrode is far from the location of the eye.
So, under such conditions, the use of MDL criteria gives a false estimate of the dimension of the EOG signal subspace.
Real Time Implementation of Proposed SSA-ANC Technique
After adding all the trajectory matrices, representing the EOG signal, the resulting trajectory matrix is mapped into single channel EOG signal vectorr2 = [r2(1), r2(2), .., r2(N)]. After the reference EOG signal is estimated using SSA, the contaminated EEGx and the extracted EOG signal vectors r2 are fed to primary and reference inputs of the ANC, respectively. With the advancement in the technology, the sum of the computation time of SSA and adaptive filter is less than the sampling interval Ts.
Therefore, the proposed technique is feasible for online removal of EOG artifacts from single-channel EEG signal.
Simulation Studies
Comparative Study of MDL and New Grouping Criteria in the
Using the MDL and the local mobility criteria as clustering techniques, SSA is applied to the single-channel contaminated EEG signal and estimates the EOG artifact. C3 and C4, the contribution of EOG artifact is small in magnitude and thus the magnitudes of the eigenvalues associated with the EOG and EEG signals are not well clustered. The MDL criteria therefore fail to find the subspace of the EOG artifact for higher SNRs.
Thus, the local mobility of the eigenvectors associated with the EOG artifact is small compared to the local mobility of the eigenvectors associated with the EEG signal.
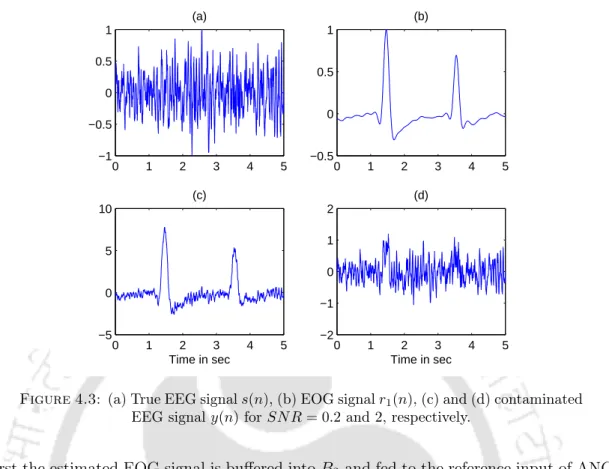
Simulation using Synthetic EEG signals
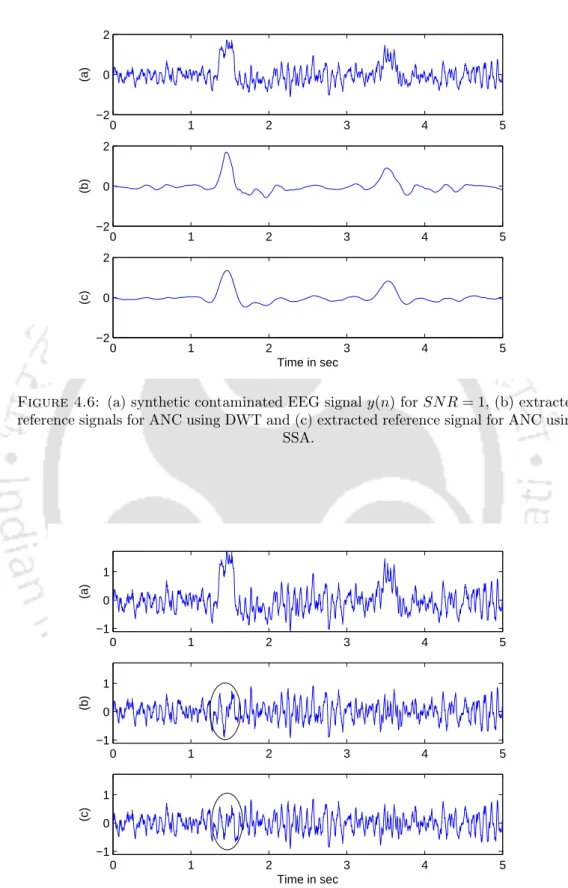
The RRMSE curves for the rectified EEG signals using DWT- ANC, the proposed SSA without ANC, and the proposed SSA-ANC techniques as a function of SN R are shown in Fig. Since the proposed SSA-ANC exhibits superior performance than SSA alone, in subsequent Simulations, the performance comparison of the proposed SSA-ANC is made with DWT-ANC. The corrected EEG signals by DWT-ANC and the proposed SSA-ANC techniques are shown in Figs.
4.7 (b) that the EEG signal corrected by the DWT-ANC technique deviates from the EEG signal.
Simulation Results using Real Life EEG Signals
The reconstructed reference and corrected EEG signals using the proposed SSA-ANC technique are shown in the figure. The effectiveness of the proposed SSA-ANC technique in removing the EOG artifact can be observed from the power spectral density (PSD) of the contaminated and corrected EEG signals, shown in Fig. Therefore, we can conclude that the proposed SSA-ANC technique does not change the EEGα component.
Once again the combination of the SSA-ANC technique enhances the EOG artifact removal capability.
Conclusion
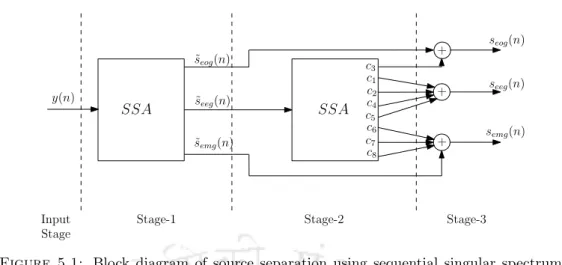
Proposed SSA-ICA Technique
In order to use ICA on the single-channel EEG signal, it must first be mapped to multiple data, then ICA can be applied. Therefore, we proposed a fully automatic decomposition procedure, where SSA is recursively applied to the single-channel EEG signal with a fixed window length, as shown in Fig. Again, SSA is applied to the low frequency component yl1(n) and decomposed into two components yh2(n)and2l(n).
As SSA decomposes the signal y(n) based on SOS, the decomposed components thus obtained are uncorrelated.
Decomposition of Single Channel Signal into Two Components us-
Since we are looking for the dominant frequency of the eigenvector, the model order for the burg method is set to 4[144]. However, since the eigenvectors are derived using the covariance of the data, they show multi-band responses. Since we group the eigenvectors according to their dominant frequency, the decomposed components obtained by SSA are therefore uncorrelated.
This is due to the fact that SSA uses the covariance of the data to derive the eigenvectors.
Simulation Studies
Application of proposed SSA-ICA technique on Synthetic Signals . 69
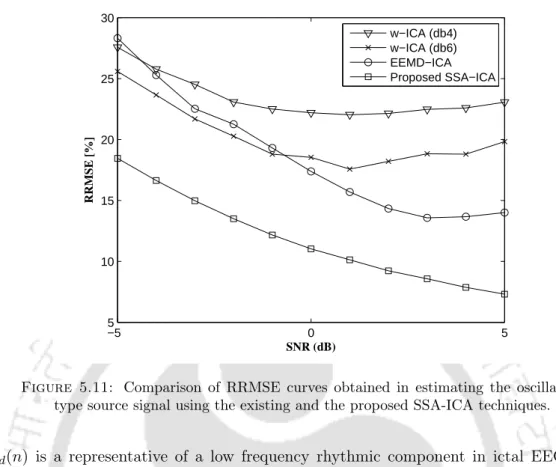
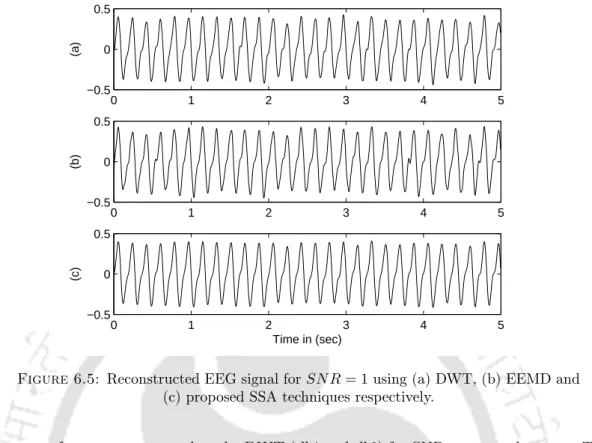
The number of decomposition levels for w-ICA and proposed SSA-ICA is set between 4 and 5. The correlation coefficient (CC) between sd(n) and sˆd(n) clearly shows that the proposed SSA-ICA technique maintains the shape of the desired source signal. In the case of the proposed SSA-ICA technique, the selection of parameter M does not depend on signal morphology and statistics.
From the above simulations, it is clear that unlike w-ICA and the EEMD-ICA, the choice of parameter M of proposed SSA-ICA technique does not depend on the morphology or the signal noise level.
Application of Proposed SSA-ICA Technique on Real Life EEG
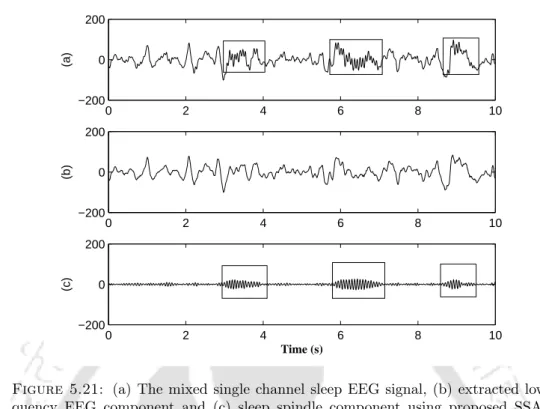
The estimated source signals of single channel EEG using w-ICA, EEMD-ICA and the proposed SSA-ICA techniques are shown in Fig. While the proposed SSA-ICA technique is able to separate the eyeblink and ictal activity components and turns out. Therefore, in second simulation study, we applied proposed SSA-ICA technique to single-channel EEG signal to extract the sleep spindle component.
The sleep spindle activity in the EEG signal (indicated in squares) is effectively isolated from the low frequency EEG components.
Conclusion
In the early stages of EEG signal processing, low-pass filters are often used to remove the muscle artifacts from EEG signals. ICA is often used to remove the muscle artifacts from the mixed multichannel EEG data [ 43 , 155 ]. In [55], CCA technique was proposed to remove the muscle artifacts from multichannel EEG data.
Chapter 6: Muscle Artifact Removal Technique for Efficient Seizure Detection 83 is proposed to remove muscle artifacts from the single-channel EEG signal.
Simulation Studies
Muscle Artifact Removal from Synthetic EEG Signals
Since most of the energy in the ictal EEG signal is concentrated in between 0.5Hz−16Hz band, Th for EEMD and the proposed SSA techniques is set to 16Hz. The decomposed sub-band signals of contaminated EEG signal using DWT in Fig. The sub-band signals and the corrected EEG signal used DWT in Fig.
The calculated correlation coefficients show that the corrected EEG obtained by the proposed SSA technique more closely resembles the real EEG signal.
Muscle Artifact Removal from Real Life EEG signals
The artifact-free EEG signal using DWT, EEMD and the proposed SSA decomposition techniques were shown in Fig. 6.1, MAE for the proposed SSA technique is −20.116dB, which is equally low compared to MAE of DWT and EEMD techniques. Finally, the proposed SSA technique is applied to each EEG channel signal, shown in Fig.
Initially, the proposed technique is used to remove the muscle artifact from the EEG signals recorded from the temporal domain.
Conclusion
In this thesis, we investigated different artifact removal techniques for single-channel EEG signals using SSA. To validate this technique, we first applied to remove motion artifacts from single-channel EEG signals. Chapter 5 discussed the steps to process single-channel EEG signals using the ICA technique and showed its performance by performing experiments on the real-life single-channel EEG signals.
Finally, a muscle artifact removal technique for single-channel EEG signals is proposed and validated by implementing it in the seizure detection algorithm as a preprocessing technique, which is discussed in Chapter 6.
Future scope of the work
Hyvet al., “Fast and robust fixed-point algorithms for independent component analysis,” IEEE Transactions on Neural Networks, vol. Van Huel, “Source separation from single-channel recordings by combining empirical mode decomposition and independent component analysis,” IEEE Transactions on Biomedical Engineering, vol. Abolghasemi, “A novel adaptive line amplifier based on singular spectral analysis,” IEEE Transactions on Biomedical Engineering, vol.
Calhoun, “Joint blind source separation by multiset canonical correlation analysis,” IEEE Transactions on Signal Processing, vol.
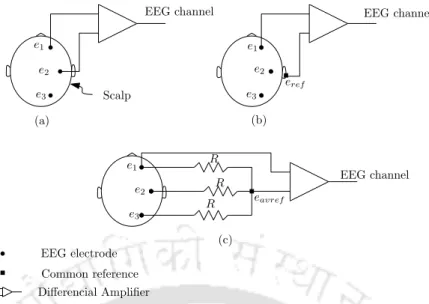
Commonly used electrode montages (a) bipolar, (b) unipolar and (c) av-
A typical 10 s multichannel EEG data [3]
EEG components extracted from typical EEG signal recorded during rest
Parallel recording of (a) ECG signal and (b) the EEG signal in unipolar
Application of ICA model to EEG
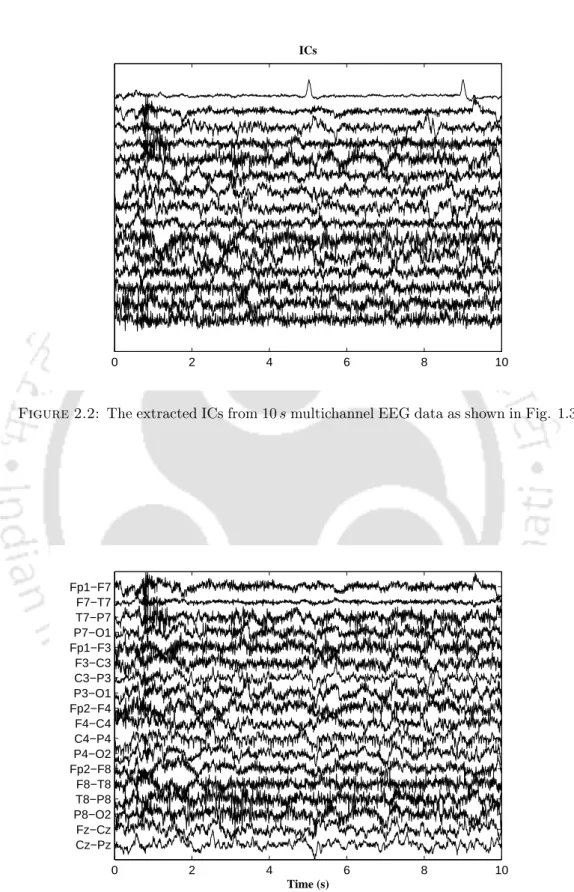
The extracted ICs from 10 s multichannel EEG data as shown in Fig. 1.3. 15
Ten second multichannel EEG epoch recordings contaminated by muscle
The extracted canonical components using CCA
Correlation coefficient ρ of CCA components in Fig. 2.5
Muscle artifact corrected EEG signals using CCA technique
Block diagram of adaptive noise canceler
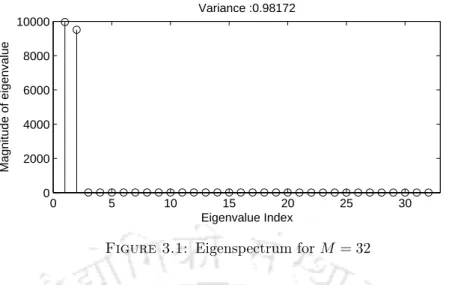
Eigenspectrum for M = 32
EEG signal (a) during normal state, (b) during epilepsy, (c) contaminated
Local mobilities of M eigenvectors, dashed line indicates the threshold to
EEMD decomposition of motion artifact contaminated EEG signal