The number of Gaussian componentsM = 32 is used for extracting the GMM-based membership feature vector. The number of Gaussian components M = 32 is used for extracting the GMM-based membership feature vector.
Bio-metric Systems : an overview
An important factor in the development of a biometric system is the use of distinguishing features. In particular, different samples from the same individual show variability in the set of features—what is called "within-class" variation in the literature.
Introduction to signature verification systems
Based on the method of data acquisition, signature verification techniques can be divided into one of two systems: offline and online. Accordingly, off-line signature verification systems use techniques from image analysis to verify the identity of the claimed person [14–16].
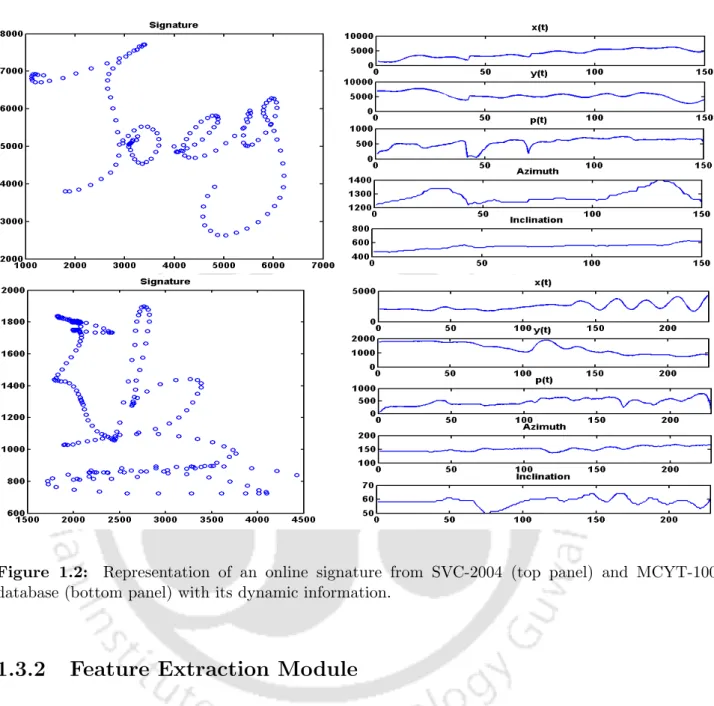
A schematic of an online signature verification system
- Sensor Module
- Feature Extraction Module
- Matching Module
- Decision Making Module
In general, the result of a verification system is a probability measure – which quantifies how likely the test signature belongs to the required client model. In other words, FAR indicates the proportion of forged signatures that are falsely accepted as genuine by the verification system.

Summary
In contrast, in the local-based approach, the temporal sequence describing the local characteristics of the signature trace is used for verification. The main contribution of the thesis (detailed in Section 2.4) is about reducing the error rate of online signature verification systems with new strategies that improve the usability of remote and model-based methods.
Distance Based Approaches
Non-elastic Distance Based Methods
The authors of the work [61] use properties of various histograms, derived from the online signature to construct a discriminative feature vector for signature verification. The resulting quantization step size vector is used to quantify each of the features in a feature vector derived from the enrolled samples.
Elastic Distance Based Methods
Unlike traditional DTW, the extreme point warping technique only works at selective points of the online track. A custom DTW algorithm is then used to align a test signature with the user's reference signatures.
Model Based Methods
In addition, the impact that a feature selection set has on the performance of the US-HMM and UA-HMM systems is also investigated. Similarly, the same authors used features in the work [104] - the selection of which was made on the value of a score calculated for each user.
Overview of Thesis
We encode the local features extracted at each sample of the online trace of a user's signature by a set of descriptors, which are obtained from a Gaussian mixture model (GMM)—a model-based approach. The resulting descriptor representation of the signatures is then temporally adjusted using the DTW algorithm.
A glimpse of the contributing Chapters
Chapter 4:: An Enhanced Contextual DTW System using Vector Quan-
The data in the cost matrix in the DTW algorithm is calculated by taking into account the neighborhood of the sample points being matched. Then, due to its complementary nature, we combine the derived warping path score with that of the DTW (through combination strategies) to verify the veracity of a test signature. In addition, we also explore how to incorporate contextual information into the warping path score derivation and use it for verification.
Chapter 5:: A system based on GMM descriptors in a DTW framework . 28
As a further step, we propose a result for capturing curve characteristics in the DTW cost matrix. Furthermore, the curve properties (used for alignment) in the cost matrix are hardly exploited for online signature verification. A proposal to combine the derived warp path estimate with the DTW result for decision making.
Organization of the Chapter
Experiments performed with our strategy show lower error rates than the traditional DTW algorithm. As mentioned in Section 3.1, the main point of the proposal is to design a strategy to define the output curve. This is followed by details of the experimental results in Section 3.8 obtained by our proposal, which show improvements over the traditional DTW algorithm.
Dataset description
MCYT-100: This database [18] is provided by the Biometric Recognition Group-ATVC of the Escuela Politecnica Superior of the Universidad Autonoma de Madrid. Each sample point of the signature trace contains the following information: (i) Position on the x-axis (ii) Position on the y-axis (iii) Pressure exerted by the pen (iv) Azimuth angle of the pen with respect to the tablet (v) Height angle of the pen relative to the tablet. Each of the forgers was asked to draw naturally, without artifacts such as delays or pauses.

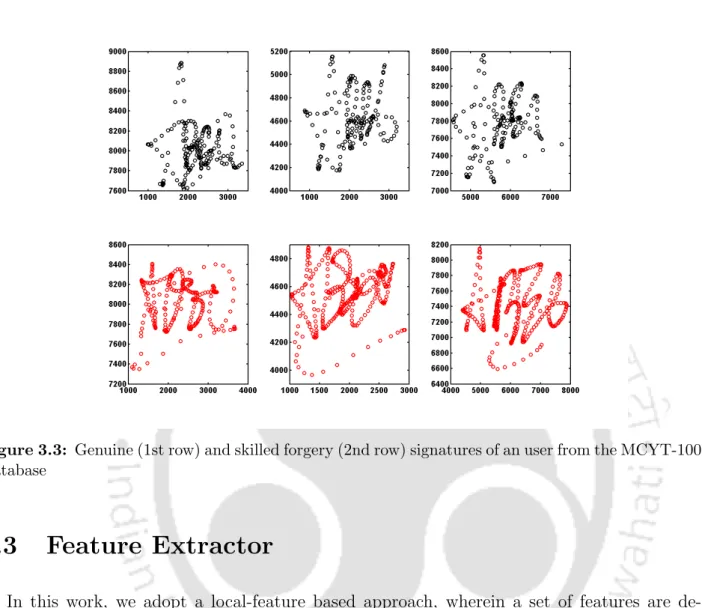
Feature Extractor
For illustration, Figures 3.4(a)-(d) depict the normalized histograms of the length feature lr calculated using two values, namely r = 1 and r = 6, for the genuine and skilled forgery signatures of a user of the MCYT-100 database. We note that the distribution of the feature for the rater = 1 is not as discriminating, when compared to = 6. Again, we clearly see a better separation in the normalized distribution of the genuine from the skilled forgery signatures for the higher value of r, namely r= 6.

DTW based matching
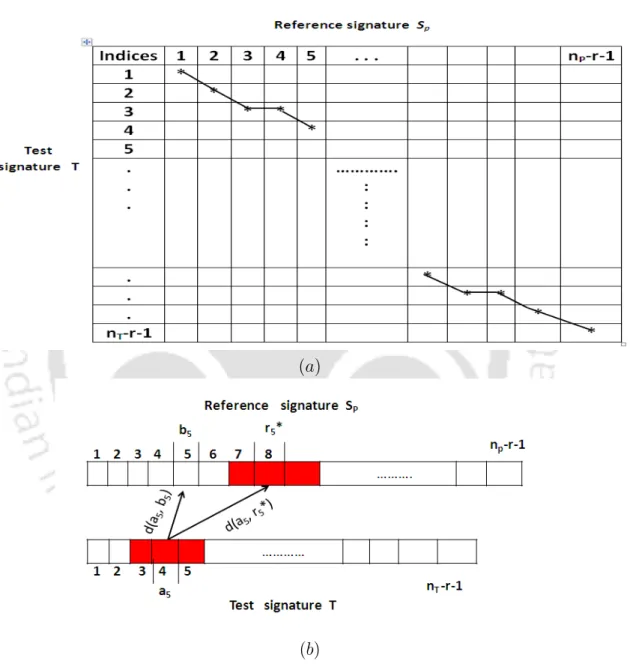
With regard to implementation, (ai, bi) also refers to the cell in the athi row and bthi column of the cost matrix. Henceforth, in the remainder of the discussion we will alternately refer to the pair (ai, bi) as an 'alignment' or. The warping path can sometimes give rise to one-to-many or many-to-one alignment, so that the indices in the sets {ai}li=1W∗p and {bi}li=1W∗p are not necessarily unique.
Utility of additional information from the cost matrix
From the definition of equation 3.6 on city block distance, we can rewrite the above equation as. The middle index of the segment in Sp that gives the closest match (by minimizing the summation terms in equation 3.10) corresponds to the index value r∗i. For illustration, let us assume that out of all possible window segments of size three, the segment around the eighth sample point in Sp gives the closest match (as obtained from Equation 3.10).
Derivation of warping path score
For this we normalize each of the feature distortion terms|d(ai, bi)−d(ai, r∗i)|indp21 by a factor Di defined as.
Fusion
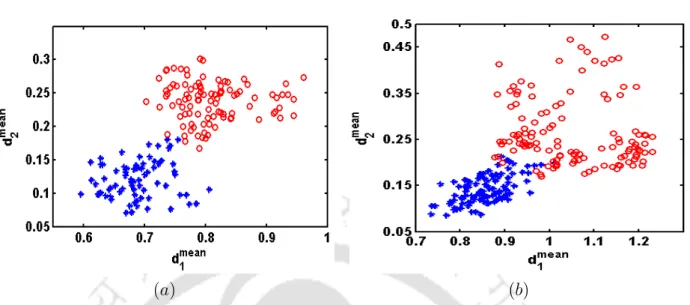
We see that the exclusive use of one of the points represents an obvious overlap between the original signatures and those capable of forgery. 2 It may be mentioned in passing that when the distribution of dmean2 scores between true and capable forgery signatures do not overlap, using dmean2 alone would suffice for verification. For better clarity, a pseudo-code is presented that summarizes the derivation of the distortion path result in the proposed signature verification system for an ST test signature (refer to Algorithm 1).
Demonstration of the warping path score for verification
Histogram based analysis of values contributing to DTW and warping
Figures 3.10(a) and (b) depict the plots for the case of the DTW match between the genuine and skilled forgery signature (in Figures 3.8(b) and (c)) with the reference signature in Figure 3.8(a) respectively. Accordingly, Figures 3.11(a) and (b) depict the plots for the case of the DTW match between the genuine and skilled forgery signature (in Figures 3.9(b) and (c)) with the reference signature in Figure 3.9(a) respectively . In particular, compared to 0.23, the histograms of the distance values in Figures 3.11(c) and (d) that contribute to the curvature path scores d2 of the genuine and skilled forgery signature match have a high dissimilarity score of 0.59.

Experimental framework
Enrollment Protocol
Evaluation Protocol
The percentage of counterfeits that gain access to the system is the False Acceptance Rate (FAR). In the first case, we only use the corresponding scores corresponding to the test signatures of the given user to calculate the error. Unlike the above, the common threshold setup aggregates the corresponding scores corresponding to the signatures under test from all users to calculate the EER.
Results and Discussion
- Influence of spacing parameter value r
- Influence of the warping path score
- DET Curves
- Influence of the fusion strategies
- Influence of Number of Reference signatures
- Influence of warping path score on various recursion relation
- Influence of dissimilarity measure
- Statistical Significance of results
- Computational complexity
We consider this value of the splitting parameter for the experiments described for the SVC-2004 database. The relatively higher reduction in MEER (compared to the SVC-2004 database) is due to the characteristics of the MCYT-100 database. In addition, for these plots, the value of the separation parameter considered for the SVC-2004 and MCYT-100 databases are r = 5 and r = 6, respectively.

Summary
This result is then combined with the DTW result (with result combining strategies) to verify the authenticity of the test signature. In [36], the vector of quantized features of the test signature of the requested user is compared with the vectors of the registered reference signatures. For continuity, the same notation will be used as used to discuss the DTW algorithm in Section 3.4.

Vector Quantization
Experiments demonstrating the efficiency of our proposal are presented in Section 4.6, followed by a brief summary in Section 4.7.
Proposed DTW-VQ based system
However, the convolution path in Figure 4.3 (f) for the true signature match presents a large number of feature vectors corresponding to the aligned pairs (depicted by the symbol *) that share the same code vector indices. Note that again an opposite trend is observed here for the skewed trajectory of skilled forgery matches in Figure 4.3 (g). The value of the convolution path scored2, on the other hand, tries to distinguish the signatures better.

Incorporation of contextual information
For the case where only point-based matching is considered (without the integration of context), the value of dp2 reduces to equation 4.2.
Fusion
The above calculation is calculated ∀(ai, bi)∈ Wp∗. Then the average votes are accumulated and normalized with the length of the warping path lW∗. 4.5). Derive the order of point-based feature vectors (discussed in Section 3.3) corresponding to ST and Sp. Extract the cells (ai, bi) in the warping path Wp∗ from the DTW cost matrix by backtracking.
Results and Discussion
- Performance Evaluation on SVC-2004 Database
- Performance Evaluation on MCYT-100 Database
- DET Curves
- Computational complexity
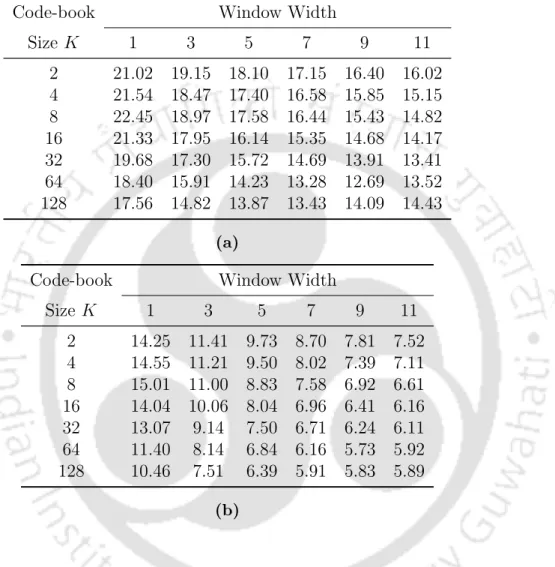
We begin by examining the performance of the CTX-DTW system in Table 4.2 for various odd window sizes ranging from 1 to 11. We also evaluate the performance of the F U S2 system for a varying number of reference signature samples recorded in the system . As a further demonstration of the effectiveness of the proposal, in Table 4.10 we list the MOREs for a varying number of reference signature samples enrolled in the F U S2 system.
Summary
In this chapter, we propose an online signature verification system that exploits clues from a model-based approach to improve the performance of the DTW matching scheme. The resulting descriptions of the GMM obtained. at each sample point the signatures being compared are temporally aligned using the DTW algorithm and matched. Keeping this in perspective, in this work we propose a score that includes the features of the distortion path in the cost matrix.
System Architecture
Gaussian Mixture Models
The aim of the EM algorithm is to estimate the parameters of Gaussian components in such a way that the value of the log-likelihood expression is maximized subject to the constraint that the M mixing coefficients {πk}Mk=1 sum to one [110] . In this work, the initialization of the M mean vectors is done using random selections from the training data. We now provide an overview of the verification strategy using the likelihood score of the GMM system.
Details of the GMM-DTW proposal
GMM Based Descriptor Representation
It is clear that in this representation we see a better separation of the authentic reference signature and the signature of the experienced forgery test. In this case, we consider the matching of the DTW authentic and experienced forgery test signature (Figure 5.6 (b) and (c) respectively) with the authentic reference signature (Figure 5.6 (a)) of the user from SVC- Database 2004. Histograms in Figures 5.7 (a) and (b), which correspond to matching the signatures of the authentic and experienced forgery test with the reference signature, are composed of the feature set described in Section 3.3.

Warping Path Score Derivation
- Computation of (a i , r i ∗ )
- Generation of the histograms
- An illustrative example
Each of the histograms includes M bins, corresponding to the number of Gaussian components in the GMM. The resulting votes of the histogram indices are then normalized by the length of the warp path lW∗. Let {hWp∗(k)}Mk=1 and {h⊖∗p(k)}Mk=1 correspond to the votes in the M-boxes of the histograms HWp∗ and H⊖∗p, respectively.
Fusion
The histograms of HW∗ and H⊖∗ corresponding to the genuine signature match the reference signature shown in subfigures (d) and (e). On the other hand, the HW∗ and H⊖∗ histograms corresponding to the qualified forged signature matching the reference signature are presented in subfigures (f) and (g). The histograms of HW∗ and H⊖∗ corresponding to the authentic test signature with the reference signature and the forgery test signature with the reference signature are shown in subfigures (d)-(e) and (f)-(g), respectively. .

Results and Discussion
- Performance Evaluation on MCYT-100 Database
- Performance Evaluation on SVC-2004 Database
- DET Curves
- Computational Complexity
Another point of note here concerns the performance of the FUS3 system on a large number of Gaussian components. The number of Gaussian components used for the extraction of the GMM-based membership feature vector is M = 64. The number of Gaussian components used for the extraction of the GMM-based membership feature vector is M = 64.

Summary
Proposal to study the warping path trend and its use for signature verification. Fusion of the curvature path score with that of DTW to reduce error rates. Demonstration of the use of the different distance proposal used for the calculation of the DTW cost matrix.
Discussion to prior works
Possible pointers for the future
Matsumoto, “Verification of ppi line pen input signature (pen position/pen pressure/pen tilt),” in Proc. Rutkowski, "New method for on-line signature verification based on horizontal partitioning," Pattern Recognition, vol. Somashekara, "Online signature verification based on writer-dependent features and classifiers," Pattern Recognition Letters, vol.