Recently, the focus has also been placed on the use of functionalized nanomaterials, conductive polymers, paper substrates, open source electronics and their application in the Point-of-Care (POC) testing devices. The technical chapters in the thesis are preceded by an introductory chapter while a chapter is included at the end of the thesis which contains the summary and future scope.
Chapter 1: Point-of-Care-Testing of α-Amylase Activity in Human Blood Serum
The change in electrical resistance shows an almost linear correlation with the concentration of α-amylase in the buffer, which helps in the detection of unknown α-amylase activity in blood serum. Biosensor integration with an on-board source meter and real-time display aid in the immediate presentation of serum α-amylase levels comparable to clinically approved methodologies.
Chapter 2: Paper-Based α-Amylase Detector for Point-of-Care Diagnostics
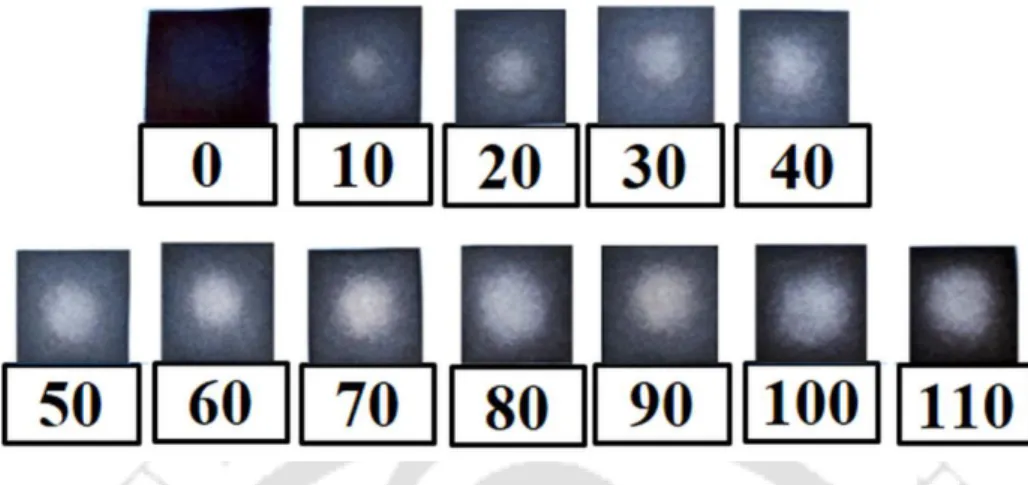
Addition of different doses of α-amylase on the biosensor selectively depletes starch stabilized on the SAuNPs, changing the electrical resistance of the sensor. The variation in color intensity with the concentration of amylase was estimated in three steps: (i) initially, the paper surface was illuminated with a light-emitting diode.

Chapter 3: Paper-Based Sensor for Point-of-Care Kidney Function Monitoring In this chapter, development of a paper-based colorimetric sensor for monitoring of
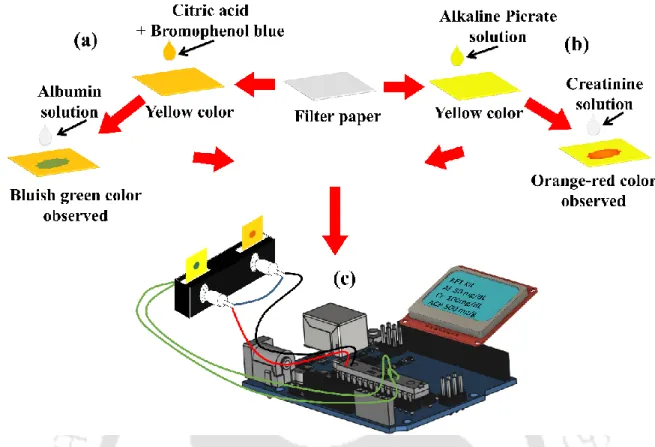
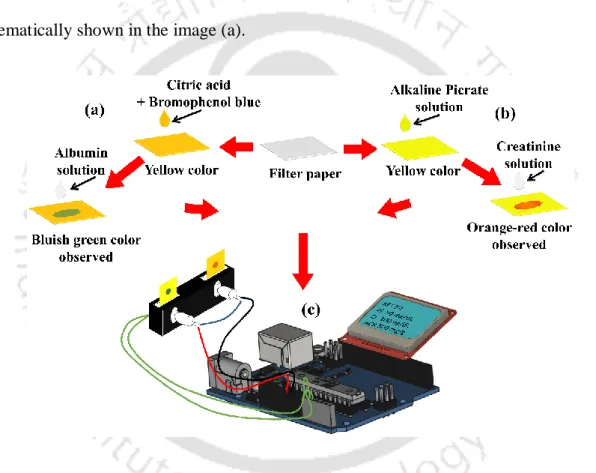
Figure (c) illustrates the function of the sensors in determining the albumin and creatinine concentration in human blood. For both the albumin and creatinine sensors, the intensity of the bluish-green or orange discoloration varied with the concentration of the analytes in the solutions.
Chapter 4: Paper-based Sensors for Point-of-Care Water Quality Testing
For this purpose, the sensors were initially characterized and calibrated with known concentrations of contaminants before being successfully validated with real samples. Then the sensors on one side were illuminated with a light-emitting diode, while the emitted rays passing through the sensor were received by a light-dependent resistor (LDR) on the other side.
The first (second) row shows the results without (with) the pre-treatment of KIO3. d) The variation in ∆𝑹𝑵𝑻 with C in transmission mode when the initial analyte was composed of a mixture of ascorbic acid and α-amylase and then pretreated with KIO3. The image set (c) shows the colorimetric change of the paper sensors when different loads of albumin were delivered.
List of Tables
Contents
Overview
Recently, there have been significant advances in the field of POCT device design and development by applying advanced technologies such as bio-process response engineering, nanotechnology, micro or nanoelectronics, microfluidics, smart soft materials, data analytics and connectivity (Bhattacharjee et. The development of sensors for the detection of various toxic chemicals, pH, in water bodies gained serious interest due to their importance in environmental monitoring and the connection with various diseases (Clement et al. 1999; Fung and Mykhaylova 2014 ).
Classification of POCT devices
- Conducting (sensing material) polymer based POCT devices
- Paper (substrate)-based POCT devices
There are sensors based on conductive polymer nanomaterials, consisting of polypyrrole (PPy), polyaniline (PANI), poly-(3,4-ethylenedioxythiophene) (PEDOT) (Li et al. 2015; Yoon and Jang 2009). Recently, paper has been widely used in POCT devices due to its aforementioned qualities (Russo et al. 2011; Yetisen et al. 2013).
Objectives of the Thesis
- Materials
- Synthesis
- Methods
The solubility of the non-conductive PANI-EB in the organic solvents assisted in the drop-casting of the film. The FESEM image in Figure 2.1(c) shows the surface textures of the non-conductive PANI-EB thin film.

Results and Discussion
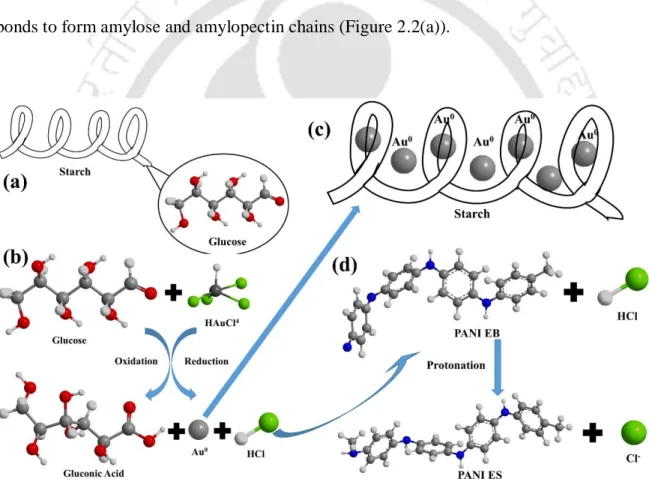
- Reaction mechanism
- Characterization of the sensor material and function
- Electrical Response of the sensor
- Computational Simulations to Estimate the Change in Resistance
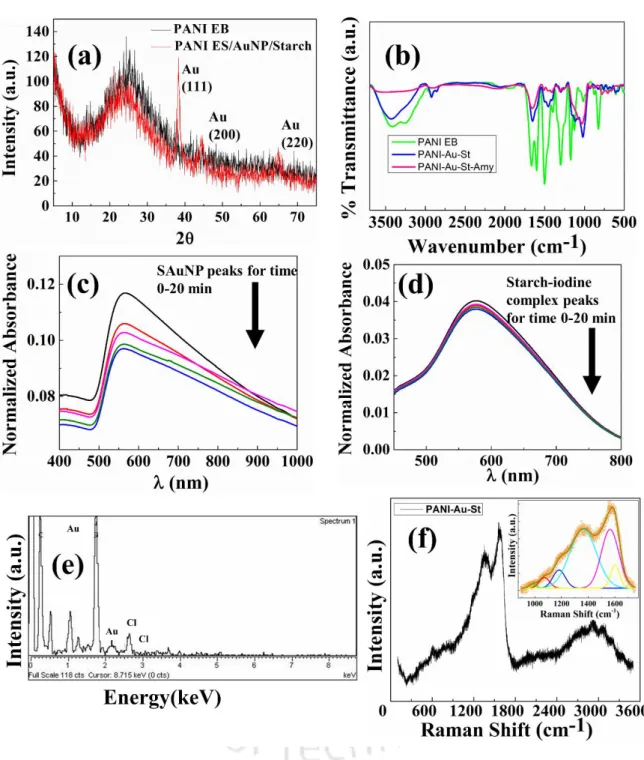
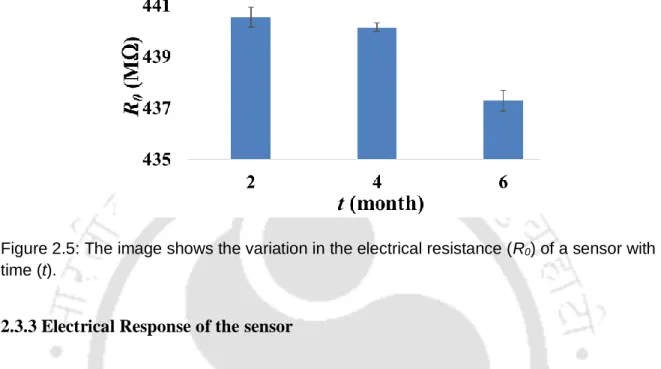
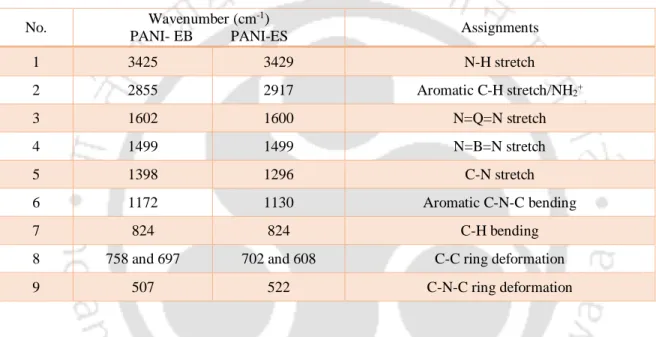
The details of the peaks for PANI-EB (curve in green) and PANI-ES coated with SAuNPs (curve in blue) are provided in the Table 2.2. The variation in initial resistance of the sensor was ~1% over six months, as illustrated in Figure 2.5. The experimental setup shown in Figure 2.6 was used to measure the change in resistance of the biosensor with the concentration of the aqueous α-amylase solution.
Conclusions
A detailed computational investigation of the precise characteristics of the detection mechanism is reserved as a future scope of research. Dosing α-amylase solution onto starch-iodine-coated paper reduced the color intensity due to amylase-catalyzed hydrolysis of starch. The resistance of the photoresist decreased monotonically with increasing amylase concentration because the intensity of the reflected (transmitted) rays collected from (through) the paper increased with decreasing color intensity on the paper surface.
Introduction
Recent studies suggest that paper-based diagnostic tools can lead to the development of simple point-of-care devices for monitoring environmental parameters, food quality, immunological assays and human health status (Li et al. The popularity of Paper-based micro-analytical devices (µ-PADS) are attributed to advantages related to lower cost, easy availability, biodegradability and portability (Ballerini et al. Moreover, white color serves as an excellent background for analyses colorimetric that use paper as a substrate.
Experimental Section 1. Materials
- Preparation of solutions
- Methods
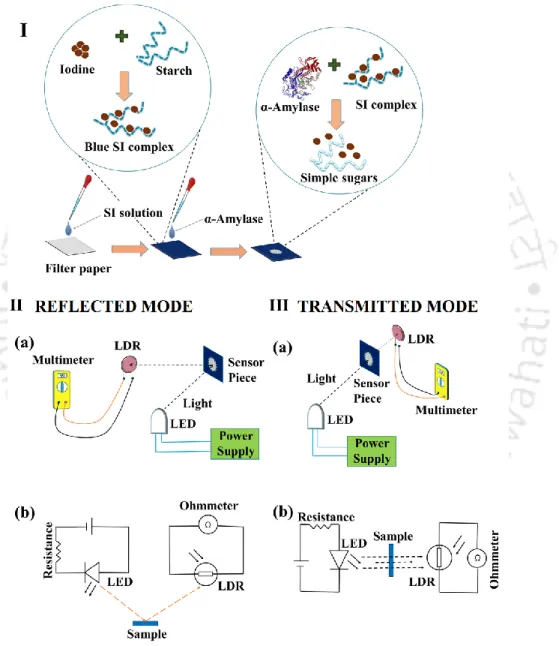
Subsequently, 5 µl of α-amylase solutions of various known concentrations were dispensed onto a set of SI coated paper (Figure (I)) before being kept in an incubator at 37 °C for approximately 15 min. The electrical resistance of the photoresist for different SI coated papers was measured using a digital multimeter for transmitted and reflected rays. 54 Chapter 3 photoresist different concentrations of α-amylase were observed for transmitted and reflected rays.
Results and Discussion
- Reaction mechanism
- Characterization of the sensor material and function
- Electrical Response of the sensor
Wilding 1965). The first image in Figure 3.2 shows the typical appearance of the sensors from above when SI solutions are coated on the paper. The images in Figure 3.2 depict the fading of the blue color with increasing concentration of α-amylase in the analyte. The images (a) and (b) show the surface morphologies of the paper coated with the SI complex before and after the amylase treatment.
Conclusions
The change in amylase concentration was correlated with the change in photoresistor resistance. This eventually increased the intensity of the transmitted rays to reduce the resistance of the photoresistor in the transmission mode. The change in resistance of the photoresistor can be easily related to the loading of amylase in the analyte for both reflected and transmitted modes.
Experimental Section
- Materials
- Methods
The optimization of the concentration of bromophenol blue and picric acid was done using a trial and error method. The intensity of the color for both sensors increased with increasing concentration of albumin and creatinine in the analyte. The color of the sensor surface changed simultaneously and the variations in the electrical resistance of the LDR were recorded for different albumin and creatinine concentrations.
Results and Discussion
- Reaction mechanism characterization
- Electrical Response of the sensor
For different sensors for albumin and creatinine, the electrical resistance from the corresponding LDRs was measured using a multimeter. Figure 4.6(c) shows the various components used in the development of the POCT kidney monitoring device, such as (i) an open source microcontroller board, (ii) a sensor module consisting of sensors and a pair of LED-LDR settings, (iii) a liquid crystal display module crystals (LCD) and (iv) Bluetooth module HC-05. The VCC pin was connected to 3.3V and the GND pin of the Bluetooth module was connected to ground.

Conclusions
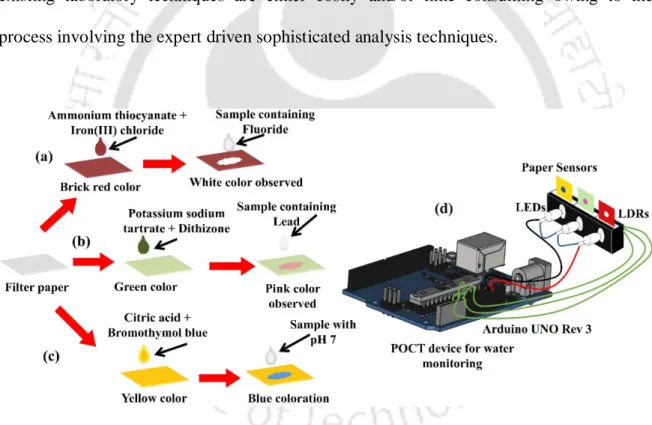
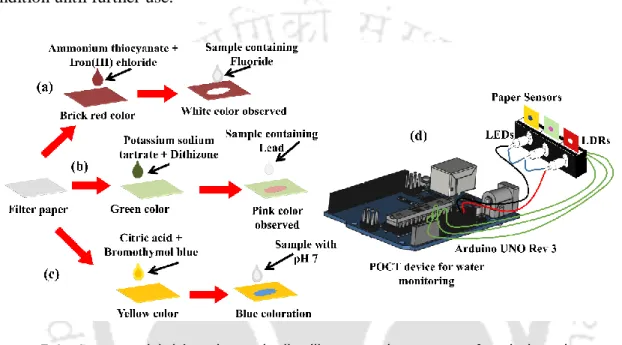
Pollution of water bodies due to the removal of natural and anthropogenic pollutants has been one of the major global concerns in recent times. Herein, we report the development of three paper-based colorimetric sensors for the quantitative on-site detection of the levels of fluoride (F−), lead (Pb2+) and pH in drinking water. The variations in the color intensity of the paper sensors with the variation in the concentration of fluoride (F−), lead (Pb2+) and pH were converted into electronic signals to enable the development of a point-of-care test (POCT) device.
Introduction
On the other hand, WHO guidelines also suggest that water pH should be in the range of 6.0 to 8.0 (Kumar and Puri 2012). The variations in the color of the paper sensor surface were detected using a light-emitting diode (LED) and a light-dependent resistor (LDR). The resistance of LDR was found to vary monotonically with the change in the concentration of dissolved F−, Pb2+ and pH in the water sample.
Experimental Section 1. Materials
- Methods
107 platform to translate into a portable and easy-to-use POCT device for on-site, low-cost and instant water quality monitoring. For the pH sensor, the paper pieces were coated with 10 µl of 250 mM citric acid solution and dried under vacuum at 37°C. Figure (d) shows the integration of LED and LDR with the sensor and subsequent measurement of the change in resistance using an Arduino-based POCT water quality display device.
Results and Discussion
- Characterization of the sensor material and mechanism of detection
- Response of the sensor
The images in figure 5.3(d) illustrate the visual increase in the discoloration of the sensor surface as a result of the increase in the 𝐶𝐹 in the water sample delivered onto the sensor surface. 113 the pink color intensity of the sensor surface due to increase in 𝐶𝑃𝑏 in the water sample delivered onto the sensor surface. The images in Figure 5.3(f) illustrate the visual increase in the greenish blue color on the sensor surface as a result of increase in pH of the water sample delivered onto the sensor surface.

Conclusions
Table 5.4 suggests that the predictions from the POCT device were quite close with some deviations compared to the standard methodology adopted. Deviations obtained in the proposed POCT methodology compared to the adopted costly method can be corrected by optimization and improvement of the proposed water quality sensor. Table 5.5 shows a comparison of the cost and expertise required for water quality monitoring using the proposed and commercially available devices and it can be concluded that the proposed sensors are quite economical.
Summary
The variations in the electrical resistance of the photoresist were correlated with the change in color intensity and amylase concentration. The change in color intensity on the sensor surface with the variation in albumin or creatinine concentration in the analyte was found to have a direct correlation with variations in the electrical resistance of the LDR. The resistance of LDR was found to vary monotonically with the change in the concentration of dissolved F-, Pb2+.
Future Scope
The thesis also shows a new way to fabricate colorimetric paper sensors for monitoring the kidney function of a drop of human urine, which may have its potential application as a health care device. Besides these, the thesis also demonstrated a colorimetric sensor for detecting F-, Pb2+ and pH present in a water sample for the instantaneous status of water quality. Different geometries of paper along with wax printing can be used to further miniaturize the sensor design.
Appendix - I
मित्रदीप भट्टाचार्जी, सीम तिमुंग, नीलांजन मंडल, हर्षल नेमाडे और दीपांकर बंद्योपाध्याय, "पीडीएमएस थिन फिल्म की सेल्फ एडहेसिव नेचर", रिफ्लक्स -2015, आईआईटी गुवाहाटी, भारत, मार्च। सतरूपा दत्ता, नीलांजन मंडल, मित्रदीप भट्टाचार्जी, हर्षल नेमाडे, अरुण चट्टोपाध्याय और दीपांकर बंद्योपाध्याय, "पेपर-आधारित ऑप्टिकल अल्फा एमाइलेज सेंसर", ट्रांसलेशनल नैनोमेडिसिन पर अंतर्राष्ट्रीय सम्मेलन (टी-एनएएनओ 2014), अहमदाबाद, भारत, दिसंबर। मित्रदीप भट्टाचार्जी, नीलांजन मंडल, हर्षल नेमाडे, और दीपांकर बंद्योपाध्याय, "एक ग्रेफाइट चैनल MOSFET डिवाइस की ज्यामिति की नकल करके एक वोल्टेज नियंत्रित अवरोधक का अनुकरण," COMSOL सम्मेलन की कार्यवाही में, बैंगलोर, भारत, नवंबर।