T ,T Temperature of the driven and driver part of shock tube (K, °C) T2 Temperature over incident shock wave (K, °C). T5 Temperature in the driven part of the shock tube after the shock reflection (K, °C) T Free stream temperature (K, °C).

Characteristics of Hypersonic Flows
In addition, an accurate estimate of the forces not only provides knowledge of the fuel requirement, but also helps in determining the trajectory and stability of the vehicle. Many researchers have extended their efforts to developing analytical relations, numerical simulations, and experimental techniques to predict the forces acting on the model.
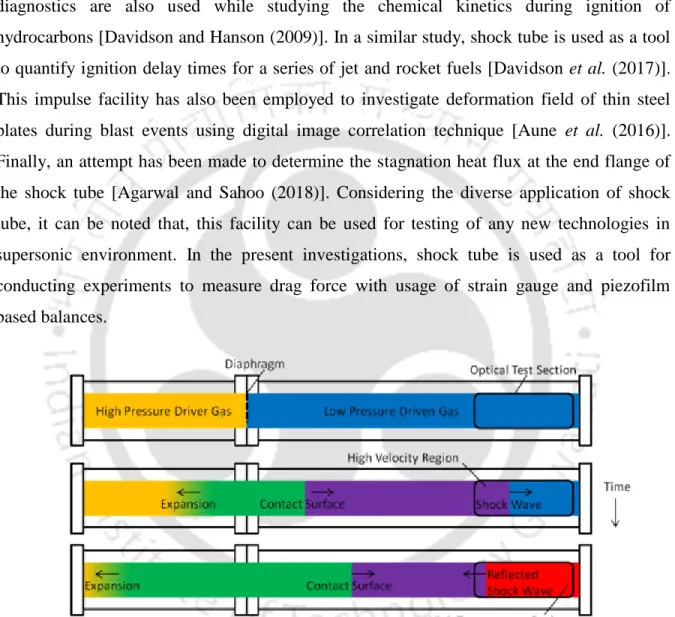
Impulse Test Facilities
- Shock Tube
- Shock Tunnel
- Expansion Tunnel
- Gun Tunnel
Finally, an attempt has been made to determine the stagnation heat flux at the trailing edge of the shock tube [Agarwal and Sahoo (2018)]. The expansion tunnel consists of the guide pipe, push pipe, acceleration pipe, nozzle, test section and drop tank, as shown in Fig. the acceleration tube can accelerate the test gas to high velocities analogous to that in the shock tunnel test section.
Force Measurement Technique
Inertia Dominated Force Balance
The aerodynamic force and moment can then be measured from the measured acceleration with prior knowledge of the mass and moment of inertia of the model. The same method has been extended for the AGARD model to measure the drag coefficient, lift and pitching moment in a free stream Mach number of 8.0 [Saravanan et al.
Stiffness Dominated Force Balance
- Strain Gauge Based Balances
- Piezofilm Based Balances
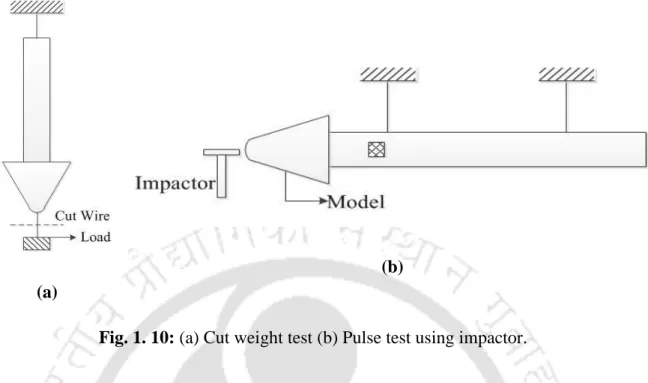
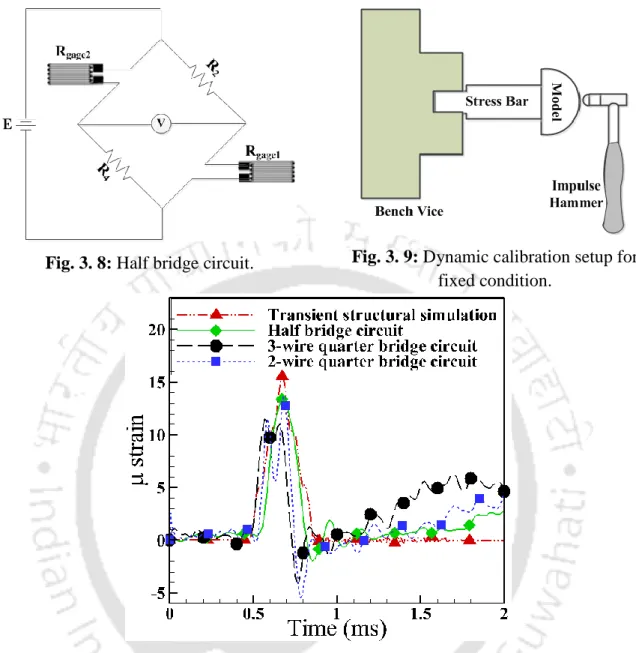
10(b)) and the magnitude and trend of the impulse can be obtained by connecting it to a data acquisition system (DAS) that displays the force-time history of the applied load. The dynamic calibration techniques mentioned above can be applied to arbitrary models and associated support structures to obtain the impulse response function of the system.

Summary
However, piezofilm-based force measurement was not considered in impulsive testing because these films were not previously available as compact sensors. Such larger films were not suitable for strain measurement as they were not suitable for obtaining the local strain time history.
Objectives of the Thesis
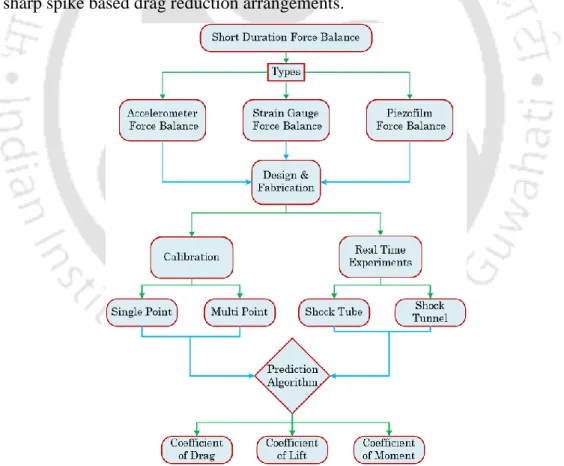
In some cases, numerical studies were also carried out to validate the results obtained by the prediction techniques. The experimental approach used throughout the curriculum to achieve the desired goals is shown in the figure.
Structure of the Thesis
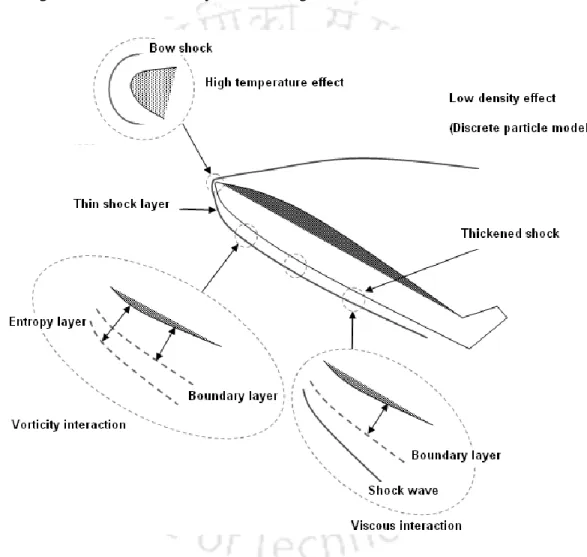
Thin shock layers, thick boundary layers, strong eddy regions, and dominant viscous interaction can be used to characterize the flow physics in this phase. The development and implementation of new technologies in this regard can be evaluated by experimentation in ground installations due to low cost and lower risk.
Introduction
The performance of force balances relies only on the frequencies of the system as a whole, ie. by design, balance and support structure. Given the intense commitment to developing force balance systems for accurate force prediction, few land-based facilities have been developed to evaluate the performance of these balances.
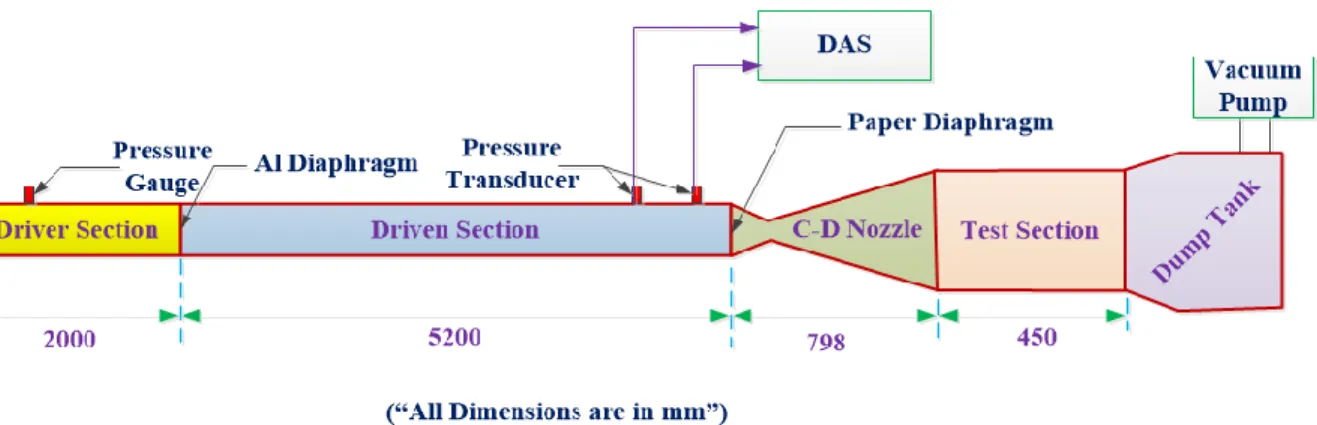
Experimental Facility
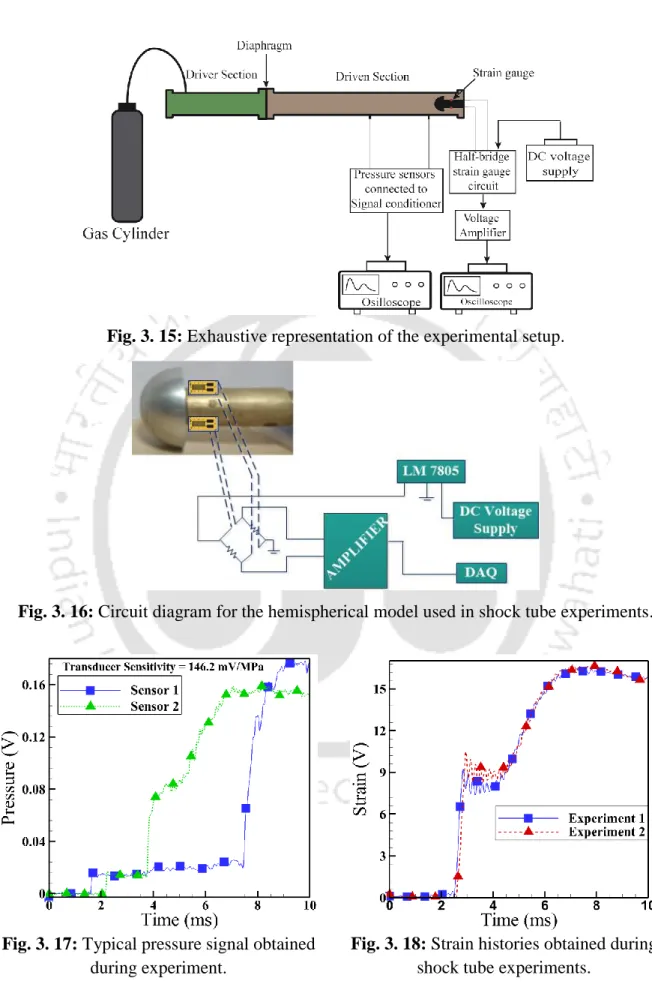
Shock Tube Facility
- Numerical Validation
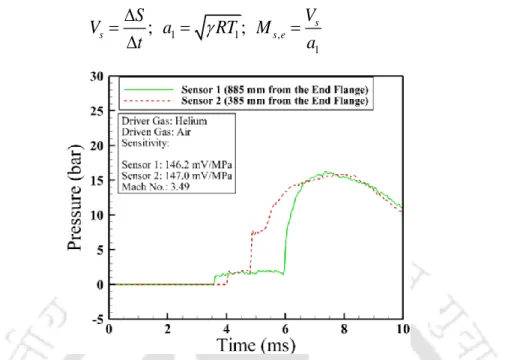
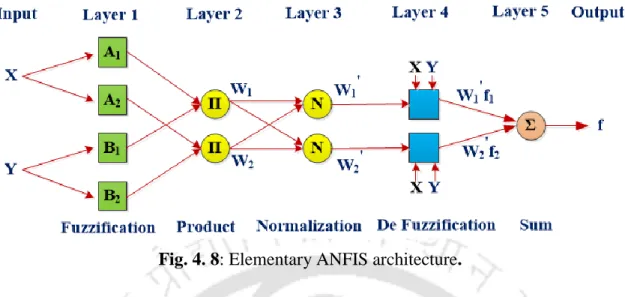
As part of the shock tube calibration test, the pressure rise across the incident and reflected shock wave must be recorded. Calibration of the shock tube is carried out considering propellant gases such as nitrogen and helium, as shown in Fig.

Hypersonic Shock Tunnel Facility
- Determination of freestream conditions
The test gas is further expanded through the C-D nozzle to achieve the desired free flow conditions in the test section. A rake of pitot sensor is mounted in the test section during one of the tests with the intention of quantifying the free flow conditions and constant test duration.
Types of force balances
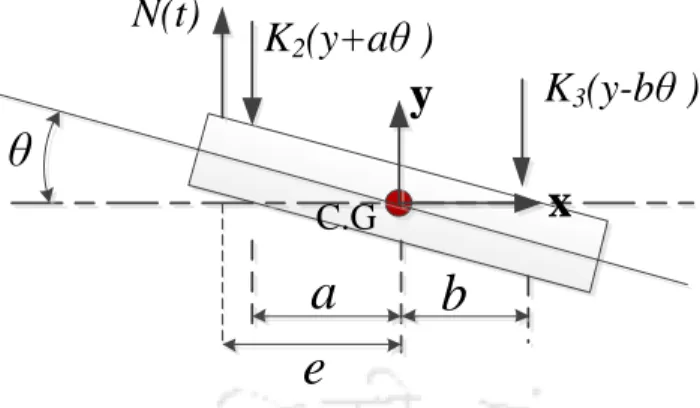
Accelerometer force balance theory
Incorporating the above fact of neglecting factors related to 't2' will result in the following expression for calculating the forces acting on the model. As a result, PCB Piezotronics manufactures accelerometers that are equipped inside the model to measure axial and normal accelerations.
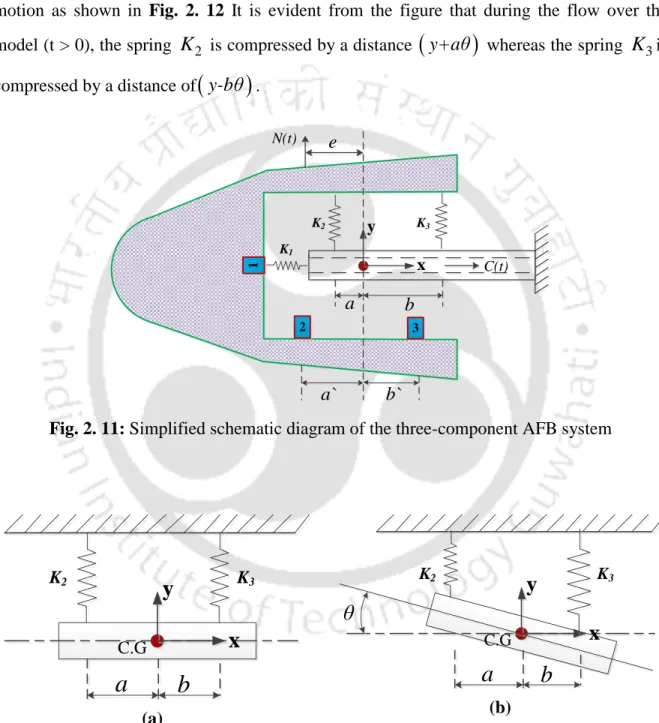
Stiffness based force balance
- Theory of stress wave balance
- Strain gauge based force balance
- Piezofilm based force balance
The output of the accelerator is further connected to the signal conditioner for the purpose of data acquisition. The working principle of the strain gauge is based on the change in resistance of the sensor developed due to the applied load.
Introduction
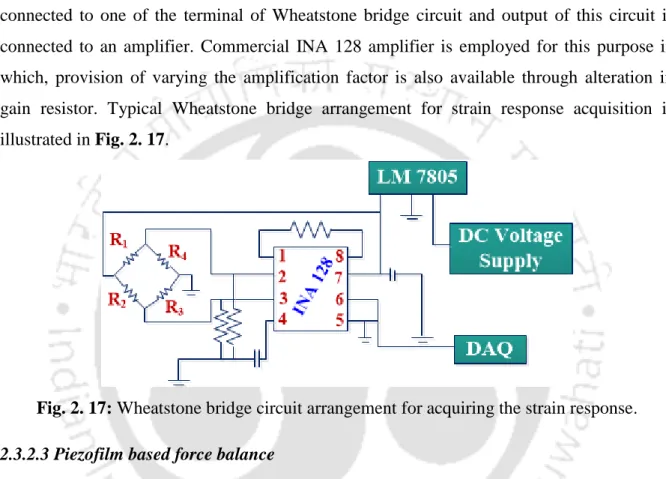
Therefore, the choice of strain gauge configuration in Wheatstone bridge circuit has the greatest importance in strain measurement for impulse load applications. There are few configurations in which it is possible to connect the strain gauge to the Wheatstone bridge circuit.
Preliminary Investigation
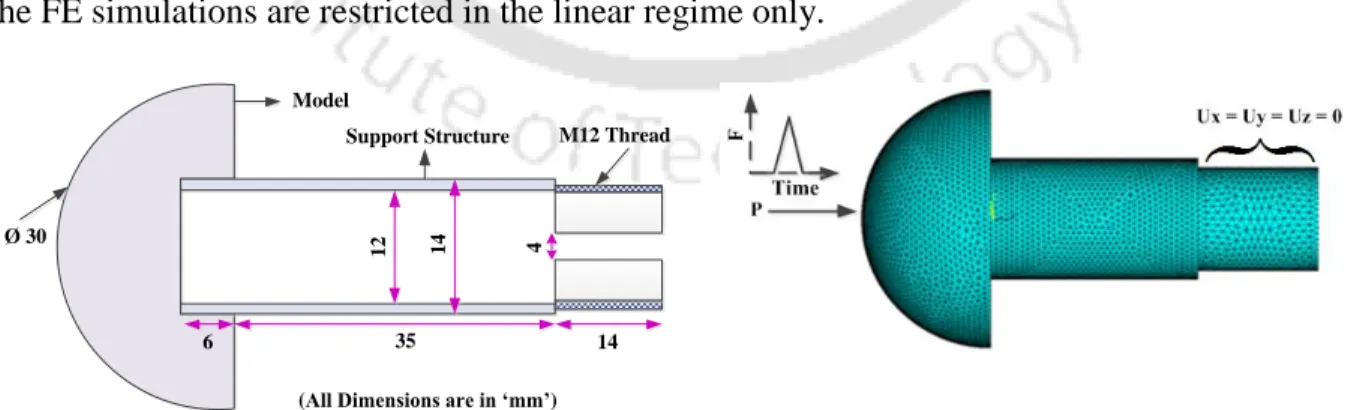
Transient Finite Element Simulation
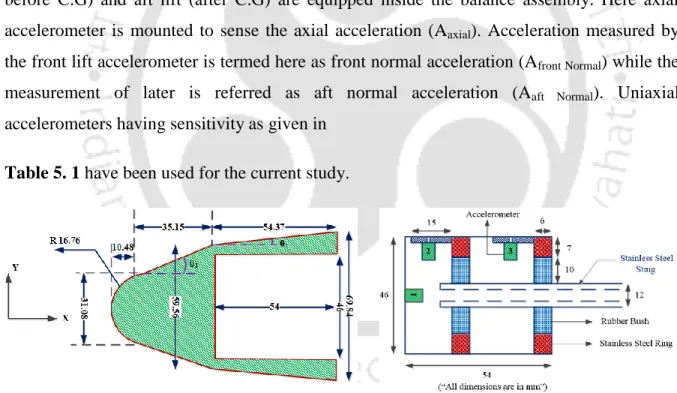
The implementation of the above objectives is made possible using a hemispherical model integrated with a tension beam. In one of the types, the trailing end of the tension bar is given a “zero displacement boundary condition” in each direction, as shown in Fig.
Exploration of circuit configuration for strain measurement
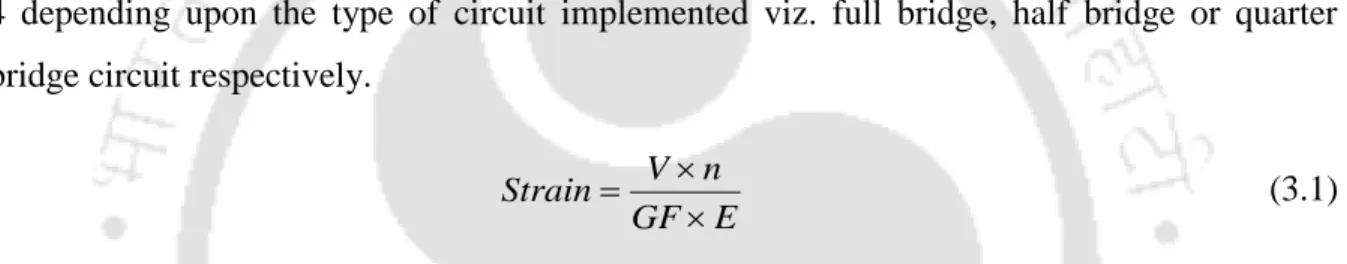
The relationship between output of the Wheatstone bridge and the local strain produced in the test model is given by Eq. full bridge, half bridge or quarter bridge circuit respectively. 51 | Page deviation of 22.6% compared to corresponding simulation results due to the shortcomings of the circuit configurations, as discussed earlier.
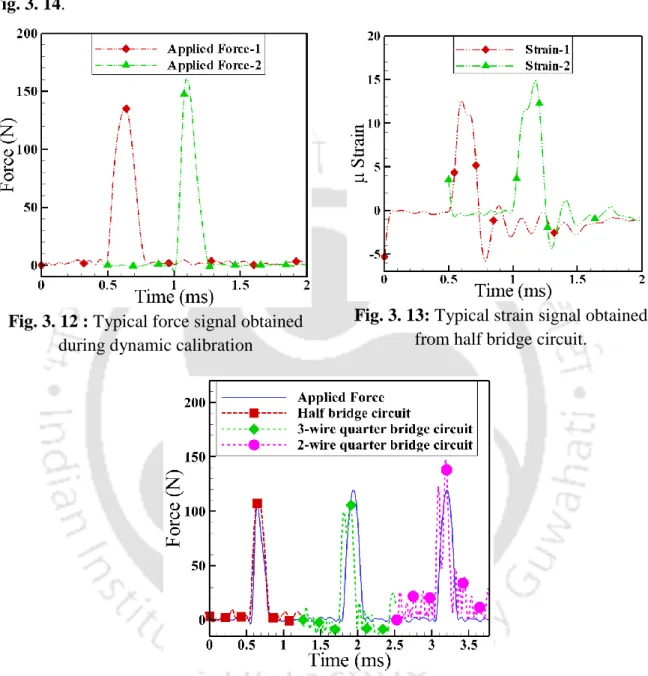
Dynamic calibration of force balance
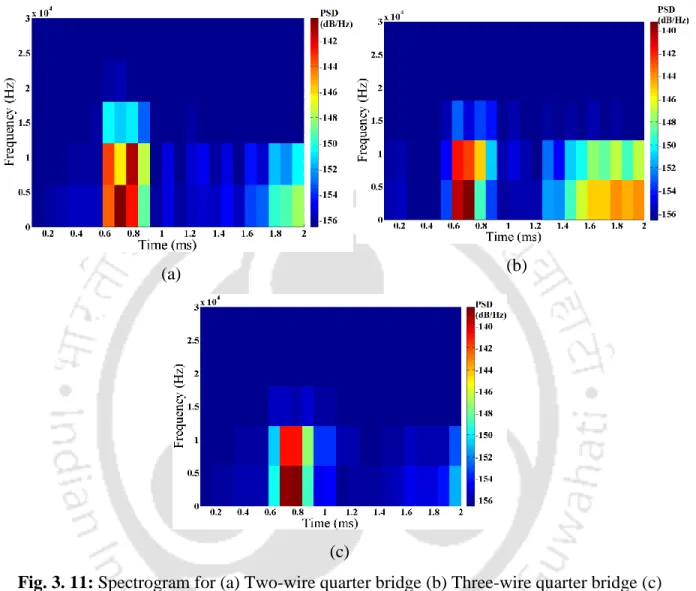
Furthermore, the use of a half-bridge circuit appears to have advantages since its spectrogram, Fig. Furthermore, the peak size of the predicted power seems to be reduced in the case of a three-wire quarter-bridge circuit along with the noise.
Force measurement in shock tube
Thus, the current calibration experiments also validate the use of a half-bridge circuit for force measurement. Then, force measurement experiments are performed on the same test model by attaching it to the end flange of the shock tube.
Introduction
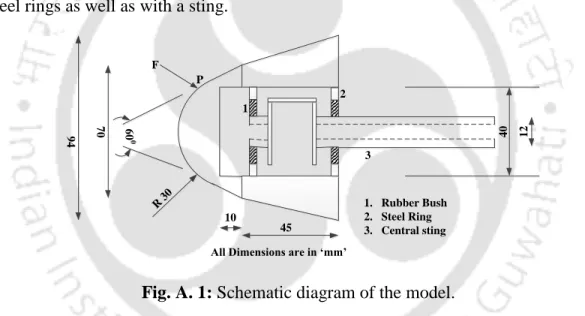
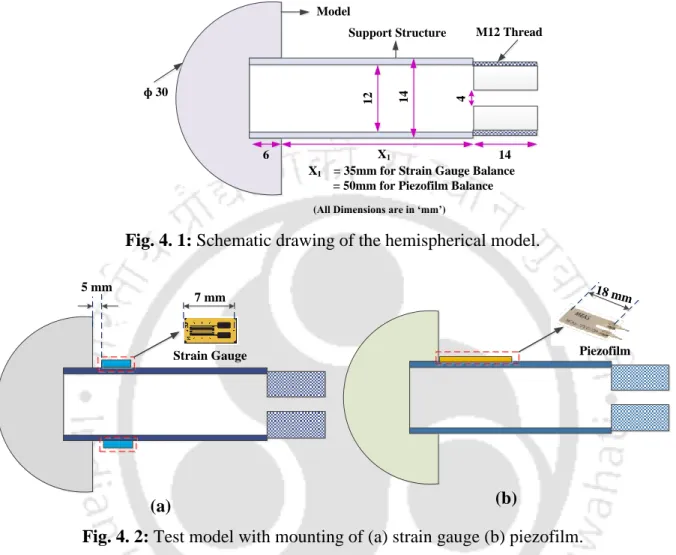
Test Model, Instrumentation and Experimental Set-up
A test specimen and tension rod assembly equipped with a strain sensor is mounted at the center of the end flange of the driven section. During experimentation, the axis of the test model is aligned with the axis of the shock tube.
Computational Methodology
Fluid Flow Simulation
3, is provided for simulation, but only for the computational domain, which is 250 mm from the end flange of the driven section. This computational domain is initialized with two different initial conditions, considering the primary shock location as 70 mm from the driven end of the shock tube.
Transient Structural Simulation
Driven section conditions of pressure, temperature and velocity are given before this primary shock and post shock conditions of pressure, temperature and velocity are given as initial guess behind this shock. These postshock conditions are also applied as inlet conditions for the left vertical wall which has inlet boundary condition.
Results and Discussion
System Response Function Estimation
Therefore, the transient responses obtained as an outcome of calibration experiments are considered in the frequency domain using FFT and then the system response function is obtained [Mee (2003)]. In the case of frequency domain convolution, peak impulse of 80 N is selected along with the corresponding voltage signal to evaluate the system response function for strain gauge, while, for piezofilm-based recoveries, impulse force of 120 N is applied to it.
Force Prediction Using ANFIS
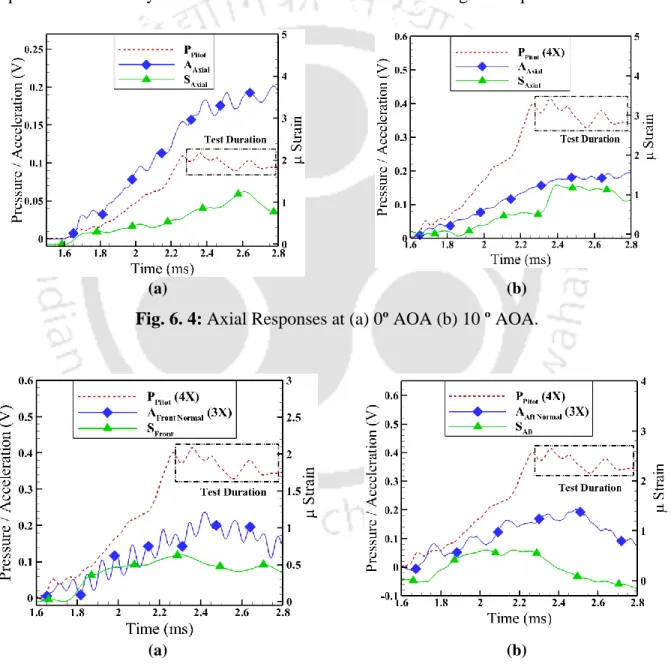
But it is seen that the strain gauge responds to the application of the load after 17.48 microseconds. Comparison of the strain signal from the experiments and the structural simulation is shown in Fig.
Introduction
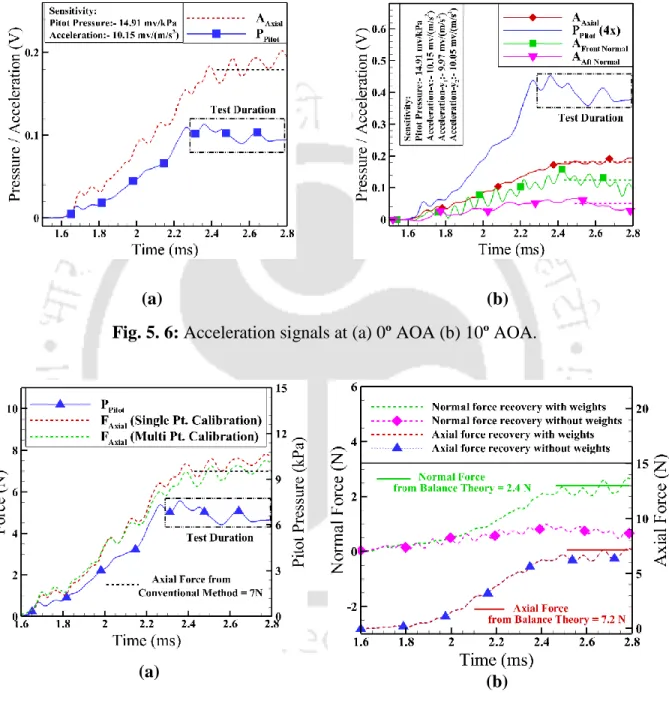
Considering the mentioned limitations, a new multi-point calibration methodology is proposed as an attempt to improve the reliability of the accelerometer-based force measurement technique. Details of the calibration process, its integration with the optimization process, shock tunnel tests and the actual force recovery are discussed in the following sections.
Model and Force Balance
Such a calibration or training strategy does not take into account the full dynamics of the system; the system response function thus obtained would not be unique due to its dependence on the choice of point to be considered in calibration. Details of the calibration process, its integration with the optimization process, shock tunnel tests and actual force recovery are discussed in the subsequent sections. respectively as shown in fig.
Calibration and Prediction Methodology
Calibration Experiments
Optimization for Orthogonal Inputs of Calibration
After that, GA is used for calculating the weights, which correspond to calibration locations, which finally help to estimate the pure axial force and pure normal force. Hence, the objective function for the GA is set to maximize the axial force (Fx) while considering the constraint of making the normal force (Fy) and induced moment (Mz) zero.
Force Recovery Algorithm
Experimental Facility
Results & Discussion
Validation of Calibration Process
Furthermore, the accuracy of a recovered impulse power from any of the calibration experiments, applied to a point, is checked without changing parameters of the ANFIS structure. It was noted that there is a nominal deviation of ± 2.3% for peak magnitude of axial force and ± 1.8% for peak magnitude of the normal force.
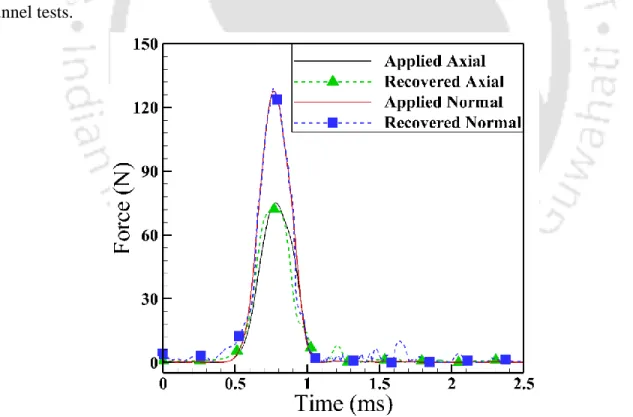
Force Recovery of Shock Tunnel Experiments
Similarly, the recovered axial and normal force for 100 AOA cases along with the theoretically estimated steady-state values of the forces are plotted in Fig. In this case, the numerical value of the prediction is found to be 6.7 N for axial force and 1.78 N for normal force.
Introduction
Test Model and Force Balances
The output of the sensor can be connected directly to the acquisition system via the charge amplifier. After replacing all parameters with the corresponding values from the PVDF sensor, the sensitivity factor is estimated to be approximately 12 mV/μ-strain.
Force Balance Calibration Methodology
Calibration Experiments
Therefore, one of the main goals of the current studies is to evaluate the applicability of the soft computing technique, ANFIS, for training and predicting the inverse force using the strain response of the piezofilm. Therefore, this proposal is expected to be useful for any angle of attack test of the model or for any test setup.
Force Prediction Methodology
95 | Page previous chapter, a new multi-point calibration methodology was developed, as part of the improvement in power prediction. The same procedure was also used for the case of piezofilm-based force balance for the estimation of the forces and the corresponding reactions in mutually orthogonal directions, using the applied impulse forces and the recorded responses at the discrete locations as in Fig.
Experimental Facility
Weights obtained in the previous chapter are used to achieve zero axial force and resultant moment, creating a purely normal loading condition. Then, these orthogonal forces and their responses become the input to the ANFIS architecture to evaluate the correlation between them.
Results & Discussion
Calibration Methodology Validation
In contrast, multipoint calibration is advisable for both inertial and stiffness-based force balances regardless of the experimental conditions. A blunt double cone model is fabricated and tested in shock tunnel for force measurement using three-component piezofilm based force balance and compared with the accelerometer balance.
Introduction
105 | For these aerospikes, page was performed to obtain the flow fields and to estimate the force and moment coefficients [Eghlima and Mansour (2017), Chinnappan et al. These parameters devised while training the calibration data exclusively determine the accuracy of the prediction of force and moment coefficients.
Test Model and Spike Assemblies
106 | The site is capable of predicting force and moment coefficients for flow over blunt bodies, but to verify the wider applicability of this method, it needs to be evaluated with force and moment predictions in the presence of tips along with an aerodynamic model.
Dynamic Calibration of Force Balance
Calibration Experiments
Experimental Facility
108 | A side test section is performed during one of the tests to estimate the steady state duration and also to calculate the free flow conditions that prevailed in the test section.
Numerical Computation
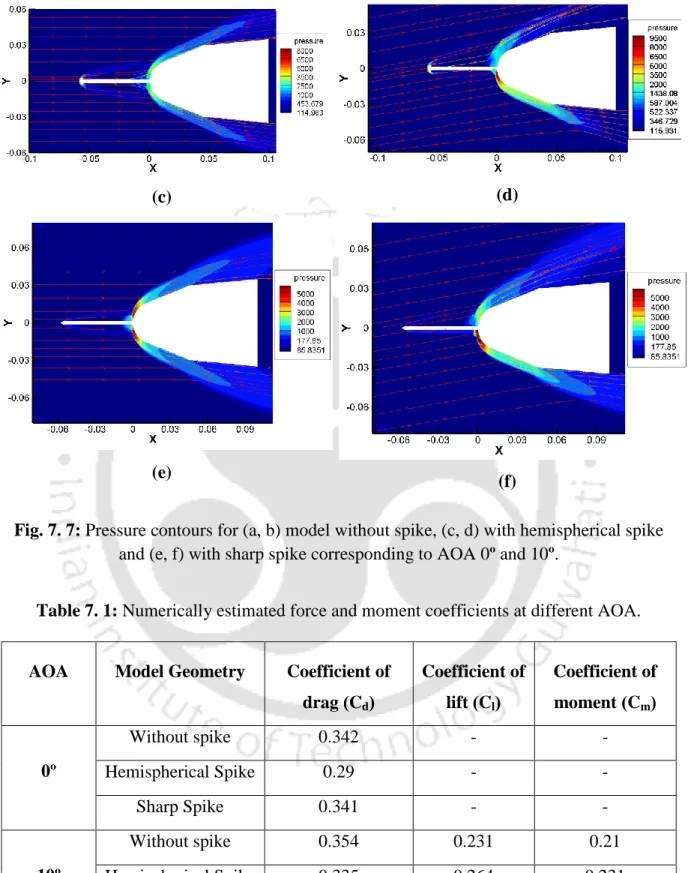
As in hypersonic flow regime, wave drag mainly originating from high pressure on the windward side of the model in the presence of strong shock wave is dominant over the other forces, therefore inviscid simulation is performed. The streamlines along with the pressure contours for each of the configurations at 0º and 10º AOA have been illustrated in fig.
Results and Discussion
CFD Results
Furthermore, it is noted that due to the presence of a point, part of the model remains under its aerodynamic shadow, thus pushing the reattachment point to the edge of the model, which is beneficial from the perspective of drag reduction. However, due to the presence of the reattachment shock in the near wall region of the model, the sharp tip does not significantly change the drag coefficient.
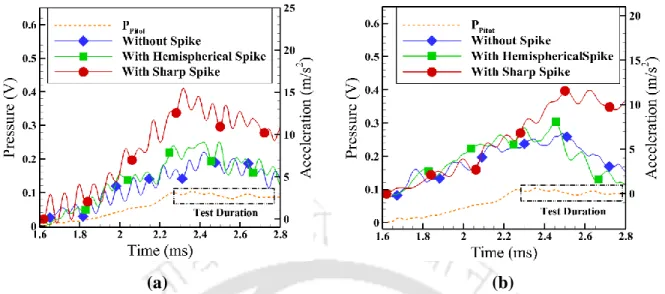
Experimental Force Recovery
However, it is observed that at higher AOA, the spikes do not reduce drag due to the inward shift of the flow reattachment point. Since both the balance theory and the prediction algorithm are able to accurately capture the coefficients of the forces and moment.
Conclusion
Encouraging agreement was observed between force balance theory and ANFIS with the proposed calibration methodology at lower and higher angles of incidence. The acceleration responses at 0° angle of attack show about 5-10% drag reduction on the tipped model.
Future Work
Robinson MJ, Mee DJ, Tsai CY and Bakos RJ (2004), Three-component force measurements on a large scramjet in a shock tunnel, Journal of Spacecraft and Rockets. Sahoo N and Reddy KPJ (2010), Force measurement techniques for hypersonic flow in shock tunnels, International Journal of Hypersonics.