In this research work, an attempt was made to study the geotechnical characteristics of expansive soil mixed with different compositions of lime and fly ash. The variation of these properties due to the combined addition of fly ash and lime has been systematically investigated. It is noted that there is a significant influence of the combined addition of fly ash and lime and aging on the geotechnical properties of expansive soil.
The performance enhancement of expanded clay due to the combined addition of lime and fly ash is clearly discussed and quantified in this study. Based on the results, suggestions are made to maximize the utility of grace wherever possible.
LIST OF TABLES
68 4.9 ES-FA mixtures shown in plasticity graph 69 4.10 Liquid limit versus lime content for ES-FA mixtures (without drying) 70 4.11 Liquid limit versus lime content for expanded soil (F0) in different. 127 6.6 Swelling percentage of ES-FA mixtures in oedometer 128 6.7 Linearized plots for swelling percentage of ES-FA mixtures inside. Mixed FA 137 6.16 Variation of swelling pressure with specific surface area of ES-FA.
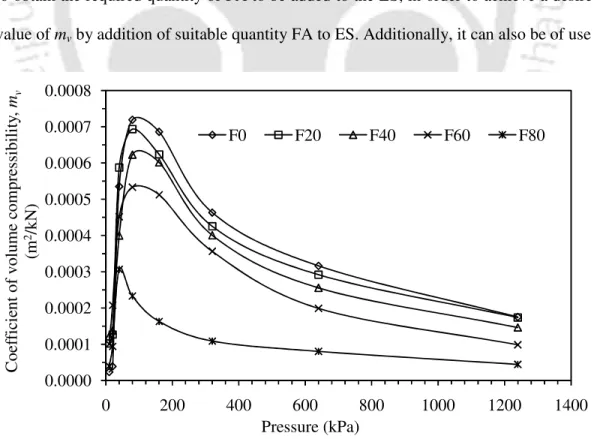
152 7.4 Variation of compression index with FA content 152 7.5 Variation of mv with pressure for different ES-FA mixtures 153 7.6 Variation of peak mv of ES-FA mixtures with FA content 154 7.7 Percentage difference in mv of ES due to adding FA for different .
NOTATIONS
INTRODUCTION
Another effective method for expansive soil stabilization is the use of additives that help minimize the volume change due to swelling. The various additives used to stabilize expansive soils include lime, cement, cohesionless materials such as sand and fly ash. However, a few studies argue against the use of lime in a specific type of expansive soil consisting of sulfate because of the undesirable heave-enhancing reaction (Hunter 1988).
In addition, stabilization can be improved by adding an optimal lime percentage to fly ash-modified expansive soil. It is noted that there are not many studies dealing with the physical and geotechnical characterization of extensive soils modified with both fly ash and lime.
LITERATURE REVIEW
- GENERAL
- LIME TREATMENT OF EXPANSIVE SOIL .1 Mechanism
- Effect on Plasticity Characteristics
- Effect on Compaction
- Effect on Strength
- Effect on Swelling
- Effect on Compressibility
- TREATMENT OF SOIL WITH FLY ASH
- CONCLUDING REMARKS AND OBJECTIVE OF PRESENT STUDY
- SCOPE OF WORK
The study compared the behavior of the mixtures of soil lime, soil cement and soil fly ash. The liquid limit decreased and the plastic limit increased as the fly ash content increased. The undrained cohesion (cu) of the expansive soil mixed with fly ash increased with the increase in fly ash content.
To study the influence of lime-fly ash on changes in the index of expansive soils. With this in mind, the influence of lime and fly ash on the compressibility of expansive soils was investigated.
MATERIALS AND METHODS
- MATERIALS
- CHARACTERIZATION OF EXPANSIVE SOIL .1 Physico-Chemical Properties of Expansive Soil
- Composition of Expansive Soil
- Index Properties of Expansive Soil
- CHARACTERIZATION OF FLY ASH .1 Physico-Chemical Properties of Fly Ash
- Composition of Fly Ash
- Index Properties of Fly Ash
- PLANNING OF EXPERIMENTS
- TEST METHODS
- Tests for Physico-Chemical Properties
- Tests for Composition
- Tests for Index Properties
- Tests for Engineering Properties
- SUMMARY
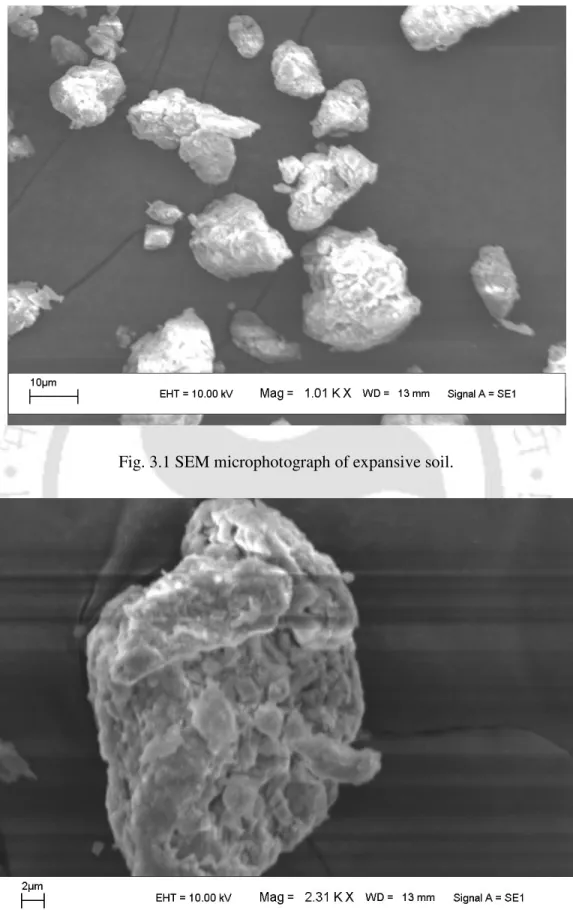
Scanning electron microscopy (SEM) is performed to reveal the microstructure and texture of expanded soil. Energy dispersive X-ray (EDX) analysis was done on the scanning electron microscope to find the elemental composition of the fly ash. The liquid limit of fly ash is found to be 27% as tested in the cone penetration test.
The specific surface area of expansive soil-ash mixtures is measured using (i) the BET method and (ii) the method described by Sridharan and Rao (1972). Scanning electron microscopy is done to reveal the microstructure and texture of the expansive soil and ash.
PLASTICITY BEHAVIOUR
- INTRODUCTION
- EVALUATION OF LIQUID LIMIT DETERMINATION METHODS
- PLASTICITY OF ES-FA MIXES
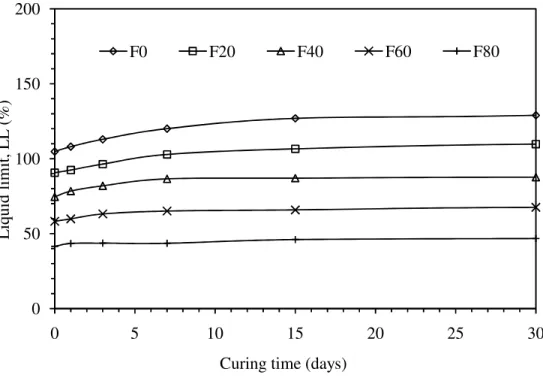
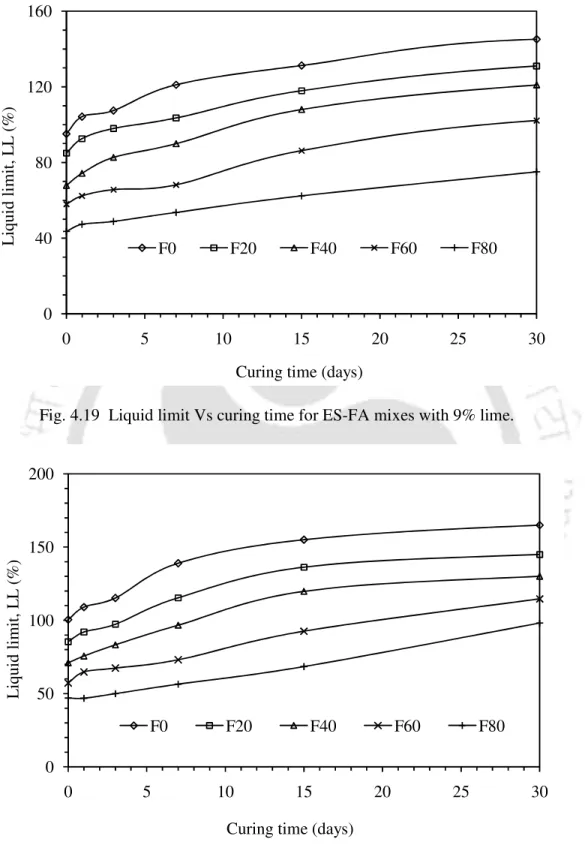
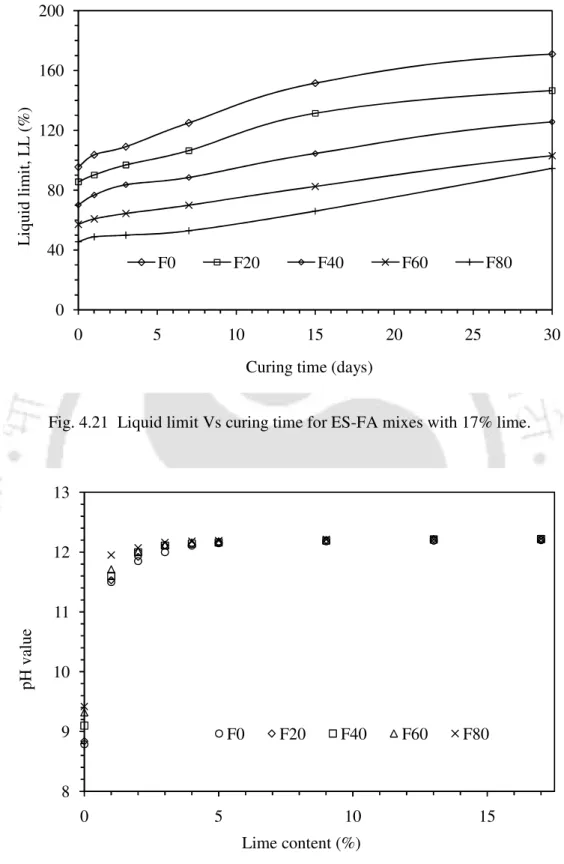
- PLASTICITY BEHAVIOUR OF ES-FA-LIME MIXES .1 Liquid Limit
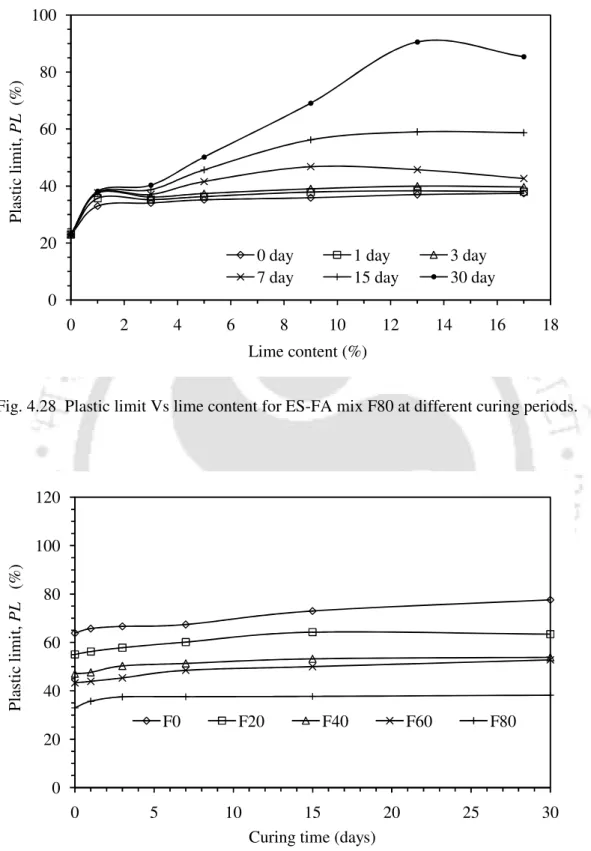
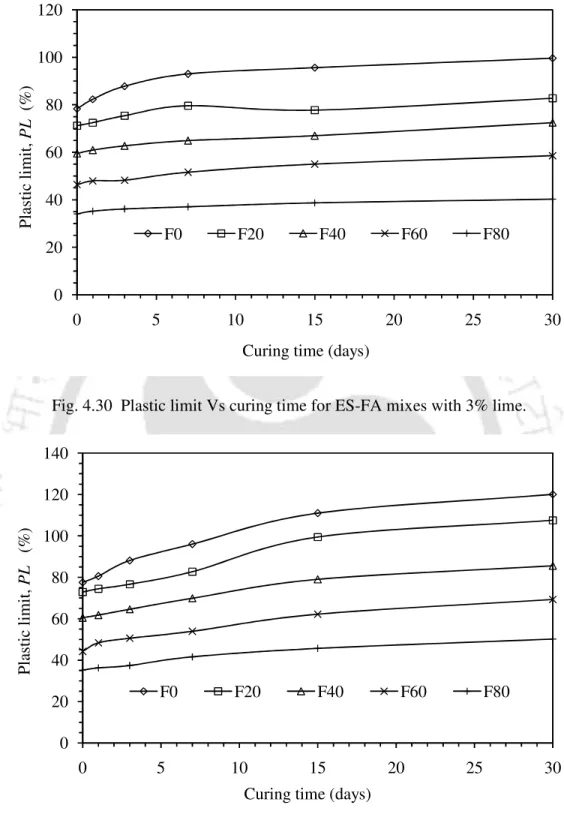
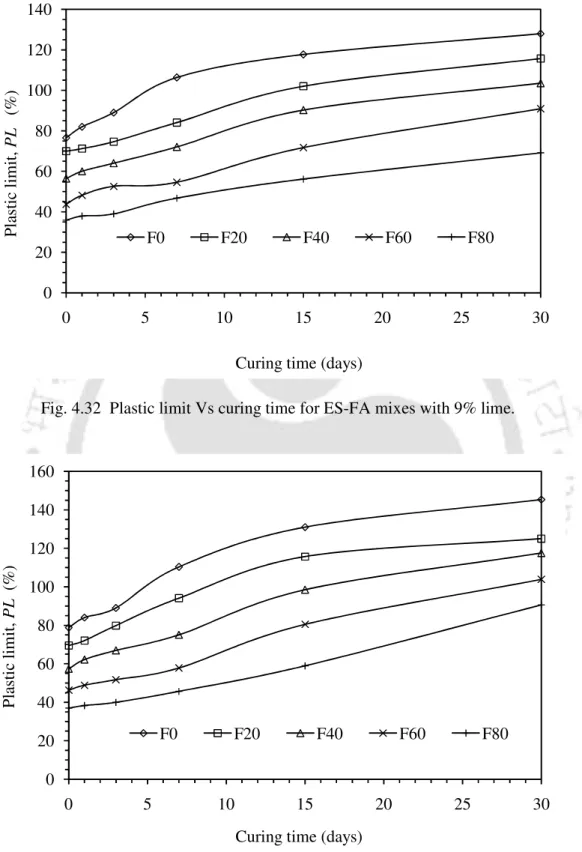
- Plastic Limit
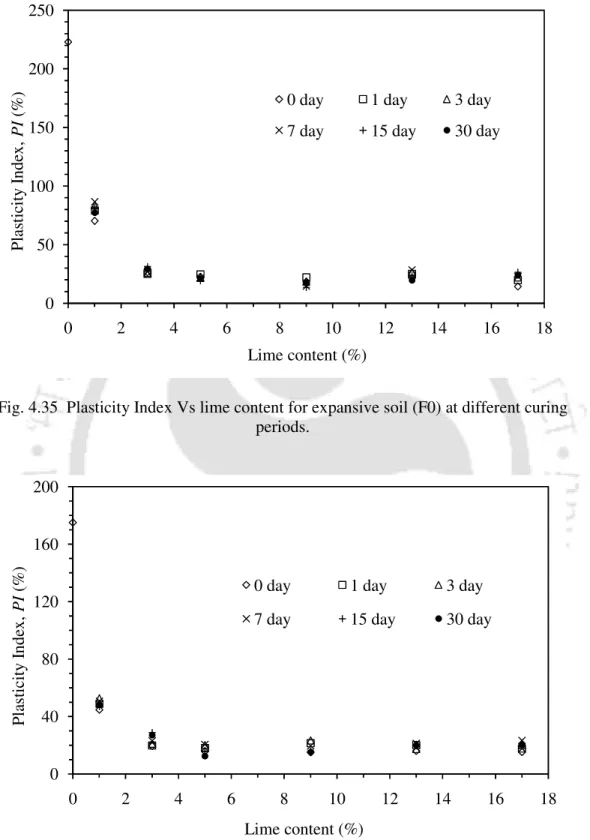
- Plasticity Index
- COMPARATIVE ANALYSIS
- SUMMARY
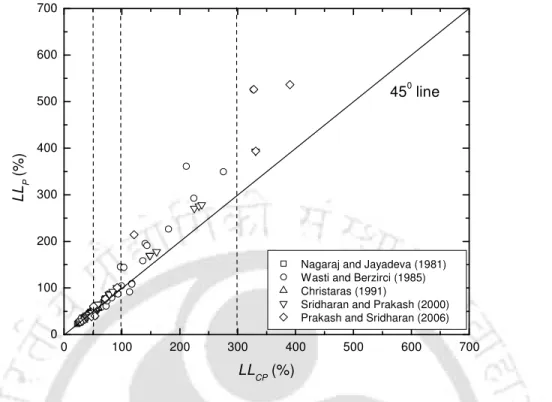
In most cases, the percussion method gives a higher LL compared to the cone penetration method. Therefore, soil failure occurs at higher water content, resulting in a higher value of LLP. In general, LL represents the fluid consistency of the soil at which the shear strength becomes negligible.
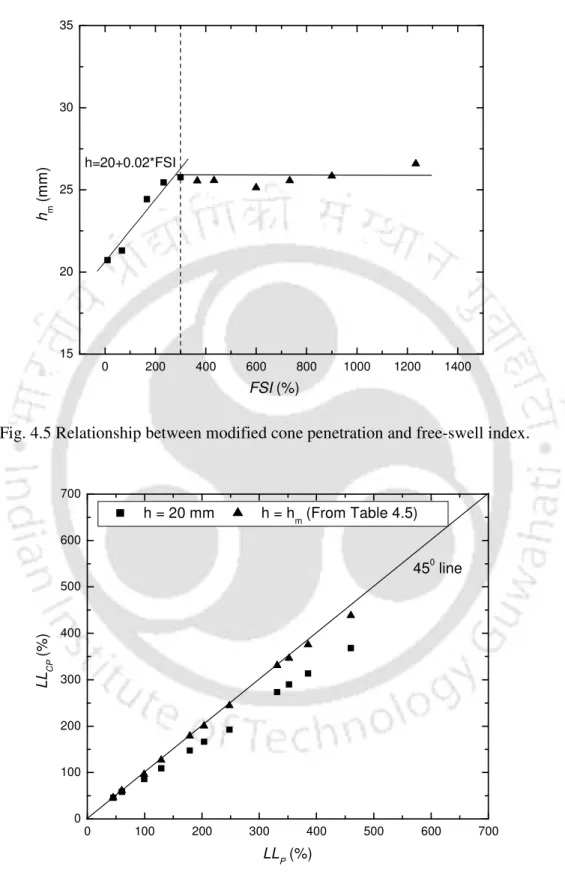
With this in mind, attempts have been made to reevaluate LLCP based on the free swell index property of the soil. To obtain a unique LL using both methods, an adjusted penetration value was derived for soil with a high LL content, based on the free swelling index property of the soil, as discussed in the next section. 4.8 results in a reduced water holding capacity (adsorption) of the soil, which leads to reduced plasticity.
The pH value of the soil-water system turns out to have increased with the increase in the amount of lime added to it (Fig. 4.22). This gel water, together with the physico-chemically absorbed water, on the clay surface, has caused an increase in the LL of the soils. This has led to an increase in soil water content causing an increase in PL.
Changes in the plasticity properties of ES-FA soils due to the use of lime are shown in Figures 4.40 and 4.41 and in Table 4.8. Also, previous studies show that the impact method is a better representation of soil plasticity properties. In view of this, a modified methodology based on the free swelling index property of the soil has been proposed to obtain liquid limits for cone penetration comparable to the percussion method.
To achieve this, a modified penetration limit has been derived based on the free swelling index of the soil. Based on this observation, it is found that the free swelling index of the soil can be used to change the value of penetration for calculation of liquid limit determination.
COMPACTION BEHAVIOUR
- INTRODUCTION
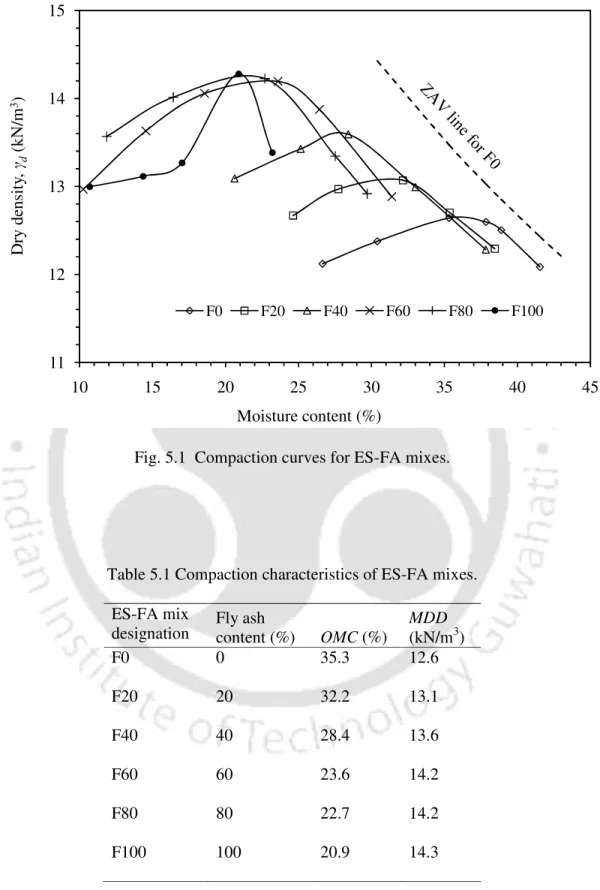
- COMPACTION BEHAVIOR OF ES-FA MIXES .1 Compaction characteristics
- Correlations
- COMPACTION BEHAVIOUR OF LIME TREATED ES-FA MIXES
- Correlations
- SUMMARY
In general, the compaction response of the ES grew flatter with increased percentage of fly ash added to it. This suggests that the workability of the expansive soil can be increased by adding fly ash. As a result, there is not much improvement in the overall density of the expansive soil-fly ash mixture.
Therefore, it can be said that 60% is the optimal FA content that gives the highest density for ES-FA mixtures. Gurtug and Sridharan (2002) observed for fine-grained soils that the maximum dry density is about 98% of the dry density at the plastic limit water content, which means that the optimum moisture content continues to increase and correspondingly the dry density continues to decrease with increasing water content lime.
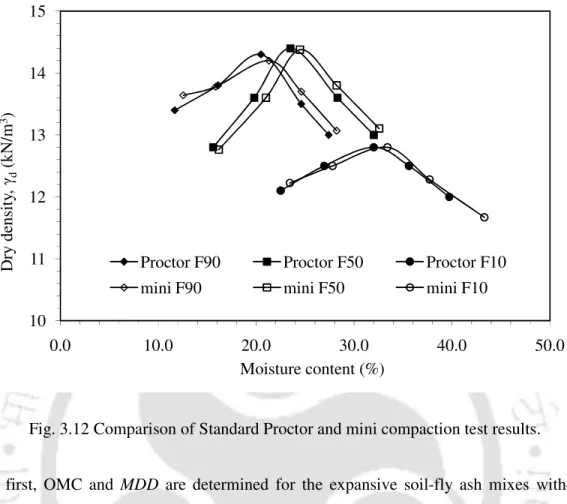
It could be observed that FA at any percentage of lime has significant influence on soil OMC and MDD. In this context, it can be said that ES-FA mixtures with 1% lime are in the transitional stage of modification from lime = 0% and lime > 1%. It is observed that fly ash has increased the maximum dry density and reduced the optimum moisture content.
With the addition of lime, the maximum dry density of the samples decreases, and the decrease depends on the amount of lime and the amount of expansive soil in the amended soil.
SWELL CHARACTERISTICS
- INTRODUCTION
- SWELL BEHAVIOUR OF ES-FA MIXES .1 Free Swell of ES-FA Mixes
- Swelling Characteristics of ES-FA Mixes in Oedometer
- Swell Pressure of ES-FA Mixes
- SWELL BEHAVIOUR OF ES-FA MIXES TREATED WITH LIME
- Free Swell of ES-FA-Lime Mixes
- Swell Percentage of ES-FA-Lime Mixes in Oedometer
- Swell Pressure Measurement of ES-FA-Lime Mixes in Oedometer
- COMPARATIVE ANALYSIS
- SUMMARY
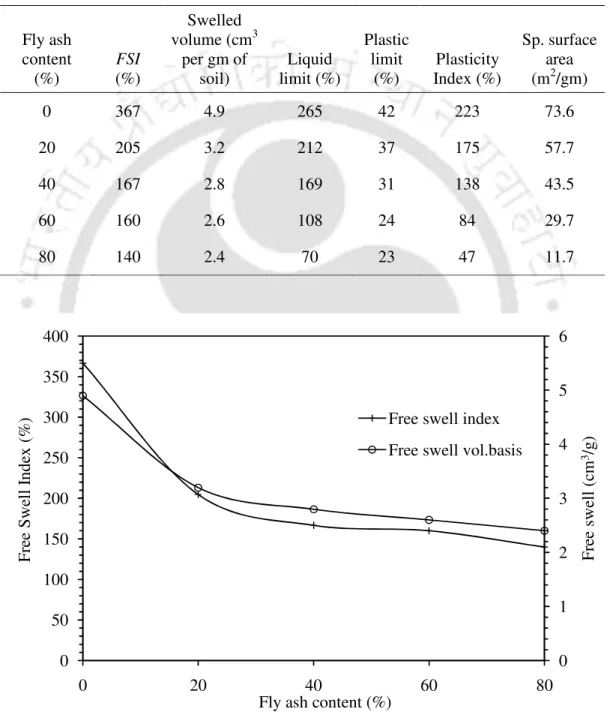
In view of this, the swelling responses of ES-FA lime mixtures at higher lime contents have also been investigated. Free Swell Index (FSI) of ES-FA mixtures is shown in Table 6.1 along with the index properties. The ratio of free swelling of ES-FA blends has been plotted as a function of LL and PI as shown in Fig. 6.4.
Fig.6.4 Variation of (a) Free Swelling Index and (b) free volume swelling per gm with liquid limit and Plasticity Index of ES-FA mixtures. Fig.6.5 Variation of FSI and free swelling volume per gm with SSA of ES-FA mixtures. The swelling percentage (ε) of the ES-FA mixtures was studied using the oedometer method over a period of 28 days, as described in Section 3.5.4.
The εmax and FSI of different ES-FA mixtures are plotted as a function of FA content, as shown in Figure 6.9. The variation of εmax of ES-FA mixtures in the oedometer is plotted as a function of LL, PL, PI and SSA, as shown in Fig. The same oedometer setup that was used to determine εmax was used to determine the heave pressure of the ES-FA mixtures.
The εmax of the ES-FA-lime mixture is plotted as a function of LL as shown in the figure. Therefore, addition of 1% lime to ES-FA mixtures would help increase FA utilization (depending on FA requirement and availability). ) to reduce EC swelling characteristics in the field. There are not many studies dealing with the swelling characteristics of lime-treated ES-FA blends.
COMPRESSIBILITY BEHAVIOUR
- INTRODUCTION
- CONSOLIDATION BEHAVIOUR OF ES MIXED WITH FLY ASH
- CONSOLIDATION BEHAVIOUR OF ES-FA MIXES TREATED WITH LIME
- Variation of c c and m v with Plasticity Index
- COMPARISON OF INDIVIDUAL EFFECTS OF LIME AND FLY ASH ON COMPRESSIBILITY OF ES
- SUMMARY
It can be noted that addition of lime makes the soil (ES) more rigid and resistant to compression. The variation of cc and mv of ES with addition of lime for different pressure ranges is shown in Fig. It could be observed that the cc of ES is significantly reduced by the addition of lime.
Fig.7.8 Variation of void ratio with pressure for ES treated with different percent lime content. In general, it can be noted that the simultaneous addition of lime and FA further reduces the compressibility of ES compared to the FA modified ES. It should be further investigated whether such reactions are responsible for the reversal of trends for cc when percent lime increases.
As discussed in the previous section, the influence of lime addition on mv is more visible in the lower range of 40 to 80 kPa. These results indicate that higher percentage of lime addition (>13%) causes undesirable reactions in FA modified ES leading to an increase in compressibility. For a better quantification of the effect of lime addition on FA amended ES, cc and mv.
Increasing fly ash content gradually reduces cc and mv where there is a sharp reduction in these properties within a limit lime content of about 5%, where further addition of lime is not beneficial in reducing compressibility. Combined effect of 5% lime and 20-40% FA addition will give the most suitable benefit to reduce compressibility of ES. For all practical purposes, the maximum percentage of lime modification of FA modified ES can be limited to 5% for obtaining optimal reduction in compressibility.