Fig.3.1 (a) Variation of pressure with distance (b) Formation of shock front in a shock wave. c) Variation of excess pressure with distance from the explosion center at different times. 22 22 Fig.3.6 Simplified resistance function of an elastoplastic SDOF system 24 Fig.3.7 Maximum response of elastoplastic SDF system to a triangular load 24 Fig.3.8 Strain rates associated with different types of loading 25 Fig. Fig.4.2 Positive phase duration of overpressure for surface blasting 30 Fig.4.3 Peak overpressure and maximum dynamic pressure for surface blasting 31 Fig.4.4 Positive phase duration of overpressure and dynamic pressure 32.
LIST OF TABLES
INTRODUCTION
The earthquake problem is quite old, but most of the knowledge on this subject has been accumulated during the last fifty years. The blasting problem is fairly new; information on developments in this field is made available mostly through publication by the Army Corps of Engineers, Department of Defense, U.S.A. Much of the work is done by the Massachusetts Institute of Technology, the University of Illinois, and other leading educational and engineering institutions. companies.
LITERATURE REVIEW OBJECTIVE AND SCOPE OF
REVIEW OF LITERATURE
GENERAL
14] studied the effects of the stand-off distance on high shells of different heights, carried out with the aim of studying the effect of distance (ground-zero distance) of charge on the detonation response. An important task in blast-resistant design is to make a realistic prediction of the blast pressure. The distance of blast from the structure is an important datum that determines the size and duration of the blast charges.
OBJECTIVE AND SCOPE OF THE PRESENT WORK OBJECTIVE
SCOPE OF THE STUDY
BACKGROUND
EXPLOSION AND BLAST PHENOMENON
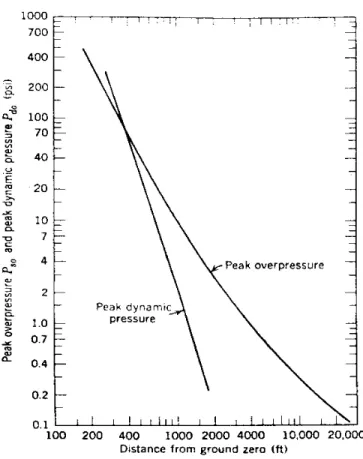
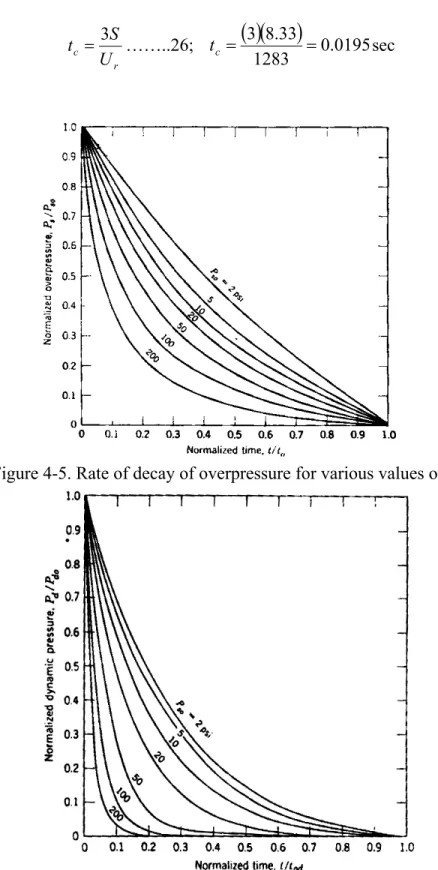
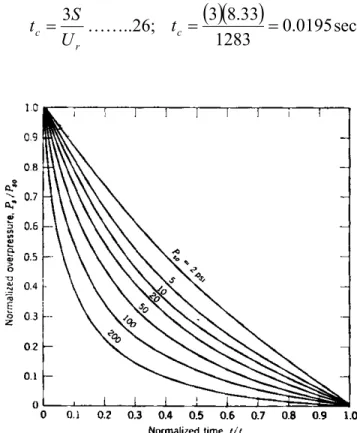
After a short time, at a certain distance from the center of explosion, the pressure behind the shock front becomes smaller than that of the surrounding atmosphere and becomes the so-called negative phase or suction. The peak dynamic pressure decreases with increasing distance from the center of explosion, but the rate of decrease differs from that of the peak overpressure. At a given distance from the explosion, the time variation of the dynamic Pd behind the shock front is somewhat similar to that of the overpressure Ps, but the rate of decrease is usually different.
EXPLOSIVE AIR BLAST LOADING
- BLAST WAVE SCALING LAWS
- PREDICTION OF BLAST PRESSURE
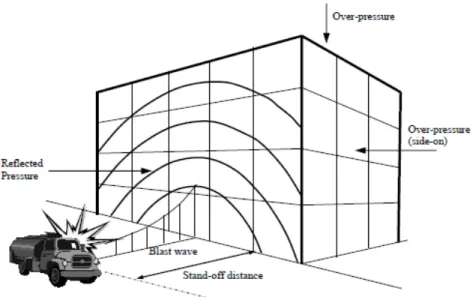
As the dwell distance increases, the duration of the positive phase burst wave increases resulting in a lower amplitude and longer duration shock pulse. Loads placed extremely close to the target structure impose a highly impulsive and high-intensity pressure load on a localized region of the structure; the more widely spaced loads produce a uniform pressure distribution of lower intensity and longer duration throughout the structure. A normalized universal description of blast effects can be given by scaling the distance with respect to (E/Po)1/3 and scaling the pressure with respect to Po, where E is the energy release (kJ) and Po is the ambient.
Scaling laws provide parametric correlations between a given explosion and a standard charge of the same substance. In 1987, Mills introduced another expression of peak overpressure in kpa, where W is the equivalent charge weight in kilograms of TNT and Z is the scaled distance. The speed of the air particles, and therefore the wind pressure, depends on the peak overpressure of the explosion wave.
The overpressure resulting from wave reflection disappears as the disturbance propagates to the edges of the obstacle at a speed related to the speed of sound (Us) in the compressed and heated air behind the wave front. For skeletal structures, the effective duration of the net overpressure load is therefore small, and the resistive load based on the dynamic pressure is then probably dominant. Conventional wind load pressure coefficients can be used, with the conservative assumption of an instantaneous build-up as the wave passes the plane of the relevant building facade, with the front and rear loads being numerically cumulative for the total load effect on the building. the structure.
Various formulations have been put forward for the rate of decay of the dynamic pressure.
STRUCTURAL RESPONSE TO BLAST LOADING
- ELASTIC SDOF SYSTEMS
- ELASTO-PLASTIC SDOF SYSTEMS
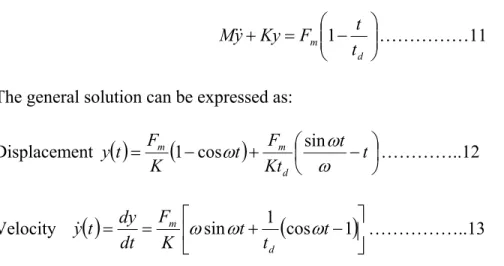
The equation of motion of the undamped elastic SDOF system for a time ranging from 0 to the positive phase duration, td, is given by Biggs (1964) as. The maximum response is defined by the maximum dynamic deflection ym that occurs at time tm. The structural response to blast loading is significantly influenced by the ratio td/T or ωtd (td/T. = ωtd/ 2π.
Exact analysis of dynamic response is then only possible by step-by-step numerical solution requiring non-linear dynamic finite element software. However, the degree of uncertainty in both the determination of the load and the interpretation of acceptability of the resulting deformation is such that solving a postulated equivalent ideal elasto-plastic SDOF system (Biggs is commonly used. For example, uniformly simply supported beam has first mode shape φ(x) = sin πx/L and the equivalent mass M = (1/2)mL, where L is the span of the beam and m is mass per unit length.
The response of the ideal bilinear elasto-plastic system can be evaluated in closed form for a triangular load pulse involving rapid rise and linear decay, with maximum value Fm and duration td. The result for the maximum displacement is generally presented in TM plot form as a family of curves for selected values of Ru/Fm showing the required ductility μ as a function of td/T, in which Ru is the structural resistance of the beam and T is the period natural (Figure 3.7).
MATERIAL BEHAVIORS AT HIGH STRAIN RATE
- DYNAMIC PROPERTIES OF CONCRETE UNDER HIGH-STRAIN RATES
- DYNAMIC PROPERTIES OF REINFORCING STEEL UNDER HIGH-STRAIN RATES
Due to the isotropic properties of metallic materials, their elastic and inelastic response to dynamic loads can be easily monitored and evaluated. From this series of tests it was concluded that body-centered cubic (BCC) materials (such as mild steel) showed the greatest strain rate sensitivity. It has been found that the lowest yield strength of mild steel can almost be doubled; ultimate tensile strength can be increased by about 50%; and the upper yield strength can be significantly higher.
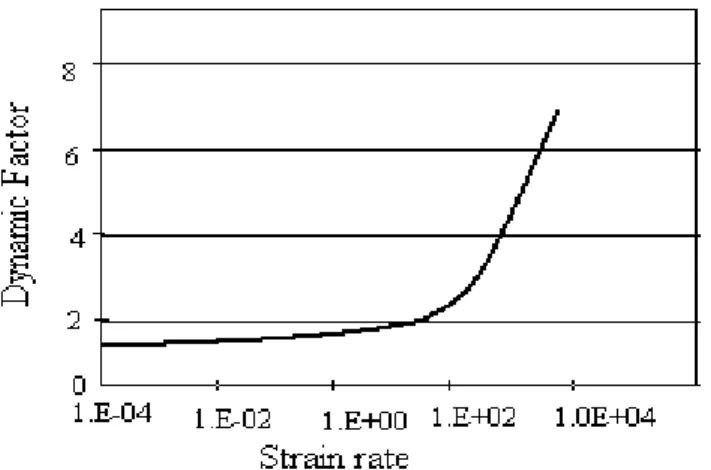
This has been described in terms of the dynamic enhancement factor (DIF), which can be evaluated.
![Figure 3.9 Stress-strain curves of concrete at different strain rates. [9]](https://thumb-ap.123doks.com/thumbv2/azpdfnet/10540726.0/40.918.244.668.123.431/figure-stress-strain-curves-concrete-different-strain-rates.webp)
DYNAMIC LOADING ON STRUCTURES
DYNAMIC LOADING ON STRUCTURES
- AVERAGE PRESSURE ON FRONT FACE
- AVERAGE PRESSURE ON BACK FACE
- AVERAGE NET HORIZONTAL PRESSURE
- AVERAGE PRESSURE ON ROOF AND SIDES
- DYNAMIC LOADING ON OPEN-FRAME STRUCTURES
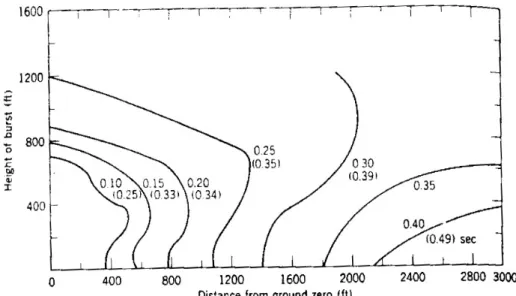
In Figure 4.2, the duration of the positive phase (to1) of overpressure Ps for 1 kiloton weapon power is 0.314 seconds. The change in mean pressure (Pfront) of the front surface can be easily determined. The average pressure on the outside of the end face can be calculated in the same way as for closed rectangular structures, except that S in Eq.
To understand the meaning of the symbols in Equation 36, consider the front face in Fig. An is the area of each of the parts of the divided front face, excluding the apertures. The average pressure on the inside of the front face is zero at t = 0 and it takes time 2L/Uo to reach the value Ps of the overpressure of the shock wave.
The dynamic pressures Pd are assumed to be negligible on the interior of the structure. The variation with time of the average pressure on the inside and outside of the front surface is shown in Fig. The internal pressure, as for the front surface, requires a time of 2L/Uo to achieve the overpressure of the wind wave.
Most of the load on an open frame structure is a resistive load.
FINITE ELEMENT MODEL
- INTRODUCTION
- STRUCTURAL NONLINEARITY
- NONLINEARITIES IN REINFORCED CEMENT CONCRETE
- GEOMETRIC NONLINEARITY
- MATERIAL NONLINEARITY
- STRESS-STRAIN CURVES OF CONCRETE AND STEEL .1 STRESS-STRAIN CURVES OF CONCRETE
- MODULUS OF ELASTICITY & POISSON’S RATIO
- STRESS-STRAIN CURVE OF STEEL
- MODELING USING ANSYS
- SOLID65
- LINK8
- MATERIAL MODELS
- STEEL REINFORCEMENT
- CONCRETE MODELS
For example, in one-dimensional flexural elements modeled by the 'Euler-Bernouli Beam', the geometric non-linearity can be reasonably represented by approximating the stresses upwards. Typical stress-strain curves of concrete of different qualities, obtained from standard uniaxial compression tests, are shown in Figure 5.1 (Pillai and Menon [17]). Typical uniaxial stress-strain curves are as shown in Figure 5.2 for different steels.
A sudden change in the modulus of the structure is noticeable for the material above the yield point. However, the response of a reinforced concrete column may be different depending on the input given to the concrete and steel material models in ANSYS. Thus, the specification of the individual relationship between stress and strain is sufficient to define the material properties needed in the analysis of reinforced concrete structures.
For all practical purposes, steel exhibits the same stress-strain curve in compression as in tension. In compression, the stress-strain curve for concrete is linearly elastic up to about 30% of the maximum compressive strength. The numerical expressions (Desayi and Krishnan [16]), equation 39 and 40, were used together with equation 41 (Gere and Timoshenko [11]) to construct the multi-linear stress-strain curve for the concrete under study.
The multi-linear isotropic stress-strain implementation requires the first point on the curve to be defined by the user.
RESULTS AND DISCUSSION
RC COLUMN SUBJECTED TO BLAST LOADING
In this study, a 6.4 m high ground floor column of a multi-storey building was analyzed (see Figure 6.1). The parameters considered were concrete strength 40 MPa for normal strength columns (NSC) and 80 MPa for high strength columns (HSC). The distance between the brackets is 400 mm for regular detailing and 100 mm for special seismic detailing. It has been found that with increasing concrete compressive strength, the column size can be effectively reduced.
In this case, the column size was reduced from 500 x 900 mm for the NSC column down to 350 x 750 for the HSC column details given in Table 6.1, while the axial load capacity of the two columns remains the same. The blast load was calculated from data from the Oklahoma bomb report [13] with a distance of 5 m. The 3D model of the column was analyzed using ANSYS, which takes into account both material nonlinearity and geometric nonlinearity.
The effects of the blast load were modeled in the dynamic analysis to obtain the column deflection time history. Scaled unit of positive incident impulse is/W1/3 Scaled positive sentence duration to/W1/3 Scaled arrival time tA/W1/3.
- RESULTS
The lateral deflection at center versus time history of two columns made of NSC and HSC are shown in Figures 6.6 and 6.7. It can be seen that under this bomb explosion at close range both columns collapsed in shear. Figures 6.6 and 6.7 show that the effect of shear reinforcement is also significant.
The ultimate lateral displacements at collapse are increased from 54 mm (400 mm stirrup spacing) to 69 mm (100 mm stirrup spacing) for the HSC column. These values for the NSC column are 29 mm (stirrup spacing 400 mm) and 43 mm (stirrup spacing 100 mm) respectively.
CONCLUSIONS AND FUTURE SCOPE OF STUDY
CONCLUSIONS AND FUTURE SCOPE OF STUDY
CONCLUSIONS
FUTURE SCOPE OF STUDY
R EFERENCES
1995), "Critical Distance for Blast Resistance Design", Computer and Structure, Vol. 2004), “Response spectrum solutions for blast loading”, Journal of Structural Engineering, p. 28-44. Shope (2006), “Response of Wide Flanged Steel Columns Subjected to Constant Axial Load and Lateral Impact Load”. Borvik et al. (2009) “Response of Structures to Planar Impact Loads – A Finite Element Engineering Approach” Computers and Structures 87, p. 507–520,.
A PPENDIX
APPENDIX A
Peak incident pressure versus the ratio of normal reflected pressure/incident pressure for a free air burst.