INTRODUCTION
Generalities
The other side effects are mainly due to the partial glutaminase activity of most L-asparaginases (Distasio et al., 1982; Gallagher et al., 1989; Manna et al., 1995). The various side effects of this drug are mainly due to the presence of partial glutaminase activity (Distasio et al., 1982; Muller and Boos, 1998).
Subcellular localization of L-asparaginase
Optimization of process parameters for enhance production of L-asparaginase 4
Recently, Hymavathi et al., (2009) reported the enhancement of L-asparaginase production from Bacillus circulans MTCC 8574 isolated using RSM in solid state fermentation. Chromatographic techniques are widely used as high performance purification steps in biotechnology (Martın et al., 2002).
Bioreactor studies to improve the L-asparaginase production
Various human cancer cell lines for in vitro cytotoxicity have been investigated to determine the potential of L-asparaginase from different sources (Cappelletti et al., 2008; Abakumova et al., 2009; However, very few reports are available for enhancing the enzyme production (Mukherjee et al., 2000; Geckil et al., 2004).
Kinetic modeling of L-asparaginase
Objectives and scope
Isolation, screening and selection of potential glutaminase-free L-asparaginase-producing bacterial strains and localization of L-asparaginase from various microorganisms. Development of unstructured models for dual substrate utilization kinetics for growth and L-asparaginase production by P .
Organization of the thesis
The enzyme was purified to homogeneity by a two-step procedure comprising cation exchange chromatography and affinity chromatography. The pH dependence of Vmax shows one transition in the acidic pH range with pKa = 5.4 and the pH dependence of Vmax/Km shows two transitions with pKa. The inoculated culture was transferred (2% v/v) into a stirred tank fermenter – Sartorius Biostat B plus, Germany with a working volume of 4 L. The reactor was operated under uncontrolled pH, at a stirrer speed of 200 rpm, aeration rate of 1.5 vvm and 30°C.
LITERATURE REVIEW
L-asparaginase
The therapeutic response of patients rarely occurs without any evidence of toxicity (Narta et al., 2007). The other side effects are mainly due to glutaminase contamination of most L-asparaginases (Gallagher et al., 1989; Manna et al., 1995).

Historical development
Both enzymes showed clinical activity, which was confirmed in further studies (Roberts et al., 1966; Boyse et al., 1967). Oettgen et al., (1967) were the first to demonstrate the effectiveness of L-asparaginase in people suffering from leukemia.
Subcellular distribution of L-asparaginase
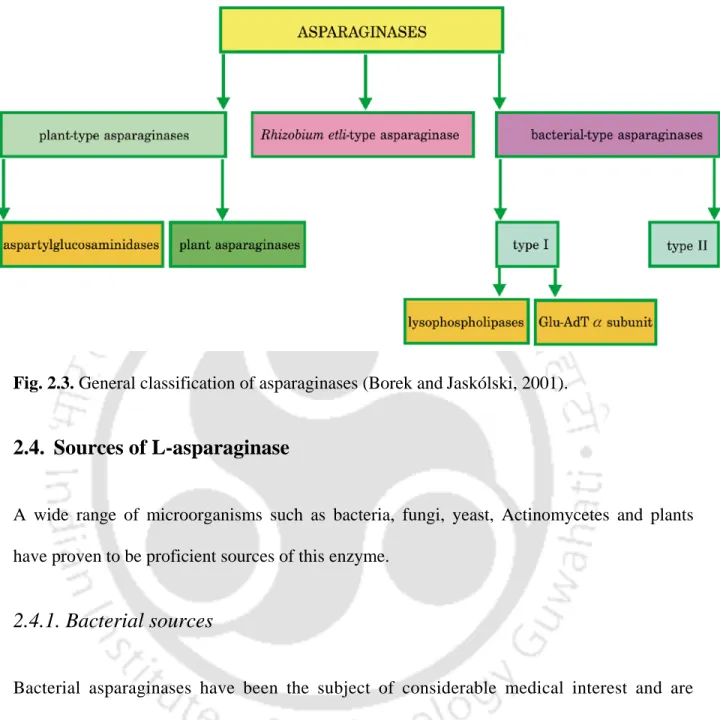
Sources of L-asparaginase
- Bacterial sources
- Fungi and yeast sources
- Actinomycetes sources
- Plant sources
Neto et al., (2006) obtained L-asparaginase from Zymomonas mobilis CP4 and optimized culture conditions. Two isoforms of the enzyme have been reported by Heeshen et al., (1996) from the Bryophyte Sphagnum fallax.
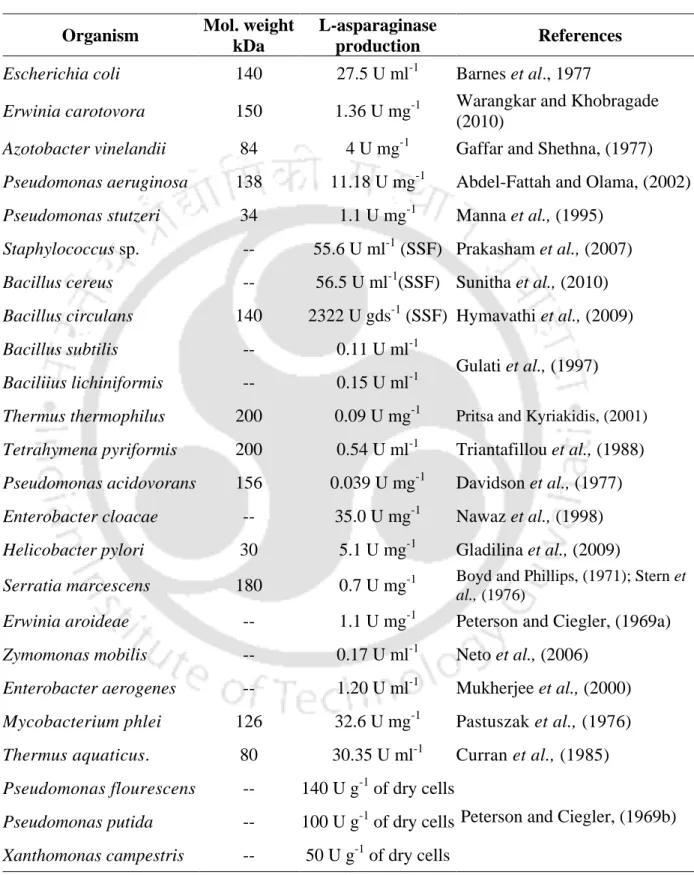
Production of L-asparaginase from various microbial sources
Geckil et al., (2006) have carried out the experiments to understand the effect of different carbon sources (glucose, lactose, mannitol and glycerol) and Vitreoscilla hemoglobin (VHb) on the production of L-asparaginase in Pseudomonas aeruginosa and its VHb- expressing recombinant strain. Prakasham et al., (2007) evaluated the interactions and effect of nutritional (carbon and nitrogen sources), physiological (incubation temperature, medium pH, aeration and agitation) and microbial (inoculum level) fermentation process parameter on the production of L-asparaginase by Staphylococcus sp.–6A.
Properties of L-asparaginase obtained from various microbial sources
Cappelletti et al., (2008) investigated the pathological role and therapeutic potential of L-asparaginase II from H. Gladilina et al., (2009) cloned Helicobacter pylori asparaginase, which is characterized by extremely low glutaminase activity.
Purification and characterization of L-asparaginase
Kotzia and Labrou (2007) reported that the cloning and expression of L-asparaginase from Erwinia chrysanthemi 3937 in E. Basha et al., (2009) reported that the extracellular L-asparaginase from marine actinomycetes optimal activity at pH 7, 5 and 50ºC.
L-asparaginase preparations
The apparent purified molecular weight of extracellular L-asparaginase from Streptomyces gulbargensis was reported to be 85 kDa and optima pH and temperature for the enzyme were 9.0 and 40°C, respectively (Amena et al., 2010). The molecular weight of L-asparaginase is about half that of prokaryotic asparaginase and similar to plant L-asparaginase.
Structure of L-asparaginase
Li et al., (2007) replaced an amino acid with proline (Pro) at a particular hydrogen-bonded turn (β-turn). Bansal et al., (2010) have investigated the structural stability of recombinant L-asparaginase from Pyrococcus furiosus (PfA).
Methods of assay
Yoshimoto et al., (1987) chemically modified the enzyme by attaching a magnetic modifier to the amino groups of L-asparaginase. Zhang et al. (2004a) studied that immobilization of L-asparaginase on silk particles (Sericin) from the silkworm Bombyx mori results in covalent binding of the enzyme.
Treatment with L-asparaginase
Hyakuna et al. (2004) reported successful treatment with asparaginase followed by bone marrow transplantation in patients with leukemia. Steiner et al. (2006) reported an undulating course of ammonia concentrations during an induction treatment containing L-asparaginase.
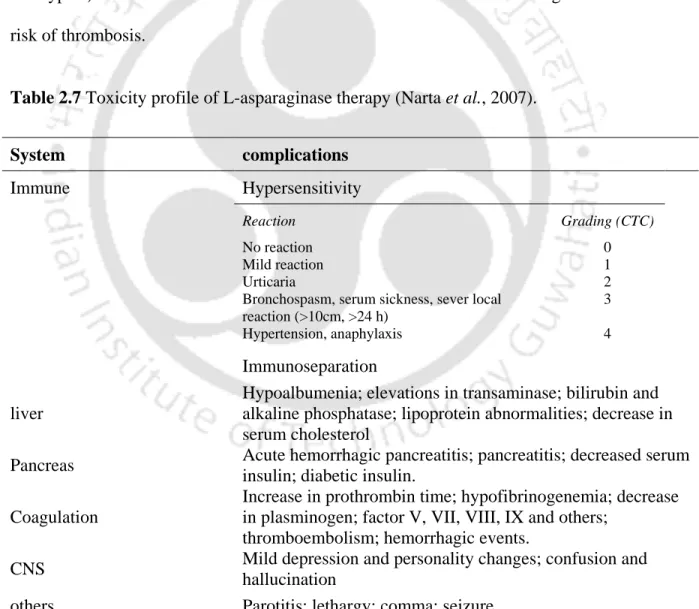
Side effects
Growth hormone deficiency in children receiving chemotherapy for acute lymphoblastic leukemia has been reported by Haddy et al., (2006). A study on the effects of L-asparaginase on antithrombin levels in plasma from patients with acute lymphoblastic leukemia, HepG2 cells, and plasma and liver from rats treated with this drug was conducted by Hernandez-Espinosa et al., (2006).
Resistance to L-asparaginase
Fine et al., (2005) also described that L-asparaginase resistance can be studied by targeting epigenetic changes. Li et al., (2006) reported that down-regulation of asparagine synthetase expression can increase the sensitivity of cells resistant to L-asparaginase.
L-Asparaginase - a subject of considerable medical interest and
A plot of (Ve/Vo) against log Mr was used to find the native weight (Mr) of L-asparaginase. The importance of dehydrolyzed protein on the production of L-asparaginase has been emphasized in the literature (Heinemann and Howard, 1969; Howard and Carpenter, 1972).
MATERIALS AND METHODS
Chemicals and reagents
Chemicals and reagents used in the medium development study were of analytical grade and obtained from HiMedia Company, India. Most of the chemicals used in the specificity study (D-asparagine, DL-asparagine, L-glutamine, D-glutamine, D-aspartic acid, DL-aspartic acid, L-glutamic acid, succinamic acid, L-glutamine, D- glutamine, L-asparagine-t-butyl ester HCl, BOC-L-asparagine, N-α-acetyl-L-asparagine), effectors (EDTA, Iodoacetamide, L-Cistine, L-Histidine, Glutathione, 2-Marceptoethanol, p - Chloromecuribenzoic acid (pCMBA), purification (chromatographic matrices) and antitumor activity (Cell culture plates, culture media and other related chemicals) were purchased from Sigma-Aldrich (Bangalore, India).
Microorganisms
Chemicals and markers used in native PAGE and SDS PAGE were obtained from Bangalore Genei, India. All other chemicals used for protein and glucose analysis were of analytical grade and of the highest purity available in the local market.
Isolation of microorganisms from soil and identification
Nine bacterial strains were isolated from soil samples collected from the premises of an amino acid packaging industry, Himalaya Herbs, Saharanpur, Uttar Pradesh, India for L-asparaginase production.
Cultivation medium and culture conditions
Subcellular localization of L-asparaginase
Analytical methods
- Assay of L-asparaginase and L-glutaminase
- Protein determination
- Dry cell weight (DCW)
- Estimation of glucose
- Estimation of L-asparagine
The protein concentration in the reaction was determined from a standard curve obtained with bovine serum albumin (Sigma) as standard (1 unit OD at 660. The L-asparagine concentration in the sample was determined based on a standard curve obtained with L-asparagine concentration (10-500 µM) vs.
Effect of various carbon sources with or without L-asparagine on
Effect of initial concentration of glucose and L-asparagine on
Role of nitrogen sources on the production of L-asparaginase from P
The regression model was used to evaluate the effect of variables (nitrogen sources) on the production of L-asparaginase. In the present study, the production of L-asparaginase was increased in the presence of L-asparagine.
Optimization of chemical and physical process parameter on
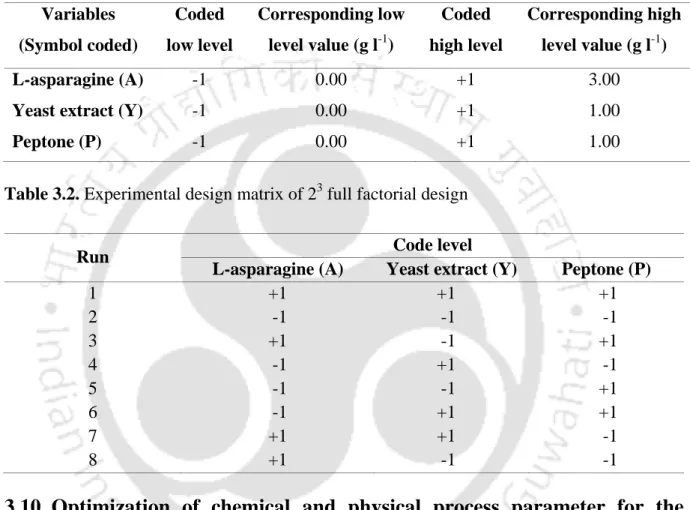
- Screening of medium components by Plackett-Burman
- Optimization of the process parameters by CCD
- Validation of the model at predicted optimum levels of chemical
Isolation and purification of L-asparaginase produced from P
- Enzyme production for purification
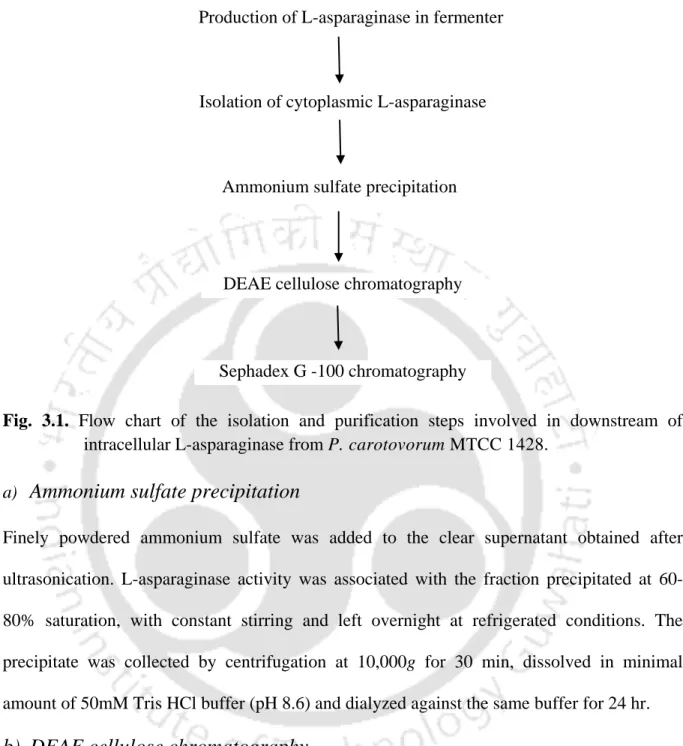
- Isolation and purification
The dialyzed ammonium sulfate fraction was loaded onto the diethylaminoethyl (DEAE) cellulose column pre-equilibrated with Tris HCl buffer (50 mM, pH 9.6) at a flow rate of 1 ml min-1. The sample obtained from the above step was loaded onto the column pre-equilibrated with Tris HCl buffer (50 mM, pH 8.6).
Characterization of purified L-asparaginase from P. carotovorum MTCC 1428 73
- Effect of temperature on activity of purified enzyme
- Effect of various effectors on L-asparaginase activity
- Substrate specificity
- Kinetic parameters
- Electrophoresis
- N-terminal sequencing of the L-asparaginase
- Molecular mass determination
- Estimation of pI
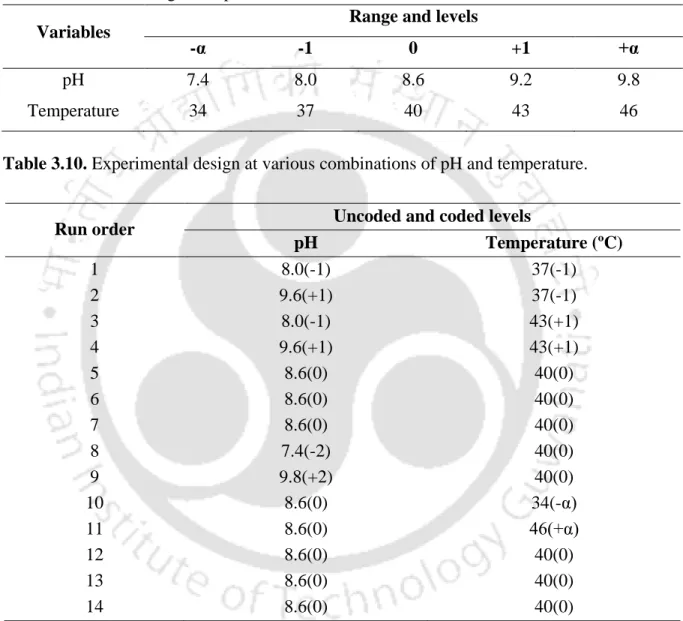
- Experimental design to evaluate the combined effect of pH and
- Estimation of deactivation rate constant (k d ) and half-life time
- Estimation of thermodynamic parameters
- Cytotoxicity assay
The production of L-asparaginase was carried out in the optimized semi-synthetic medium as mentioned in section 3.11.1. When the pH of the medium reached above 8.5, maximum production of L-asparaginase was observed.
Cultivation conditions for Batch and fed batch production of
Cultivation conditions for models of dual substrate growth kinetics,
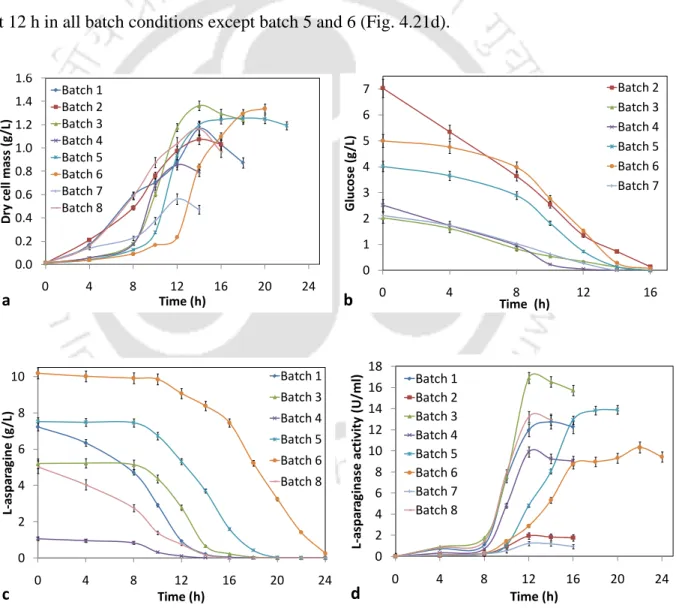
Growth assessment, substrate utilization and L-asparaginase production were studied in a batch bioreactor with a working volume of 1.5 l (Biostat B plus, Sartorius, Germany) using a semi-synthetic basal medium optimized in 8 different combinations of concentration of the flux substrate(s) of glucose and/or L-asparagine as shown in Table 3.14. Different concentration of glucose and/or L-asparagine in the optimized semisynthetic basal medium used in the batch bioreactor for unstructured modeling of L-asparaginase fermentation by P .
Kinetic model development in batch bioreactor
- Microbial growth
- L-asparaginase production
- Substrate utilization
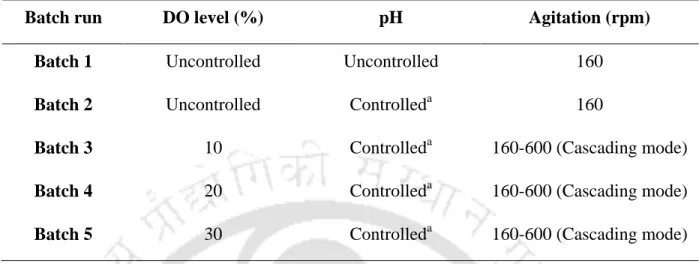
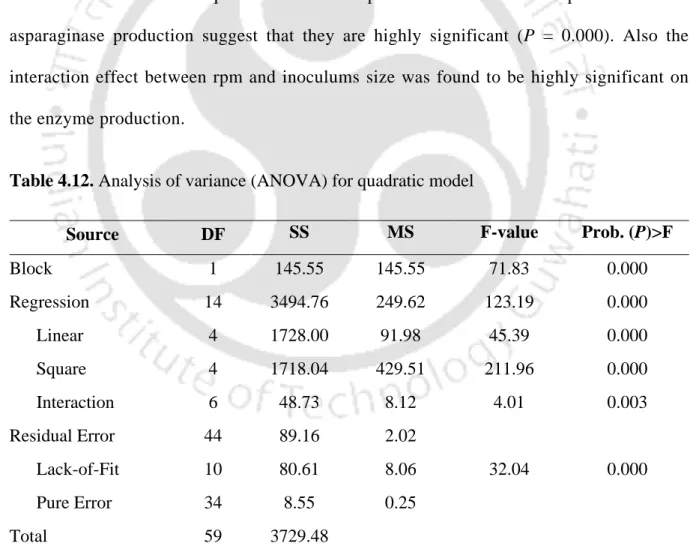
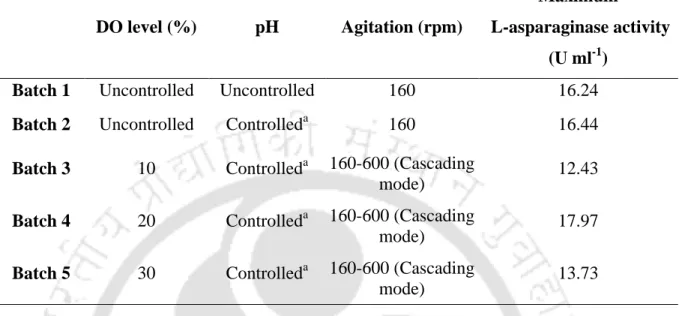
These results suggested that all variables (L-asparagine, yeast extract and peptone) significantly affect the production of L-asparaginase. To investigate the effect of pH controlled/uncontrolled and DO level on the production of L-asparaginase by P.
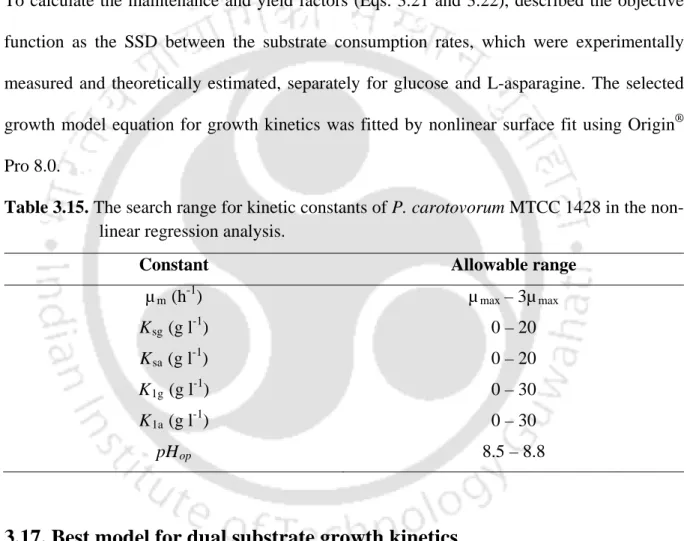
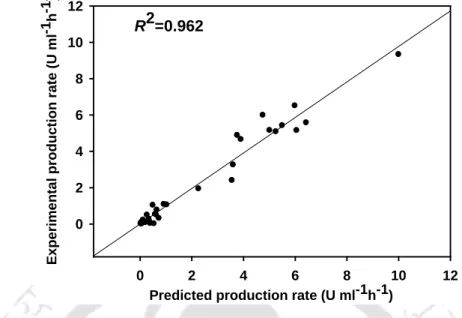
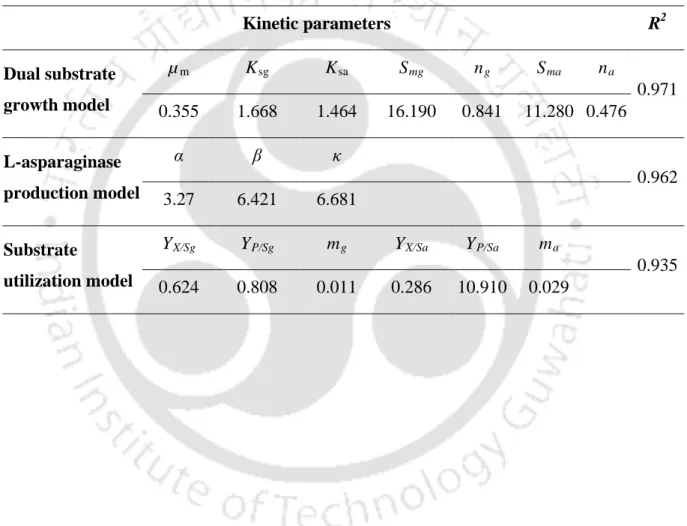
Estimation of kinetic parameters from different models by non-linear
Best model for dual substrate growth kinetic
Isolation and screening of microorganism
Subcellular localization of L-asparaginase
The existence of L-asparaginase has been reported in the membrane fraction of Tetrahymena pyriformis and the periplasmic space of Enterobacter aerogenes and Pseudomonas aeruginosa (Triantafillou et al., 1988; Geckil et al., 2005). Most L-asparaginases from various microorganisms have partial glutaminase activity, which causes various side effects during therapy (Muller and Boos, 1998; Distasio et al., 1982; Gallagher et al., 1989; Willis and Woolfolk, 1974).
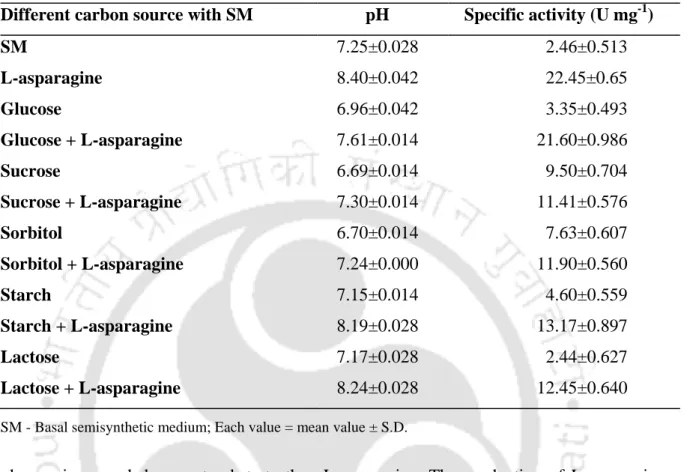
Effect of various carbon sources with or without L-asparagine
The presence of glutaminase activity was observed in all other microorganisms (relative activity from 1.67 to 8.9% of L-asparaginase) and the results are shown in table 4.1. It has been reported that the production of L-asparaginase in Enterobacter cloacae is decreased due to the decrease in pH of the medium.
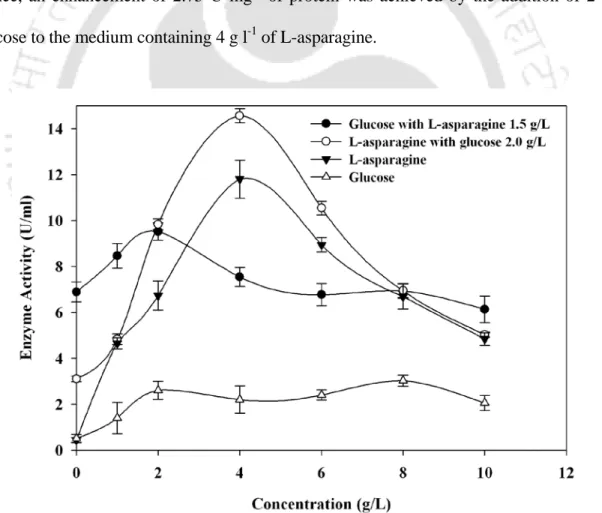
Effect of initial concentrations of glucose and/or L-asparagine
During fermentation, L-asparagine (final concentration of 1.5 g l-1) was added to each culture flask containing 1.5 g l-1 glucose at different time intervals (h) of the culture). Therefore, an increase of 2.75 U mg-1 protein was achieved by the addition of 2 g l-1 glucose to the medium containing 4 g l-1 L-asparagine.
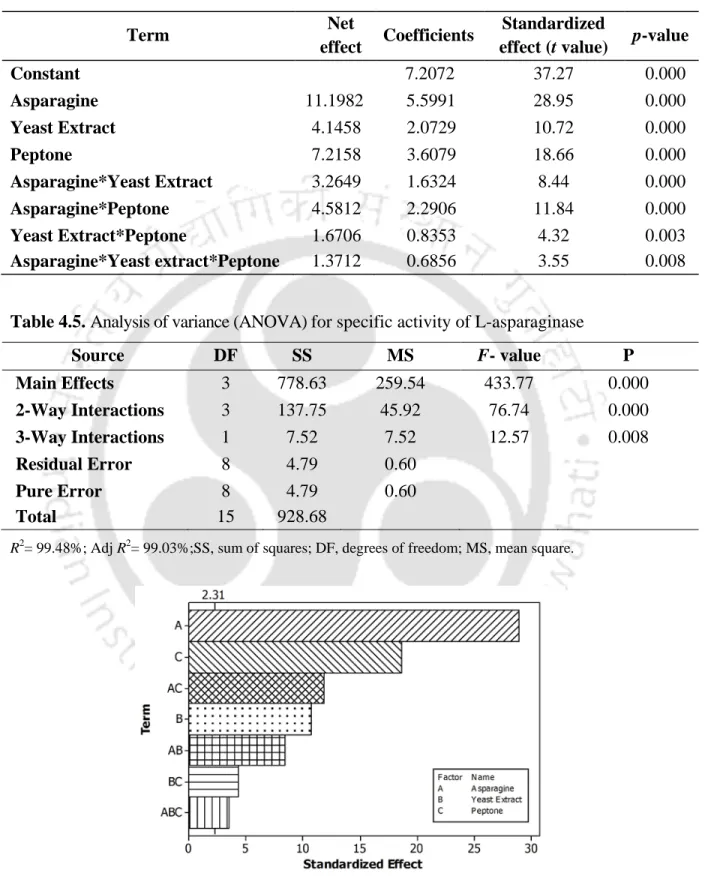
Role of nitrogen source on the production of L-asparaginase
The size and direction of effects of the factors as well as their regression coefficients and statistical significance of the experimental data for the production of L-asparaginase are shown in Table 4.4. From ANOVA analysis, the confidence level was greater than 95% (P < 0.05) for L-asparaginase production and P-value of the model was zero (Table 4.4).
Screening of significantly influencing medium components
However, the screening of significantly influencing media components by PB experimental design for increased production of L-asparaginase from P. Recently, Sunitha et al., (2010) successfully screened 67 nutrients for production of L-asparaginase by PB design .

Optimization of the screened medium constituents for maximizing the
Three-dimensional response surface plots were constructed to predict L-asparaginase production for different values of the tested variables and also to analyze the interaction between the variables. Three-dimensional response surface plots for L-asparaginase production showing the interactive effects of (a) L-asparagine and glucose (b) L-asparagine and KH2PO4.
Experimental validation of model predictions of optimized chemical
The maximum production of L-asparaginase was reached after 12 hours in the fermenter, as in the shake flask, and resulted in an increase in total productivity from 1225.83 to 1282.50 U l-1 h-1.
Optimization of process parameters for maximization of L-asparaginase
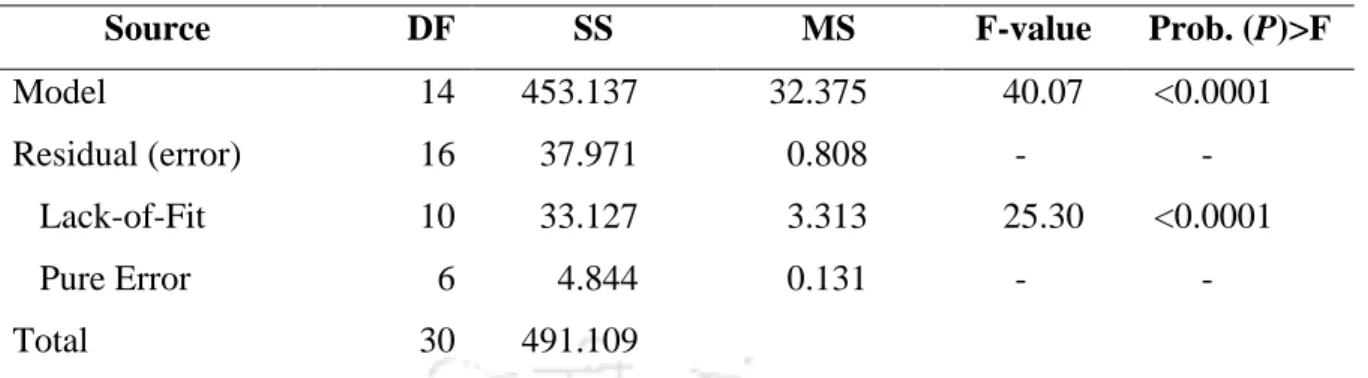
This indicates that the combined effects of all the independent variables contributed significantly to maximize the production of L-asparaginase. However, the effect of the initial pH of the medium on variation was shown not to be very significant on the production of L-asparaginase with other variables and reached the maximum at 2-3% (v/v) (Fig. 4.7a, b and d).
Verification of model of optimized process parameters
The production of L-asparaginase was slightly higher (35.71 U mg-1 protein) in the fermenter than in the shake flasks at optimal level of physical parameters.
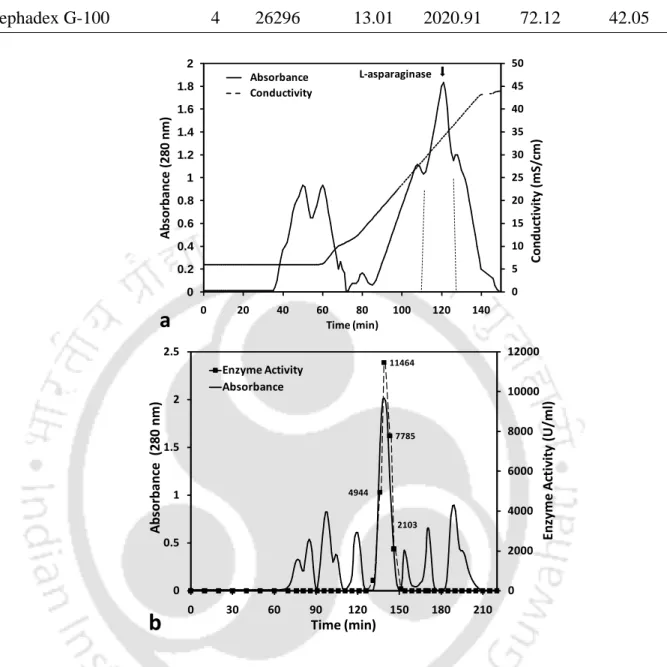
Purification of L-asparaginase
Elution profile of ion exchange and gel exclusion chromatography used for purification of L-asparaginase from P. The retention of L-asparaginase on the DEAE cellulose column depends on the pH of the buffer used.
Characterization of purified L-asparaginase
- Effect of pH and temperature on activity and pH stability
- Optimization of combined effect of pH and temperature on the
- Enzyme deactivation studies
- Estimation of thermodynamic parameters
- Effect of various effectors and specificity
- Kinetic parameters of purified enzyme
- Molecular mass determination
- N-terminal sequence
- In vitro cytotoxicity of L-asparaginase
The results obtained in this study also indicate that the optimum pH and temperature are close to the growth conditions. In addition, the purity of the enzyme preparation was assessed by analyzing the N-terminal amino acid sequence.

Production of L-asparaginase by P. carotovorum MTCC 1428 in batch
Maximum production (enzyme activity), substrate utilization and cell growth were observed at 20% DO level in the medium. Therefore, in this study, the effect of DO level and controlled pH (8.5) of the medium after 12 h on the production of L-asparaginase by P.
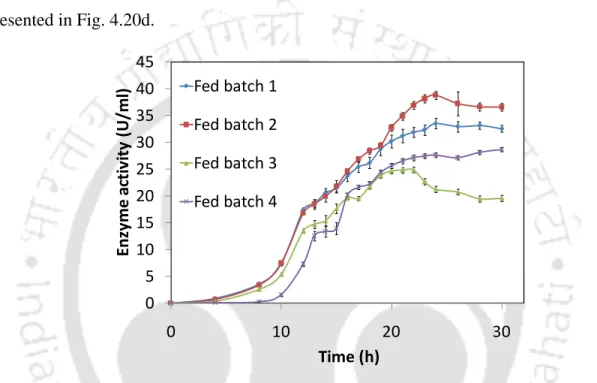
Production of L-asparaginase by P. carotovorum MTCC 1428 in
The cell growth time profiles and L-asparagine utilization profiles after L-asparagine supplementation in fed batch 1 are shown in Fig. production of asparaginase by P .
Effect of initial substrates concentration on L-asparaginase production
The specific growth rate (μ) for different combinations of the initial concentration of glucose and/or L-asparagine (Sg and Sa) was calculated from the plot of ln(X) versus. However, a slight decrease in specific growth rate was observed at 7 g l-1 initial L-asparagine concentration.
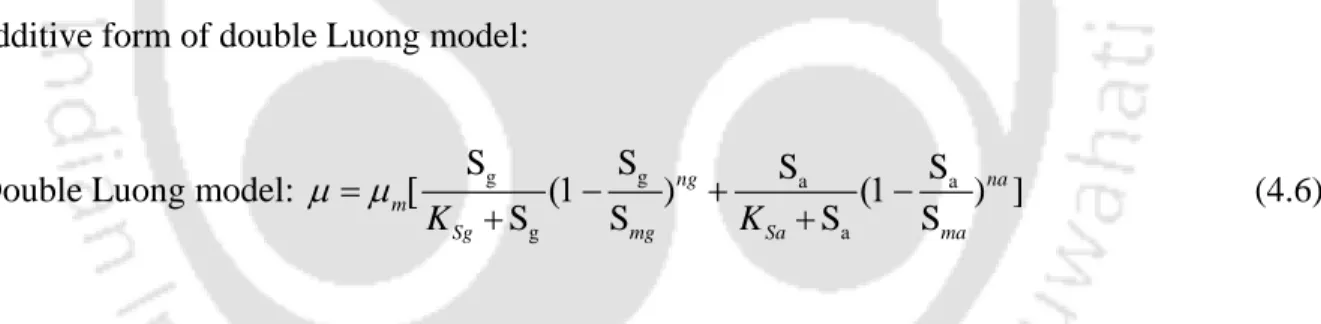
Modeling of microbial growth kinetics
The specific growth rate increased with increasing initial concentrations of glucose and L-asparagine up to 2 g l-1 and 5 g l-1. carotovorum MTCC 1428 and these observations are given in Table 4.26. Specific growth rate from batch bioreactor experiments placed on a simulated surface from the dual substrate growth kinetics model (Eq. 4.6) (R2.
Modeling of L-asparaginase production using the modified form of
In general, L-asparaginase production was higher in the late exponential phase (24–48 h) and enzyme activity was also a function of cell age (Mukherjee et al., 2000). Although L-asparaginase production has been reported by several researchers to be growth associated (Albanese and Kafkewitz, 1978; Khamna et al., 2009; Shah et al., 2010), in some cases the lack of proportionality between L asparaginase production rates and bacterial growth rates have been observed (Liu and Zajic, 1972ab; Wei and Liu, 1998; Geckil and Gencer, 2004; Mukherjee et al., 2000).
Modeling of L-asparagine and glucose utilization
Effect of initial glucose and/or L-asparagine concentration on
The production of L-asparaginase (enzyme activity) was increased 21.33 times under optimal level of chemical and physical parameters. Batch studies showed that the feed stream containing L-asparagine is the best strategy for increased L-asparaginase production.
SUMMARY AND CONCLUSIONS
BIBLIOGRAPHY
APPENDIX
Sample calculation for the estimation of L-asparaginase activity
Sample calculation for the estimation of glucose
Sample calculation for the estimation of protein
Sample calculation for the estimation of DCW
Sample calculation for the estimation of L-asparagine
LIST OF PUBLICATIONS
Schematic illustration of the reaction mechanism of L-asparaginases
General classification of asparaginases
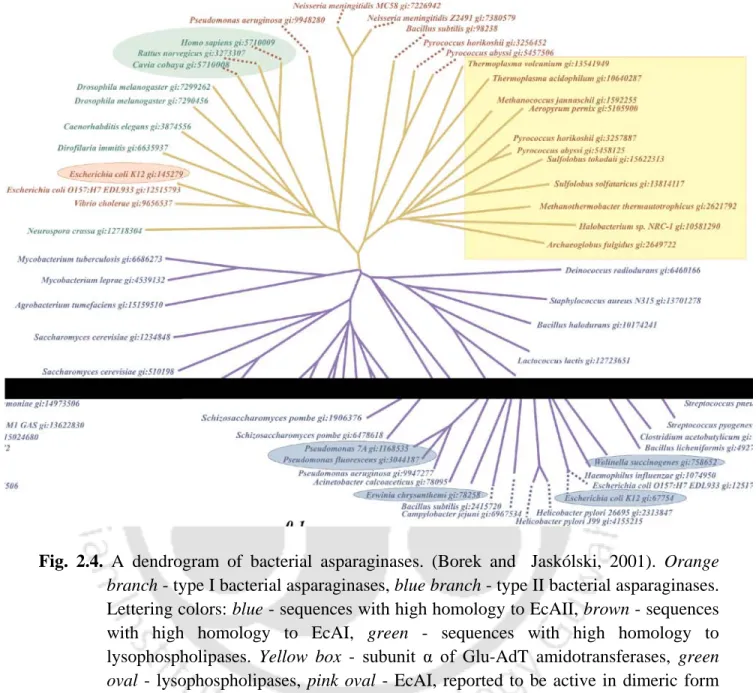
A dendrogram of bacterial asparaginases
A dendrogram of plant asparaginases
Flow chart of the isolation and purification steps involved in
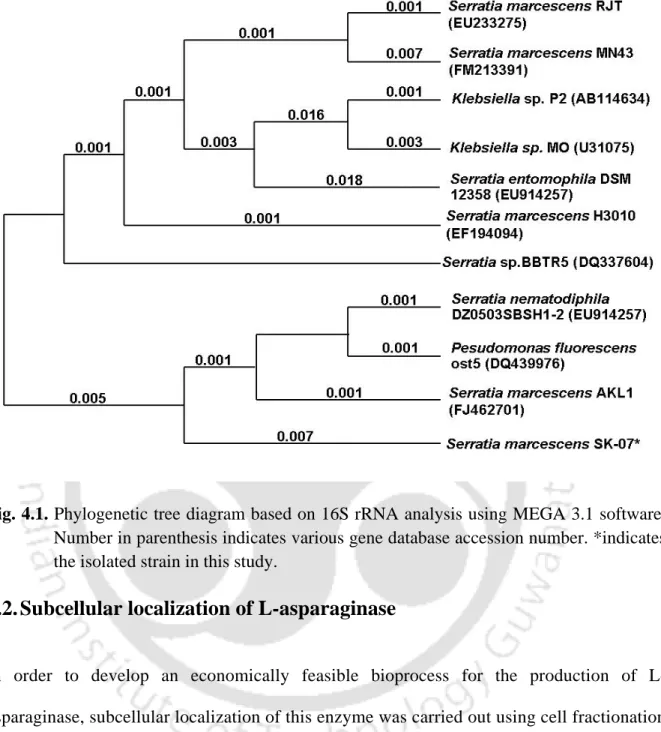
Phylogenetic tree diagram based on 16S rRNA analysis using
Effect of initial concentration of glucose and L-asparagine on the
Pareto chart of the standardized effects of nitrogen sources on the
Pareto chart of the standardized effects of the factors on the