STATISTICAL ABSTRACT OF
HIMACHAL PRADESH 2017-18
DEPARTMENT OF ECONOMIC AND STATISTICS GOVERNMENT OF HIMACHAL PRADESH
SHIMLA
C O N T E N T S
TABLE TOPIC
PREFACE PAGE
I- AREA AND POPULATION
1.01 Demographic Features Since 1901. 1
1.02 Area, Density and Decennial Growth of Population in Different
Districts. 1
1.03 Sex-wise Rural/Urban Population-2011 Census. 2
1.04 District-wise Sex Ratio in Himachal Pradesh 3
1.05 District-wise Decennial Population of Himachal Pradesh.
(1991, 2001 And 2011 Census) 3
1.06 District-wise Percentage of Rural/Urban Population. 4
1.07 District-wise decadal Growth Rate. 4
1.08 District-wise Area and Density of Population. 5
1.09 Rural-Urban Population as Percentage to Total Population of the
Districts. 6
1.10 District / Sex wise 0-6 Years Population and their percentage-
Census-2011 6
1.11 Age-wise Rural and Urban Population-2011 Census. 7
1.12 Age-wise Distribution of H.P. Population 1991 Census. 9 1.13 Age-wise Distribution of H.P. Population 2001 Census. 10 1.14 Age-wise Distribution of H.P.Population-2011 Census. 10 1.15 District-wise Number/Average Size of Households in Himachal
Pradesh-2001 and 2011 Census. 11
1.16 District And Tehsil/Sub-Tehsil-Wise Rural And Urban Population-
2011. 12
1.17 Scheduled castes Population-2011 Census. 15
1.18 Scheduled Tribes population-2011 Census. 15
1.19 Total Villages in Himachal Pradesh-1991, 2001 and 2011 Census. 16 1.20 Villages Classified by Population Size-2011 Census. 16
1.21 Population of Cities and Town-2011 Census. 17
1.22 Town Classified by Population Size-2011 Census. 19
1.23 Distribution of the disabled population by Sex and residence-2011 19 1.24 Proportion of Disabled Population, Literacy among Disabled, Work
participation rate of Disabled population and Disabled workers by
Economic Activities-2011 Census. 20
1.25 District-wise Projected Population (as on 1
stMarch). 20
1.26 Block-wise Population-2011-Census. 21
1.27 Distribution of Total Workers by Sex (2011 Census). 24
1.28 Distribution of Workers -2011 Census 24
1.29 Percentage of Total Workers. Main Workers, Marginal workers and Non-workers to Total Population by Residence And Sex-2011
Census. 25
1.30 Religion-wise Population 2001 and 2011 Census. 26
II-CLIMATE
2.01 Average Annual Rainfall. 27
2.02 Maximum Temperature at Selected Centres-2017 28
TABLE PAGE III-AGRICULTURE
3.01 Number of Operational Holdings and Area Operated by Size Class of
Holding in H.P. 29
3.02 Land Utilization. 30
3.03 Area Under Different Crops. 31
3.04 Production of Different Crops. 31
3.05 Average Yield of Important Crops. 32
3.06 Fertilizer Consumption. 33
3.07 Net Irrigated Area by Source. 33
3.08 District-wise Net Irrigated Area-2011-12 34
3.09 Area and Production of Vegetables. 34
3.10 Area under High Yielding Variety Crops. 35
IV-HORTICULTURE
4.01 District-wise Area under Fruits-2017-18. 36
4.02 Production of Fruits-2017-18. 37
V- CO-OPERATION
5.01 Primary Agriculture Credit Co-operative Societies. 39
5.02 Non-Agriculture Credit/Co-operative Societies. 39
5.03 Regional Co-operative Marketing Societies. 40
5.04 Wholesale Primary and Students Consumer Co-operative Stores. 40
5.05 Co-operative Banks. 41
VI- FOREST
6.01 Classification of Forest Area by Legal Status. 42
6.02 Forest Area-2016-17. 42
6.03 Out-turn and Value of Major Forest Produce 43
6.04 Out-turn and Value of Minor Forest Produce. 43
6.05 Forest Revenue 44
VII-FISHERIES
7.01 Fish Production. 45
7.02 Export and Import of Fish. 45
VIII-LIVESTOCK AND ANIMAL HUSBANDRY
8.01 Number of Livestock and Poultry. 46
8.02 District-wise Number of Veterinary Hospitals and Dispensaries. 47
8.03 Veterinary Institutions and Personnel. 48
8.04 Average Daily Milk Yield per Animal/Total Milk Production. 48
8.05 District-Wise Milk Procurement of H.P Milkfed 49
8.06 Prevent Measure undertaken and Animals Treated in Different
Veterina Veterinary Institutions. 49
IX-INDUSTRY AND MINNING
9.01 Set up of Small Scale Industrial Units. 50
9.02 District-wise Number of Registered Factories and Workers. 50
9.03 Production and Value of Major/Minor Minerals. 51
X-TOURISM
10.01 Number of Registered Hotels/Guest Houses. 52
10.02 Number of Tourists Visited in H.P. 52
TABLE PAGE XI- POWER
11.01 Generation, Sale and Purchase of Electricity. 54
11.02 Consumption of Electricity. 54
11.03 Number of Villages Electrified. 55
XII TRANSPORT AND COMMUNICATIONS
12.01 Roads. 56
12.02 District-Wise Road length. 57
12.03 National Transport 57
12.04 Number of Motor Vehicles Registered during the year. 58
12.05 Post office 58
XIII-EDUCATION
13.01 District-wise Number of Schools and Colleges. 59
13.02 Number of Teachers in various Schools. 59
13.03 Total Enrolment in School and Colleges Himachal Pradesh. 60
13.04 Enrolment in District-wise. 60
13.05 Number of Educational Institutions in Himachal Pradesh. 61
13.06 District wise Literates-2011 Census 61
13.07 Growth of Literacy in Himachal Pradesh since1951 to 2011. 62 13.08 Rural-Urban Literacy Percentage in Himachal Pradesh 2001 Census. 63 13.09 Rural-Urban Literacy Percentage in Himachal Pradesh Census 2011. 63 13.10 District-wise Literacy Percentage in Himachal Pradesh1991 to 2011 64 13.11 Sex-wise Literacy Rate Among Scheduled Caste and Scheduled Tribes
Population -2011 Census 65
13.12 Number of Schools serving Per thousand Populations /per Thousand
Sq. kms. In Himachal Pradesh. 65
13.13 Teacher Pupil Ratio in Himachal Pradesh. 66
13.14 Gross Enrolment Ratio in Various Educational Institutions by Age and
Sex in Himachal Pradesh. 66
13.15 Equipment/Facilities available in Primary School. 67 13.16 Equipment/Facilities available in Middle School. 67
13.17 Equipment/Facilities available in High School. 68
13.18 Equipment/Facilities available in Higher Secondary School. 68
13.19 District wise Students Classroom ratio. 69
13.20 District wise Average School Size Enrolment 69
13.21 District wise Drop Out Rate. 70
XIV- HEALTH
14.01 Number of Medical Institutions. 71
14.02 Health Care Facilities in Himachal Pradesh. 71
14.03 Number of Medical Institutions per lakh Population. 72
14.04 Number of Medical Institutions per ’000 Sq. Kms. 72
14.05 Number of Patients Treated in Various Allopathic Medical Institutions 73
14.06 Number of Ayurvedic Institution. 73
14.07 Number of Patients Treated in Various Ayurvedic Medical Institutions 74
14.08 Achievement under Family Welfare Programme 74
TABLE PAGE
XV- VITAL STATISTICS
15.01 Number of Births Registered. 75
15.02 Number of Deaths Registered. 75
15.03 Number of Infant Deaths Registered. 76
15.04 Birth and Death Rate. 76
15.05 Comparative Vital Statistics. 77
15.06 Comparative Infant Mortality Rate . 77
15.07 Births, Deaths and Infants Mortality Rate in H.P. 78 15.08 Age specific Fertility Rates and Marital Fertility Rates in Himachal
Pradesh and All India. 78
15.09 Life Expectancy. 79
15.10 Age Specific Death Rate by Sex in Himachal Pradesh-2016. 79 15.11 Percentage Distribution of Estimated Population by Age-group, Sex
And Residence in Himachal Pradcesh-2016. 80
15.12 Percentage Distribution of Total Population by Sex, Marital Status
and Age-group in Himachal Pradesh-2016.(TOTAL) 80
15.13 Percentage Distribution of Total Population by Sex, Marital Status and
Age-group in Himachal Pradesh-2016. (RURAL) 81
15.14 Percentage Distribution of Total Population by Sex, Marital Status
and Age-group in Himachal Pradesh-2016. (URBAN) 81 15.15 National Leprosy Eradication Programme in Himachal Pradesh. 82
15.16 Immunization in Himachal Pradesh. 82
15.17 District-wise Percentage of Couple Protection Rate in Himachal
Pradesh. (as on 31
stMarch) 83
15.18 Number of Disabled Persons in Himachal Pradesh by type of
disability- 2011 Census. 83
XVI-PRICES
16.01 Average Retail Price of Some Essential Commodities. 84 16.02 Consumer Price Index for Industrial Workers in - Himachal Pradesh. 84 16.03 Consumer Price Index for Agriculture labourers - Himachal Pradesh. 85 16.04 Consumer Price Index for Industrial Workers - All India. 85
16.05 Wholesale Price Index Numbers - All India. 86
XVII- LABOUR AND EMPLOYMENT
17.01 Employment Statistics. 87
17.02 Job seekers according to qualifications on live registers of
Employment exchanges in Himachal Pradesh. 87
17.03 Distribution of Himachal Pradesh Government (Regular) Employees
According to Class of Post as on 31.3.2017. 88
17.04 Distribution of Himachal Pradesh Government (Non-Regular)
Employees as on 31.3.2017. 90
17.05 District-wise Distribution of Himachal Pradesh Government
Employees as on 31.3.2017. 92
17.06 District-wise Distribution of Public Undertaking Regular and Non- 92
Regular Employees in Himachal Pradesh as on 31.3.2017.
17.07 District-wise Distribution of Local Bodies Employees in Himachal
Pradesh as on 31.3.2017. 93
TABLE PAGE XVIII-SOCIAL SECTOR
18.01 Number of Institutions for child and Women Welfare in H.P.
18.02 Grant of Pension/Rehabilitation Allowance to Various Categories of
Recipients by way of Social Security. 94
18.03 Women Welfare Schemes in Himachal Pradesh. 95
18.04 Pension Schemes in Himachal Pradesh2017-18 95
1805 House Subsidy in Himachal Pradesh-2017-18. 96
XIX- FOOD AND SUPPLIES
19.01 Number of Fair Price Shops 97
19.02 L.P.G. Consumer in H.P. 98
19.03 District – wise Petrol/ Diesel Retail Outlets in H.P. 98 19.04 District – wise / Company- wise detail of Gas Agencies. 99 XX - POLICE AND CRIME
20.01 Number of Police Stations and Police Posts. 100
20.02 Strength of Armed Police Forces. 100
20.03 Strength of Un-Armed Police Forces. 101
20.04 Crimes in Himachal Pradesh 102
XXI- STATE INCOME
21.01 Gross State Domestic Product of H.P.at Current Prices. 103 21.02 Gross State Domestic Product of H.P.at Constant Prices. 104 21.03 Net State Domestic Product of H.P at Current Prices. 105 21.04 Net State Domestic Product of H.P at Constant Prices. 106 XXII- PLAN OUTLAY AND EXPENDITURE
22.01 Outlay and Expenditure of First Plan to Fourth Five Year Plan. 107 22.02 Outlay and Expenditure of fifth Five Year Plan 1974-79 and Annual
Plan 1978-79 &1979-80. 108
22.03 Outlay and Expenditure of Sixth Five Year Plan 1980-85. 108 22.04 Outlay and Expenditure of Seventh Five Year Plan 1985-90 and
Annual Plan 1990-91 & 1991-92. 109
22.05 Outlay and Expenditure of Eighth and Ninth Five Year Plan 1992-97
and 1997-02. 110
22.06 Outlay and Expenditure of Tenth Five Year Plan 2002-07. 110 22.07 Sector-wise Outlay of Eleventh Plan 2007-2012. 111 22.08 Sector-wise Approved Outlay of Annual Plan ( 2007-08) 111 22.09 Sector-wise Approved Outlay of Annual Plan 2008-09. 112 22.10 Sector-wise Approved Outlay of Annual Plan 2009-10. 112 22.11 Sector-wise Approved Outlay of Annual Plan 2010-11. 113 22.12 Sector-wise Approved Outlay of Annual Plan 2011-12. 113 22.13 Sector-wise Approved Outlay of Annual Plan 2012-13&2013-14. 114 22.14 Sector-Wise Outlay of Annual Plan 2014-15&2015-16 114
22.15 Sector-Wise Outlay of Annual Plan 2016-17 115
22.16 Sector-Wise Outlay of Annual Plan 2017-18
23.01 Budget in Brief. 116
23.02 Revenue Receipts. 117
23.03 Capital Receipts. 118
23.04 Revenue Expenditure. 119
TABLE PAGE
23.05 Capital Expenditure (Gross and Net). 120
23.06 Public Debt. 120
23.07 Small Savings Collections. 121
23.08 Number of Registered Dealers in Pre VAT and Post VAT Regime in
Himachal Pradesh. 121
23.09 Number of CST Total Registered Dealers in Himachal Pradesh 122 XXIV - BANKING AND INSURANCE
24.01 District-wise Deposits and Advances, Credit Deposit Ratio &
Population Per Bank as on March, 2018. 123
24.02 Rural, Urban Area-wise Distribution of Number of Banks, Aggregate Deposits and Gross Bank Credit of Scheduled Commercial Banks
(As on March. Every Year). 124
24.03 Progress of Life Insurance. 124
24.04 Sector-wise Investment by Life Insurance Corporation. 125 XXV- ELECTION
25.01 General Information on State Assembly Election. 126
25.02 Candidates Contested and Votes Polled. 126
25.03 Party-wise Candidates Elected. 127
25.04 General Information on Loksabha Election,2014 128
25.05 Candidates Elected to Loksabha 2014. 128
25.06 Party-wise Votes Polled in Loksabha Election, 2014 128 XXVI- NATURAL CALAMITIES
26.01 Incidence of Fire. 129
XXVII- CONSUMER EXPENDITURE
27.01 Average Monthly Per Capita Consumer Expenditure 130 XXVIII- ECONOMIC CENSUS-2012-13
28.01 District wise Total Number of Establishments by Rural and Urban
Location. 131
XXIX - MISCELLANOUS ALL INDIA FIGURES
29.01 Deposits and Credit Ratio of Scheduled Commercial Banks, March
2017. 132
29.02 Bank Offices 2017 and 2018. 133
29.03 Per Capita Income(State-wise) in India ( At Current Prices Based
2011-12) 134
29.04 Per Capita Income(State-wise) in India ( At Constant Prices Base
2011-12) 135
29.05 Vital Statistics-2016 Based on Sample Registration System by Rural
and Urban Areas. 136
29.06 Infant Mortality Rates By Rural and Urban Areas During 2016. 137 29.07 Expectation of life at birth by sex and residence, India and
States/UTs,2011-15 138
29.08 Expectation of life at birth by sex and residence, India and 139
States/UTs,2012-16 29.09 Number of Districts, Sub-Divisions, Towns and Villages. 141
29.10 Density of Population - India & States. 142
29.11 State-wise Geographical Area, Population Distribution and Literacy
Rate-Census-2011. 143
TABLE PAGE
29.12 State-wise Population By Religion (Census-2011) 144 29.13 Ranks of States And Union Territories By Population and Area.
(Census-2011) 146
29.14 Decennial Growth of Population by Census-1901-11 to 2001-11. 147 29.15 Workforce Participation Rate according to Sex and by Sector for
States, Union Territories and India during 2011. 148 29.16 Workforce Participation Rate according to Sex and by Sector for
States, Union Territories and India during 2011 149
I– AREA AND POPULATION
1.01- Demographic Features Since 1901
Source: (i) General population tables II.A-Census of India, 1971.
(ii) Census of India, 1981 Series-7-H.P. Part-II.
(iii) Census of India, 1991 Series-9, HP, Paper-I (iv) Census of India –2001& 2011
I– AREA AND POPULATION
1.02 - Area, Density and Decennial Growth of Population in Different Districts
District Area in Sq.
Kms. Total population Decennial
growth (2001-2011)
Density per Sq. Km.
(2011 Census) 2001 Census 2011
Census
1. 2. 3. 4. 5. 6.
1. Bilaspur 1,167 3,40,885 3,81,956 12.05 327
2. Chamba 6,522 4,60,887 5,19,080 12.63 80
3. Hamirpur 1,118 4,12,700 4,54,768 10.19 407
4. Kangra 5,739 13,39,030 15,10,075 12.77 263
5. Kinnaur 6,401 78,334 84,121 7.39 13
6. Kullu 5,503 3,81,571 4,37,903 14.76 80
7. Lahaul-Spiti 13,841 33,224 31,564 -5.00 2
8. Mandi 3,950 9,01,344 9,99,777 10.92 253
9. Shimla 5,131 7,22,502 8,14,010 12.67 159
10.Sirmaur 2,825 4,58,593 5,29,855 15.54 188
11.Solan 1,936 5,00,557 5,80,320 15.93 300
12.Una 1,540 4,48,273 5,21,173 16.26 338
H.P. 55,673 60,77,900 68,64,602 12.94 123
Source: 1. Census of India, 2001, Series-9, H.P.
2. Census of India, 2011
Year Population Decennial
growth rate Females per
’000 males Density per Sq. Km.
(Persons)
Scheduled Castes (Percentage)
Scheduled Tribes (Percentage)
1. 2. 3. 4. 5. 6. 7.
1901 1920294 .. 884 34 .. ..
1911 1896944 -1.22 889 34 .. ..
1921 1928206 1.65 890 35 .. ..
1931 2029113 5.23 897 36 .. ..
1941 2263245 11.54 890 41 .. ..
1951 2385981 5.42 912 43 22.69 0.26
1961 2812463 17.87 938 51 22.88 4.35
1971 3460434 23.04 958 62 22.24 4.09
1981 4280818 23.71 973 77 24.62 4.61
1991 5170877 20.79 976 93 25.34 4.22
2001 6077900 17.54 968 109 24.72 4.02
2011 6864602 12.94 972 123 25.19 5.71
I – AREA AND POPULATION
1.03– Sex wise Rural- Urban Population -2011 Census
District Population Females
’000 per males
Rural Urban Total
Male Female Total Male Female Total Male Female Total
1. 2. 3. 4. 5. 6. 7. 8. 9. 10. 11.
1. Bilaspur 179653 177174 356827 13111 12018 25129 192764 189192 381956 981 2. Chamba 241963 241009 482972 19357 16751 36108 261320 257760 519080 986 3. Hamirpur 200748 222590 423338 16322 15108 31430 217070 237698 454768 1095 4. Kangra 705365 718429 1423794 45226 41055 86281 750591 759484 1510075 1012
5. Kinnaur 46249 37872 84121 0 0 0 46249 37872 84121 819
6. Kullu 203269 193243 396512 22183 19208 41391 225452 212451 437903 942
7. L&S 16588 14976 31564 0 0 0 16588 14976 31564 903
8. Mandi 466050 471090 937140 32015 30622 62637 498065 501712 999777 1007 9. Shimla 314295 298364 612659 110744 90607 201351 425039 388971 814010 915 10.Sirmaur 246175 226515 472690 30114 27051 57165 276289 253566 529855 918 11.Solan 249736 228437 478173 59018 43129 102147 308754 271566 580320 880 12.Una 240254 236006 476260 23438 21475 44913 263692 257481 521173 976 H.P. 3110345 3065705 6176050 371528 317024 688552 3481873 3382729 6864602 972 Source: Census of India-2011– H.P.
I – AREA AND POPULATION
Table-1.04- District-wise Sex Ratio in Himachal Pradesh.
District
Females Per thousand Males
1901 1911 1921 1931 1941 1951 1961 1971 1981 1991 2001 2011
1. 2. 3. 4. 5. 6. 7. 8. 9. 10. 11. 12. 13.
1. Bilaspur 840 862 874 900 938 948 952 993 1002 1002 990 981
2. Chamba 903 897 893 910 874 894 876 945 936 949 959 986
3. Hamirpur .. 900 930 917 916 936 1092 1111 1149 1105 1099 1095
4. Kangra .. 900 930 917 916 936 964 1008 1016 1024 1025 1012
5. Kinnaur 911 935 922 941 910 1070 969 887 885 856 857 819
6. Kullu .. 1009 1015 1006 930 941 945 920 918 920 927 942
7. L-Spiti 992 990 993 989 920 933 776 818 767 817 802 903
8. Mandi 908 921 933 917 907 971 994 964 999 1013 1012 1007
9. Shimla 853 881 842 886 867 875 852 869 878 894 896 915
10. Sirmaur 798 822 824 803 818 800 828 835 873 897 901 918
11. Solan/
Mahasu* 725 723 645 724 736 800 879 923 929 909 852 880
12. Una .. 900 930 917 916 936 978 1003 1028 1006 997 976
H.P. 884 889 890 897 890 912 938 958 973 976 968 972 Source: Different issues of census Publications.
*Prior to reorganization of districts in 1973 there was Mahasu district.
I – AREA AND POPULATION
1.05- District-wise Decennial Population of Himachal Pradesh.
(1991, 2001 And 2011 Census)
District Total Rural Urban
1991 2001 2011 1991 2001 2011 1991 2001 2011
1. 2. 3. 4. 5. 6. 7. 8. 9. 10.
1. Bilaspur 295387 340885 381956 278652 318934 356827 16735 21951 25129 2. Chamba 393286 460887 519080 363397 426345 482972 29889 34542 36108 3. Hamirpur 369128 412700 454768 346442 382494 423338 22686 30206 31430 4. Kangra 1174072 1339030 1510075 1114723 1266745 1423794 59349 72285 86281
5. Kinnaur 71270 78334 84121 71270 78334 84121 - - 0
6. Kullu 302432 381571 437903 281421 351478 396512 21011 30093 41391
7. L-Spiti 31294 33224 31564 31294 33224 31564 - - 0
8. Mandi 776372 901344 999777 720603 840362 937140 55769 60982 62637 9. Shimla 617404 722502 814010 491272 555269 612659 126132 167233 201351 10. Sirmaur 379695 458593 529855 341621 410923 472690 38074 47670 57165 11. Solan 382268 500557 580320 334989 409362 478173 47279 91195 102147 12. Una 378269 448273 521173 345997 408849 476260 32272 39424 44913 H.P. 5170877 6077900 6864602 4721681 5482319 6176050 449196 595581 688552
Source: (i) Census of India, 1991 H.P., Primary Census Abstract.
(ii) Census of India-2001, & 2011.
I – AREA AND POPULATION
1.06- District-wise Percentage of Rural/Urban Population.
District Total Rural Urban
1991 2001 2011 1991 2001 2011 1991 2001 2011
1. 2. 3. 4. 5. 6. 7. 8. 9. 10.
1. Bilaspur 5.71 5.61 5.56 5.90 5.82 5.78 3.73 3.69 3.65
2. Chamba 7.61 7.58 7.56 7.70 7.78 7.82 6.65 5.80 5.25
3. Hamirpur 7.14 6.79 6.62 7.34 6.98 6.86 5.05 5.07 4.56
4. Kangra 22.70 22.03 22.00 23.61 23.10 23.05 13.21 12.14 12.53
5. Kinnaur 1.38 1.29 1.23 1.51 1.43 1.36 - - -
6. Kullu 5.85 6.28 6.38 5.96 6.41 6.42 4.68 5.05 6.01
7. L-Spiti 0.61 0.55 0.46 0.66 0.60 0.51 - - -
8. Mandi 15.01 14.83 14.57 15.26 15.33 15.18 12.41 10.24 9.10
9. Shimla 11.94 11.89 11.86 10.40 10.13 9.92 28.08 28.08 29.24
10. Sirmaur 7.34 7.54 7.72 7.24 7.49 7.65 8.48 8.00 8.30
11. Solan 7.39 8.24 8.45 7.09 7.47 7.74 10.53 15.31 14.84
12. Una 7.32 7.37 7.59 7.33 7.46 7.71 7.18 6.62 6.52
H.P. 100.00 100.00 100.00 100.00 100.00 100.00 100.00 100.00 100.00 Source: Census of India, 1991 to 2011.
I – AREA AND POPULATION
1.07- District-wise Decadal Growth Rate.
(Percentage)
District 1981-1991 1991-2001 2001-2011
Rural Urban Total Rural Urban Total Rural Urban Total
1. 2. 3. 4. 5. 6. 7. 8. 9. 10.
1. Bilaspur 18.18 44.47 19.41 14.46 31.17 15.40 11.88 14.48 12.05
2. Chamba 25.37 40.36 26.39 17.32 15.57 17.19 13.28 4.53 12.63
3. Hamirpur 14.74 43.26 16.17 10.41 33.15 11.80 10.68 4.05 10.19
4. Kangra 18.36 21.27 18.50 13.64 21.80 14.05 12.40 19.36 12.77
5. Kinnaur 19.69 - 19.69 9.91 - 9.91 7.39 - 7.39
6. Kullu 26.87 24.15 26.68 24.89 43.22 26.17 12.81 37.54 14.76
7. Lahaul-Spiti (-)2.51 - (-)2.51 6.17 - 6.17 -5.0 - -5.0
8. Mandi 20.59 18.01 20.40 16.62 9.35 16.10 11.52 2.71 10.92
9. Shimla 14.05 57.32 20.84 13.03 32.59 17.02 10.34 20.40 12.67
10. Sirmaur 21.95 41.89 23.69 20.29 25.20 20.78 15.03 19.92 15.54
11. Solan 23.77 44.93 26.04 22.20 92.89 30.94 16.81 12.01 15.93
12. Una 18.12 31.69 19.17 18.17 22.16 18.51 16.49 13.92 16.26
H.P. 19.39 37.80 20.79 16.11 32.59 17.54 12.65 15.61 12.94 Source: Census of India, 1981 to 2011.
I – AREA AND POPULATION
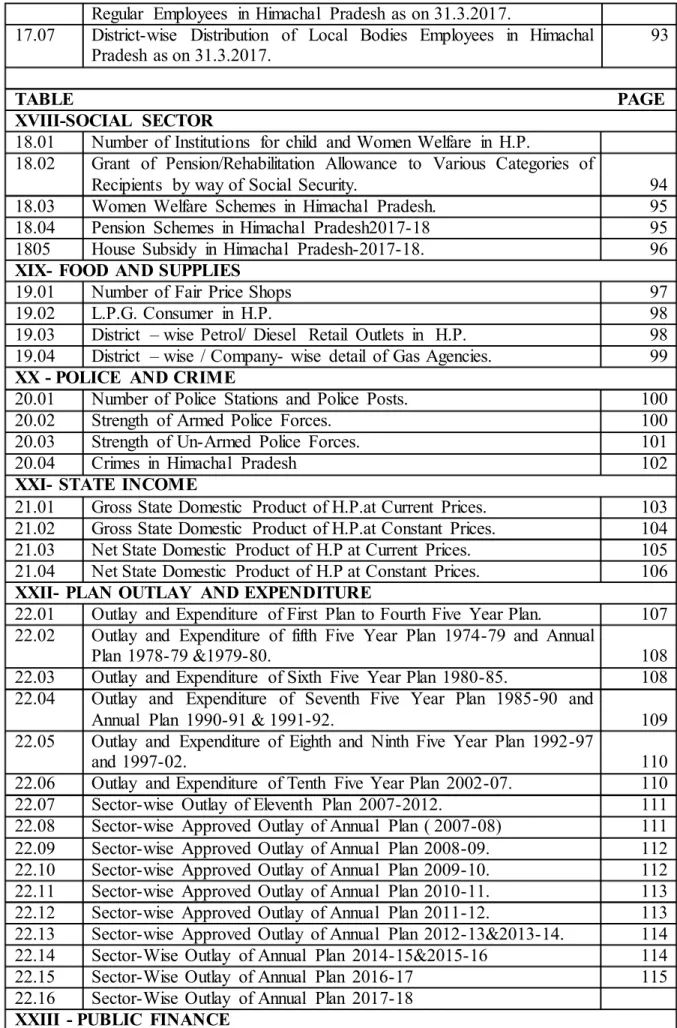
1.08- District-wise Area and Density of Population.
District
Area (Sq. Km.)
Density per Sq. Km. as per Population Census
1971 1981 1991 2001 2011
1. Bilaspur 1167 (2.10) 167 212 253 292 327
2. Chamba 6522 (11.71) 36 48 60 71 80
3. Hamirpur 1118 (2.01) 166 284 330 369 407
4. Kangra 5739 (10.31) 151 173 205 233 263
5. Kinnaur 6401 (11.50) 8 9 11 12 13
6. Kullu 5503 (9.88) 35 43 55 69 80
7. Lahaul-Spiti 13841 (24.86) 2 2 2 2 2
8. Mandi 3950 (7.09) 128 163 197 228 253
9. Shimla 5131 (9.22) 84 100 120 141 159
10. Sirmaur 2825 (5.07) 87 109 134 162 188
11. Solan 1936 (3.48) 115 157 197 259 300
12. Una 1540 (2.77) 174 206 246 291 338
H.P. 55673 (100.00) 62 77 93 109 123
Note: Figures within brackets are percentage of total area.
Source: Census of India-1971 to 2011
327
80
407
263
13
80
2
253
159
188
300 338
0 50 100 150 200 250 300 350 400 450
District wise density of population 2011
I – AREA AND POPULATION
1.09- Rural-Urban Population as Percentage to Total Population of the Districts.
District
1981 1991 2001 2011
Rural Urban Rural Urban Rural Urban Rural Urban
1. 2. 3. 4. 5. 6. 7. 8. 9.
1. Bilaspur 95.32 4.68 94.33 5.67 93.56 6.44 93.42 6.58
2. Chamba 93.16 6.84 92.40 7.60 92.51 7.49 93.04 6.96
3. Hamirpur 95.02 4.98 93.85 6.15 92.68 7.32 93.09 6.91
4. Kangra 95.06 4.94 94.95 5.05 94.60 5.40 94.29 5.71
5. Kinnaur 100.00 - 100.00 - 100.00 - 100.0 -
6. Kullu 92.91 7.09 93.05 6.95 92.11 7.89 90.55 9.45
7. L-Spiti 100.00 - 100.00 - 100.00 - 100.0 -
8. Mandi 92.67 7.33 92.82 7.18 93.23 6.77 93.73 6.27
9. Shimla 84.31 15.69 79.57 20.43 76.85 23.15 75.26 24.74
10. Sirmaur 91.26 8.74 89.97 10.03 89.61 10.39 89.21 10.79
11. Solan 89.24 10.70 87.63 12.37 81.78 18.22 82.40 17.60
12. Una 92.28 7.72 91.47 8.53 91.21 8.79 91.38 8.62
H.P. 92.39 7.61 91.31 8.69 90.20 9.80 89.97 10.03
Source: (i) Census of India-1981, 1991, Series-9, and Primary Census Abstract, Part-II-A.
(ii) Census of India, Tables for Paper-2 of 2001&2011.
I - POPULATION
1.10-District / Sex wise 0-6 Years Population and their percentage-Census-2011
District Total population 0-6Years Percentage Rank
Male Female Total
1 2. 3. 4. 5. 6.
1. Bilaspur 22084 19872 41956 5.39 10
2. Chamba 36024 34335 70359 9.05 4
3. Hamirpur 25722 22826 48548 6.24 9
4. Kangra 87741 76866 164607 21.16 1
5. Kinnaur 4200 4046 8246 1.06 11
6. Kullu 25707 24724 50431 6.48 8
7. Lahaul-Spiti 1537 1588 3125 0.40 12
8. Mandi 58486 53588 112074 14.41 2
9. Shimla 42376 39188 81564 10.49 3
10.Sirmaur 36107 33513 69620 8.95 5
11.Solan 35884 32253 68137 8.76 6
12.Una 31591 27640 59231 7.61 7
Himachal Pradesh 407459 370439 777898 100.00 -
Source: Census of India, 2011.
I – AREA AND POPULATION
1.11- Age -wise Rural and Urban Population-2011 Census.
Agewise
(Years) Total Rural Urban
Total Male Female Total Male Female Total Male Female
1. 2. 3. 4. 5. 6. 7. 8. 9. 10.
All ages 6864602 3481873 3382729 6176050 3110345 3065705 688552 371528 317024
0 101835 53261 48574 94406 49373 45033 7429 3888 3541
1 113916 59961 53955 104829 55172 49657 9087 4789 4298
2 107317 55969 51348 98582 51317 47265 8735 4652 4083
3 110322 57322 53000 101117 52499 48618 9205 4823 4382
4 111594 58498 53096 101997 53382 48615 9597 5116 4481
5 117679 61890 55789 107195 56236 50959 10484 5654 4830
6 115235 60558 54677 104696 54875 49821 10539 5683 4856
7 122039 63842 58197 111185 58014 53171 10854 5828 5026
8 117124 61593 55531 106293 55716 50577 10831 5877 4954
9 119100 63574 55526 108190 57600 50590 10910 5974 4936
10 134596 71647 62949 122334 64852 57482 12262 6795 5467
11 127447 67693 59754 115507 61000 54507 11940 6693 5247
12 125830 66799 59031 114237 60324 53913 11593 6475 5118
13 124125 65336 58789 112678 59005 53673 11447 6331 5116
14 127226 66765 60461 115509 60319 55190 11717 6446 5271
15 127378 67225 60153 115114 60443 54671 12264 6782 5482
16 126410 66658 59752 114081 59746 54335 12329 6912 5417
17 124585 65721 58864 112339 59015 53324 12246 6706 5540
18 136759 72265 64494 122520 64005 58515 14239 8260 5979
19 125329 64860 60469 111937 57345 54592 13392 7515 5877
20 135902 69643 66259 121043 61334 59709 14859 8309 6550
21 126638 63969 62669 112829 56431 56398 13809 7538 6271
22 133018 66720 66298 118602 58777 59825 14416 7943 6473
23 123650 61664 61986 109984 54260 55724 13666 7404 6262
24 124658 61724 62934 110981 54365 56616 13677 7359 6318
25 128871 63006 65865 114397 55148 59249 14474 7858 6616
26 121425 59721 61704 107865 52387 55478 13560 7334 6226
27 114008 56142 57866 101455 49364 52091 12553 6778 5775
28 123493 60448 63045 110002 53391 56611 13491 7057 6434
29 101363 50808 50555 89886 44726 45160 11477 6082 5395
30 135071 65731 69340 120600 57989 62611 14471 7742 6729
31 104067 52399 51668 92304 46129 46175 11763 6270 5493
32 110340 54497 55843 97821 48061 49760 12519 6436 6083
33 93801 47270 46531 83163 41684 41479 10638 5586 5052
34 103078 51356 51722 91487 45409 46078 11591 5947 5644
35 128559 63321 65238 114437 55824 58613 14122 7497 6625
36 107410 53799 53611 95265 47474 47791 12145 6325 5820
37 91723 46457 45266 80940 40961 39979 10783 5496 5287
38 108396 52845 55551 96474 46860 49614 11922 5985 5937
39 81878 41808 40070 72159 36787 35372 9719 5021 4698
40 126089 60353 65736 113152 53625 59527 12937 6728 6209
Contd…
POPULATION
1.11- Age -wise Rural and Urban Population-2011 Census.
Age wise (Years)
Total Rural Urban
Total Male Female Total Male Female Total Male Female
1. 2. 3. 4. 5. 6. 7. 8. 9. 10.
41 83062 42875 40187 72936 37447 35489 10126 5428 4698
42 93789 47054 46735 83036 41253 41783 10753 5801 4952
43 71844 36356 35488 63136 31709 31427 8708 4647 4061
44 70776 35631 35145 62375 31103 31272 8401 4528 3873
45 114338 54723 59615 102653 48391 54262 11685 6332 5353
46 79664 40122 39542 70281 35053 35228 9383 5069 4314
47 64515 33269 31246 56897 29059 27838 7618 4210 3408
48 81011 40409 40602 72100 35635 36465 8911 4774 4137
49 55600 29119 26481 48862 25351 23511 6738 3768 2970
50 108972 49852 59120 99173 44593 54580 9799 5259 4540
51 58977 30779 28198 52177 26876 25301 6800 3903 2897
52 63217 32700 30517 56343 28735 27608 6874 3965 2909
53 48694 25901 22793 42903 22559 20344 5791 3342 2449
54 50827 26492 24335 44815 23029 21786 6012 3463 2549
55 85230 39322 45908 77713 35262 42451 7517 4060 3457
56 56671 29535 27136 50801 26102 24699 5870 3433 2437
57 40289 21949 18340 35616 19133 16483 4673 2816 1857
58 49791 25505 24286 44843 22724 22119 4948 2781 2167
59 34879 18934 15945 31120 16777 14343 3759 2157 1602
60 85300 36833 48467 79385 33923 45462 5915 2910 3005
61 40296 20941 19355 36600 18863 17737 3696 2078 1618
62 41435 21900 19535 37972 20056 17916 3463 1844 1619
63 34977 19812 15165 31628 17923 13705 3349 1889 1460
64 29364 15978 13386 26678 14566 12112 2686 1412 1274
65 62328 27313 35015 58255 25442 32813 4073 1871 2202
66 31639 16313 15326 29100 14964 14136 2539 1349 1190
67 21287 12005 9282 19285 10889 8396 2002 1116 886
68 25399 13304 12095 23150 12089 11061 2249 1215 1034
69 17954 9452 8502 16306 8566 7740 1648 886 762
70 61230 25786 35444 57692 24239 33453 3538 1547 1991
71 23558 11562 11996 21563 10530 11033 1995 1032 963
72 19302 10199 9103 17704 9344 8360 1598 855 743
73 13423 7484 5939 12153 6720 5433 1270 764 506
74 13074 7088 5986 11820 6417 5403 1254 671 583
75 33633 14636 18997 31516 13705 17811 2117 931 1186
76 15135 7517 7618 13893 6889 7004 1242 628 614
77 8530 4766 3764 7683 4285 3398 847 481 366
78 10597 5476 5121 9723 4992 4731 874 484 390
79 7811 4045 3766 7143 3690 3453 668 355 313
80 31612 13028 18584 30010 12367 17643 1602 661 941
81 10589 4737 5852 9900 4434 5466 689 303 386
82 6754 3463 3291 6229 3186 3043 525 277 248
I – AREA AND POPULATION
1.11-Age -wise Rural and Urban Population-2011 Census.
Agewise (Years)
Total Rural Urban
Total Male Female Total Male Female Total Male Female
1. 2. 3. 4. 5. 6. 7. 8. 9. 10.
83 4583 2526 2057 4167 2293 1874 416 233 183
84 4545 2410 2135 4108 2168 1940 437 242 195
85 12502 5558 6944 11810 5241 6569 692 317 375
86 5152 2489 2663 4786 2311 2475 366 178 188
87 2702 1479 1223 2460 1351 1109 242 128 114
88 2483 1290 1193 2261 1174 1087 222 116 106
89 1952 1005 947 1806 936 870 146 69 77
90 8388 3501 4887 8023 3361 4662 365 140 225
91 2698 1214 1484 2562 1149 1413 136 65 71
92 1499 724 775 1384 672 712 115 52 63
93 1047 517 530 967 471 496 80 46 34
94 917 456 461 840 424 416 77 32 45
95 2487 1059 1428 2338 1006 1332 149 53 96
96 1127 503 624 1056 467 589 71 36 35
97 630 320 310 573 292 281 57 28 29
98 886 399 487 837 370 467 49 29 20
99 665 269 396 635 260 375 30 9 21
100+ 3519 1518 2001 3291 1406 1885 228 112 116
Age not
stated 10163 5353 4810 9386 4899 4487 777 454 323
Source: Census of India-2011, H.P.
I – AREA AND POPULATION
1.12-Age-wise Distribution of H.P. Population 1991 Census
Age Group (Years)
Total Rural Urban
Total Male Female Total Male Female Total Male Female
1. 2. 3. 4. 5. 6. 7. 8. 9. 10.
0-4 -- -- -- -- -- -- -- -- --
0-9 1203192 615015 588177 1114452 568393 546059 88740 46622 42118 10-14 634842 324783 310059 586040 298957 287083 48802 25826 22976 15-19 560275 285603 274672 513074 260149 252925 47201 25454 21747 20-24 468553 229356 239197 422765 205110 217655 45788 24246 21542 25-29 411936 200474 211462 368394 177783 190611 43542 22691 20851 30-34 331172 163791 167381 293553 143076 150477 37619 20715 16904 35-39 316272 156210 160062 282198 136960 145238 34074 19250 14824 40-44 244306 121512 122794 218599 106407 112192 25707 15105 10602 45-49 229040 116375 112665 207156 103162 103994 21884 13213 8671
50-54 188078 96765 91313 171026 86270 84756 17052 10495 6557
55-59 146165 75691 70474 134116 68452 65664 12049 7239 4810
60-64 150457 78076 72381 141089 73038 68060 9359 5038 4321
65-69 95481 51196 44285 89697 48043 41654 5784 3153 2631
70-74 79400 42723 36677 75153 40457 34696 4247 2266 1981
75-79 36722 20187 16535 34612 19070 15542 2110 1117 993
80+ 57943 30060 27883 55037 28553 26484 2906 1507 1399
Age not
Stated 17043 9650 7393 14711 8313 6398 2332 1337 995
All Ages 5170877 2617467 2553410 4721681 2372193 2346488 449196 245274 203922
Source: Census of India-1991.
I – AREA AND POPULATION
1.13-Age-wise Distribution of H.P. Population 2001 Census
Age Group (Years)
Total Rural Urban
Total Male Female Total Male Female Total Male Female
1. 2. 3. 4. 5. 6. 7. 8. 9. 10.
0-4 560187 296555 263632 517539 273478 244061 42648 23077 19571 5-9 619164 323058 296106 566404 294317 272087 527760 28741 24019 10-14 705039 361257 343782 644995 329113 315882 60044 32144 27900 15-19 626624 324318 302306 564788 289354 275434 61836 34964 26872 20-24 583029 295703 287326 515945 256218 259727 67084 39485 27599 25-29 517507 256532 260975 458593 224315 234278 58914 32217 26697 30-34 432675 215401 217274 381339 187653 193686 51336 27748 23588 35-39 411062 199846 211216 362046 173247 188799 49016 26599 22417 40-44 330669 167405 163264 291109 144391 146718 39560 23014 16546 45-49 302882 151023 151859 270052 131634 138418 32830 19389 13441 50-54 238245 123075 115170 214098 108551 105547 24147 14524 9623
55-59 188537 94721 93816 171610 84952 86658 16927 9769 7158
60-64 174130 86950 87180 161344 80078 81266 12786 6872 5914
65-69 128906 61456 67450 119674 56746 62928 9232 4710 4522
70-74 106707 53486 53221 99721 49780 49941 6986 3706 3280
75-79 56865 29021 27844 53005 27014 25991 3860 2007 1853
80+ 80956 39933 41023 76577 37801 38776 4379 2132 2247
Age not
Stated 14716 8200 6516 13480 7431 6049 1236 769 467
All Ages 6077900 3087940 2989960 5482319 2756073 2726246 595581 331867 263714 Source: Census of India-2001.
I – AREA AND POPULATION
1.14-Age-wise Distribution of
H.P.Population- 2011 Census
Group Age Years
Total Rural Urban
Total Male Female Total Male Female Total Male Female
1. 2. 3. 4. 5. 6. 7. 8. 9. 10.
0-4 544984 285011 259973 500931 261743 239188 44053 23268 20785 0-9 591177 311457 279720 537559 282441 255118 53618 29016 24602 10-14 639224 338240 300984 580265 305500 274765 58959 32740 26219 15-19 640461 336729 303732 575991 300554 275437 64470 36175 28295 20-24 643866 323720 320146 573439 285167 288272 70427 38553 31874 25-29 589160 290125 299035 523605 255016 268589 65555 35109 30446 30-34 546357 271253 275104 485375 239272 246103 60982 31981 29001 35-39 517966 258230 259736 459275 227906 231369 58691 30324 28367 40-44 445560 222269 223291 394635 195137 199498 50925 27132 23793 45-49 395128 197642 197486 350793 173489 177304 44335 24153 20182 50-54 330687 165724 164963 295411 145792 149619 35276 19932 15344 55-59 266860 135245 131615 240093 119998 120095 26767 15247 11520 60-64 231372 115464 115908 212263 105331 106932 19109 10133 8976
65-69 158607 78387 80220 146096 71950 74146 12511 6437 6074
70-74 130587 62119 68468 120932 57250 63682 9655 4869 4786
75-79 75706 36440 39266 69958 33561 36397 5748 2879 2869
80+ 106737 48465 58272 100043 45339 54704 6694 3126 3568
Age Not
Stated 10163 5353 4810 9386 4899 4487 777 454 323
All Ages 6864602 3481873 3382729 6176050 3110345 3065705 688552 371528 317024
I – AREA AND POPULATION
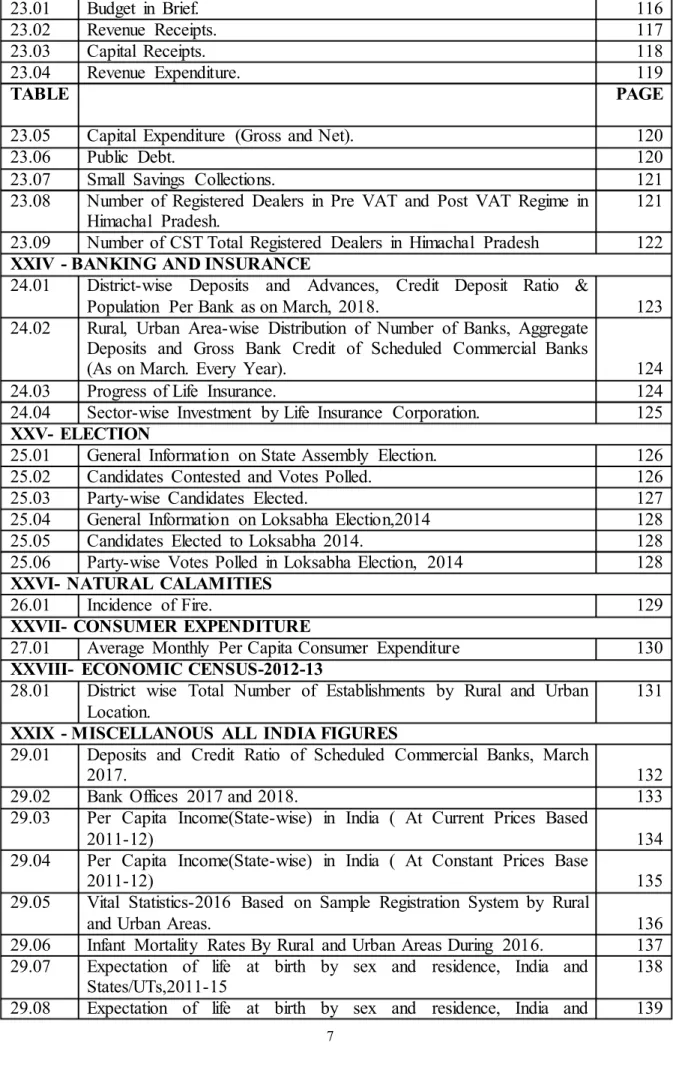
1.15- District-wise Number/Average size of Households in Himachal Pradesh-2001 and 2011 Census.
District
2001 2011
Total Rural Urban Total Rural Urban
1. 2. 3. 4. 5. 6. 7.
1. Bilaspur 65750(5.2) 60788(5.2) 4962(4.4) 80485(4.8) 74712 (4.8) 5773 (4.4) 2. Chamba 87029(5.3) 79618(5.4) 7411 (4.7) 102460(5.1) 94596(5.1) 7864 (4.6) 3. Hamirpur 86771(4.8) 80024(4.8) 6747(4.5) 105519(4.3) 98115 (4.3) 7404(4.3) 4. Kangra 272487(4.9) 256490(4.9) 15997(4.5) 338887(4.5) 318379(4.5 20508(4.2)
5. Kinnaur 18641(4.2) 18641(4.2) - 19976 (4.2) 19976 (4.2) -
6. Kullu 76902(5.0) 69483(5.1) 7419(4.1) 94807 (4.6) 84358 (4.7) 10449 (4.0)
7. Lahaul-Spiti 7999(4.2) 7999(4.2) - 6674 (4.7) 6674 (4.7) -
8. Mandi 182378(4.9) 168021(5.0) 14357(4.2) 219145 (4.6) 203747(4.6) 15398(4.1) 9. Shimla 154693(4.7) 110603(5.0) 44090(3.8) 184362 (4.4) 129854(4.7) 54508 (3.7) 10. Sirmaur 81441(5.6) 71097(5.8) 10344(4.6) 98208 (5.4) 85087 (5.6) 13121(4.4) 11. Solan 99317(5.0) 77086(5.3) 22231(4.1) 122425(4.7) 96510 (5.0) 25915 (3.9) 12. Una 88181(5.1) 79947(5.1) 8234(4.8) 110332 (4.7) 100502(4.7) 9830(4.6) H.P. 1221589(5.0) 1079797(5.1) 141792(4.2) 1483280(4.6) 1312510(4.7) 170770(4.0)
Note: Figures in brackets are average size of Household per dwelling.
Source: Census of India-2001& 2011.
5.2 5.3
4.8 4.9 4.2
5
4.2
4.9 4.7 5.6
5 5.1
4.8 5.1
4.3 4.5 4.2
4.6 4.7
4.6 4.4 5.4
4.7 4.7
0 1 2 3 4 5 6
District wise percentage distribution of average size of household in Himachal Pradesh -2001 &
2011 census
2001 2011
I – AREA AND POPULATION
1.16– District And Tehsil/Sub-Tehsil- Wise Rural And Urban Population-2011
District/
Tehsil Total Rural Urban
Total Male Female Total Male Female Total Male Female BILASPUR 3,81,956 1,92,764 1,89,192 3,56,827 1,79,653 1,77,174 25,129 13,111 12,018 Ghumarwin 89,516 44,611 44,905 81,617 40,436 41,181 7,899 4,175 3,724
Bharari(ST) 45,713 22,160 23,553 45,713 22,160 23,553 0 0 0
Jandutta 91,562 46,167 45,395 89,190 44,916 44,274 2,372 1,251 1,121 Naina Deviji 46,684 24,267 22,417 45,480 23,622 21,858 1,204 645 559 BilaspurSadar 75,714 38,848 36,866 62,060 31,808 30,252 13,654 7,040 6, 614
Namhol(ST) 32,767 16,711 16,056 32,767 16,711 16,056 0 0 0
CHAMBA 5,19,080 2,61,320 2,57,760 4,82,972 2,41,963 2,41,009 36,108 19,357 16,751
Pangi 18,868 9,579 9,289 18,868 9,579 9,289 0 0 0
Churah 78,988 40,152 38,836 78,988 40,152 38,836 0 0 0
Saluni 47,939 24,197 23,742 47,939 24,197 23,742 0 0 0
Bhallai (S.T) 25,326 12,561 12,765 25,326 12,561 12,765 0 0 0
Dalhousie 46,760 24,339 22,421 36,160 17,968 18,192 10,600 6,371 4,229 Bhatiyat 42,967 21,550 21,417 37,392 18,535 18,857 5,575 3,015 2,560
Sihunta (S.T) 39,871 19,634 20,237 39,871 19,634 20,237 0 0 0
Chamba 1,79,253 89,199 90,054 1,59,320 79,228 80,092 19,933 9,971 9,962
Holi (S.T) 14,094 7,236 6,858 14,094 7,236 6,858 0 0 0
Bharmaur 25,014 12,873 12,141 25,014 12,873 12,141 0 0 0
HAMRIPUR 4,54,768 2,17,070 2,37,698 4,23,338 2,00,748 2,22,590 31,430 16,322 15,108 Sujanpur Tira 46,007 21,624 24,383 38,064 17,362 20,702 7,943 4,262 3,681 Nadaun 81,089 39,445 41,644 76,659 37,179 39,480 4,430 2,266 2,164
Galore(ST) 26,957 12,716 14,241 26,957 12,716 14,241 0 0 0
Hamirpur 1,16,948 56,855 60,093 99,344 47,799 51,545 17,604 9,056 8,548
Barsar 55,556 26,655 28,901 54,103 25,917 28,186 1,453 738 715
Dhatwal (ST) 37,621 17,579 20,042 37,621 17,579 20,042 0 0 0
Bhoranj 90,590 42,196 48,394 90,590 42,196 48,394 0 0 0
KANGRA 15,10,075 7,50,591 7,59,484 14,23,794 7,05,365 7,18,429 86,281 45,226 41,055 Nurpur 1,76,525 90,074 86,451 1,66,718 84,969 81,749 9,807 5,105 4,702 Indora 81,226 42,226 39,000 76,692 39,901 36,791 4,534 2,325 2,209
Fatehpur 62,041 31,105 30,936 62,041 31,105 30,936 0 0 0
Jawali 1,12,746 56,022 56,724 1,12,746 56,022 56,724 0 0 0
Harchakian (ST) 13,841 6,746 7,095 13,841 6,746 7,095 0 0 0
Shahpur 67,758 33,220 34,538 67,758 33,220 34,538 0 0 0
Dharamsala 1,36,536 70,178 66,358 93,744 47,329 46,415 42,792 22,849 19,943 Kangra 97,568 49,194 48,374 88,040 44,302 43,738 9,528 4,892 4,636 Nagrota
Bagwan 76,899 38,347 38,552 70,999 35,346 35,653 5,900 3,001 2,899
Badoh 25,789 12,403 13,386 25,789 12,403 13,386 0 0 0
Dehra
Gopipur 1,20,783 58,552 62,231 1,15,967 56,094 59,873 4,816 2,458 2,358 Jawalamukhi 43,504 21,186 22,318 38,143 18,404 19,739 5,361 2,782 2,579
Jaswan 32,520 15,907 16,613 32,520 15,907 16,613 0 0 0
Rakkar 29,503 14,451 15,052 29,503 14,451 15,052 0 0 0
Khundian 38,231 18,607 19,624 38,231 18,607 19,624 0 0 0
Thural (S.T.) 19,287 9,034 10,253 19,287 9,034 10,253 0 0 0
Dheera (S.T.) 22,119 10,498 11,621 22,119 10,498 11,621 0 0 0
Jaisinghpur 61,082 27,938 33,144 61,082 27,938 33,144 0 0 0
Palampur 1,89,276 93,807 95,469 1,85,733 91,993 93,740 3,543 1,814 1,729
Baijnath 95,229 47,175 48,054 95,229 47,175 48,054 0 0 0
Multhan (S.T.) 7,612 3,921 3,691 7,612 3,921 3,691 0 0 0
I – AREA AND POPULATION
1.16– District And Tehsil/Sub-Tehsil- Wise Rural And Urban Population-2011
District/
Tehsil Total Rural Urban
Total Male Female Total Male Female Total Male Female KINNAUR 84,121 46,249 37,872 84,121 46,249 37,872 0 0 0 Hangrang (S.T.) 4,659 2,390 2,269 4,659 2,390 2,269 0 0 0
Pooh 8,309 4,681 3,628 8,309 4,681 3,628 0 0 0
Morang 10,238 5,403 4,835 10,238 5,403 4,835 0 0 0
Kalpa 19,190 10,321 8,869 19,190 10,321 8,869 0 0 0
Nichar 27,683 15,463 12,220 27,683 15,463 12,220 0 0 0
Sangla 14,042 7,991 6,051 14,042 7,991 6,051 0 0 0
KULLU 4,37,903 2,25,452 2,12,451 3,96,512 2,03,269 1,93,243 41,391 22,183 19,208 Manali 51,661 27,710 23,951 43,565 22,993 20,572 8,096 4,717 3379 Kullu 2,06,716 1,06,128 1,00,588 1,74,835 89,410 85,425 31,881 16,718 15,163
Sainj (S.T.) 25,908 13,342 12,566 25,908 13,342 12,566 0 0 0
Banjar 43,612 22,193 21,419 42,198 21,445 20,753 1,414 748 666
Ani (S.T.) 56,917 29,077 27,840 56,917 29,077 27,840 0 0 0
Nirmand 53,089 27,002 26,087 53,089 27,002 26,087 0 0 0
LAHAUL SPITI 31,564 16,588 14,976 31,564 16,588 14,976 0 0 0
Udaipur (S.T.) 8,889 4,482 4,407 8,889 4,482 4,407 0 0 0
Lahaul 10,218 5,415 4,803 10,218 5,415 4,803 0 0 0
Spiti 12,457 6,691 5,766 12,457 6,691 5,766 0 0 0
MANDI 9,99,777 4,98,065 5,01,712 9,37,140 4,66,050 4,71,090 62,637 32,015 30,622
Padhar 49,357 24,963 24,394 49,357 24,963 24,394 0 0 0
Jogindernagar 84,470 41,245 43,225 79,135 38,538 40,597 5,335 2,707 2,628 Lad Bharol 25,832 11,649 14,183 25,832 11,649 14,183 0 0 0
Sandhol (S.T) 16,925 8,067 8,858 16,925 8,067 8,858 0 0 0
Dharmpur(S.T) 34,777 16,550 18,227 34,777 16,550 18,227 0 0 0 Kotli(S.T) 25,860 12,464 13,396 25,860 12,464 13,396 0 0 0 Sarkaghat 64,269 31,222 33047 59,554 28,700 30,854 4,715 2,522 2,193 Bhadrota (S.T.) 21,542 10,705 10,837 21,542 10,705 10,837 0 0 0 Baldwara 43,811 21,444 22,367 43,811 21,444 22,367 0 0 0 Sundernagar 1,11,351 56,437 54,914 87,007 43,976 43,031 24,344 12,461 11,883 Mandi 2,16,051 1,08,763 1,07,288 1,87,808 94,438 93,370 28,243 14,325 13,918
Aut (S.T.) 30,893 15,641 15,252 30,893 15,641 15,252 0 0 0
Bali Chowki(S.T) 37,913 19,389 18,524 37,913 19,389 18,524 0 0 0
Thunag 50,308 25,461 24,847 50,308 25,461 24,847 0 0 0
Chachyot 57,723 28,892 28,831 57,723 28,892 28,831 0 0 0
Nihri (S.T.) 35,569 18,051 17,518 35,569 18,051 17,518 0 0 0
Karsog 93,126 47,122 46,004 93,126 47,122 46,004 0 0 0
SHIMLA 8,14,010 4,25,039 3,88,971 6,12,659 3,14,295 2,98,364 2,01,351 1,10,744 90,607 Rampur 77,542 40,683 36,859 67,232 35,100 32,132 10,310 5,583 4,727
Nankhari(ST) 26,238 13,292 12,946 26,238 13,292 12,946 0 0 0
Kumarsain 43,062 21,888 21,174 42,161 21,354 20,807 901 534 367
Seoni 35,379 17,682 17,697 32,788 16,281 16,507 2,591 1,401 1,190 Shimla (R) 84,382 44,022 40,360 82,320 42,588 39,732 2,062 1,434 628
Shimla (U) 1,69,578 93,152 76,426 0 0 0 1,69,578 93,152 76,426
Junga (S.T) 13,398 6,834 6,564 13,398 6,834 6,564 0 0 0
Theog 84,684 43,219 41,465 80,331 40,991 39,340 4,353 2,228 2,125
Chopal 31,118 16,008 15,110 29,267 14,976 14,291 1,851 1,032 819
Cheta(S.T) 19,460 10,094 9,366 19,460 10,094 9,366 0 0 0
I – AREA AND POPULATION
1.16– District And Tehsil/Sub-Tehsil- Wise Rural And Urban Population-2011
District/
Tehsil Total Rural Urban
Total Male Female Total Male Female Total Male Female
Nerwa (S.T) 36,517 18,751 17,766 36,517 18,751 17,766 0 0 0
Jubbal 37,637 19,344 18,293 35,997 18,414 17,583 1,640 930 710
Kotkhai 39,205 20,095 19,110 38,015 19,404 18,611 1,190 691 499
Tikkar (S.T) 13,806 7,202 6,604 13,806 7,202 6,604 0 0 0
Rohru 49,490 25,607 23,883 42,615 21,848 20,767 6,875 3,759 3,116
Chirgaon 46,142 23,839 22,303 46,142 23,839 22,303 0 0 0
Dodra Kwar 6,372 3,327 3,045 6,372 3,327 3,045 0 0 0
SIRMAUR 5,29,855 2,76,289 2,53,566 4,72,690 2,46,175 2,26,515 57,165 30,114 27,051 Rajgarh 48,999 25,223 23,776 45,916 23,599 22,317 3,083 1,624 1,459
Nohra(S.T.) 23,022 11,730 11,292 23,022 11,730 11,292 0 0 0
Pachhad 53,800 27,912 25,888 53,800 27,912 25,888 0 0 0
Renuka 47,388 24,221 23,167 47,388 24,221 23,167 0 0 0
Dadahu(S.T.) 17,403 8,870 8,533 17,403 8,870 8,533 0 0 0
Nahan 84,149 44,077 40,072 55,250 28,852 26,398 28,899 15,225 13,674 Poanta Sahib 1,57,799 83,015 74,784 1,32,616 69,750 62,866 25,183 13,265 11,918
Kamrau (S.T.) 37,066 19,400 17,666 37,066 19,400 17,666 0 0 0
Shalai 36,905 19,403 17,502 36,905 19,403 17,502 0 0 0
Ronhat (S.T.) 23,324 12,438 10,886 23,324 12,438 10,886 0 0 0
SOLAN 5,80,320 3,08,754 2,71,566 4,78,173 2,49,736 2,28,437 1,02,147 59,018 43,129 Arki 56,908 28,363 28,545 53,868 26,831 27,037 3,040 1,532 1,508 Darlaghat (S.T) 36,763 19,123 17,640 36,763 19,123 17,640 0 0 0
Ramshahr(S.T) 32,594 16,601 15,993 32,594 16,601 15,993 0 0 0
Nalagarh 1,14,211 60,396 53,815 1,03,503 54,657 48,846 10,708 5,739 4,969 Baddi 90,942 52,308 38,634 61,031 32,976 28,055 29,911 19,332 10,579 Krishangarh(S.T) 24,511 12,400 12,111 24,511 12,400 12,111 0 0 0 Kasauli 67,264 37,238 30,026 54,621 29,911 24,710 12,643 7,327 5,316 Solan 1,16,598 61,368 55,230 70,753 36,280 34,473 45,845 25,088 20,757
Kandaghat 40,529 20,957 19,572 40,529 20,957 19,572 0 0 0
UNA 5,21,173 2,63,692 2,57,481 4,76,260 2,40,254 2,36,006 44,913 23,438 21,475
Bharwain(S.T) 17,847 8,997 8,850 17,847 8,997 8,850 0 0 0
Amb 1,68,793 84,985 83,808 1,61,183 81,129 80,054 7,610 3,856 3,754
Bangana 73,035 36,336 36,699 73,035 36,336 36,699 0 0 0
Una 1,90,082 97,066 93,016 1,52,779 77,484 75,295 37,303 19,582 17,721
Haroli 71,416 36,308 35,108 71,416 36,308 35,108 0 0 0
H.P. 68,64,602 34,81,873 33,82,729 61,76,050 31,10,345 30,65,705 6,88,552 3,71,528 3,17,024 Source: - Census of India-2011
I – AREA AND POPULATION
1.17– Scheduled Castes Population –2011 Census
District Rural Urban Total
Scheduled Castes as percentage
total to population Male Female Total Male Female Total Male Female Total
1. 2. 3. 4. 5. 6. 7. 8. 9. 10. 11.
1. Bilaspur 47550 46128 93678 2721 2590 5311 50271 48718 98989 25.92 2. Chamba 53144 52491 105635 3010 3045 6055 56154 55536 111690 21.52 3. Hamirpur 50806 52735 103541 2921 2794 5715 53727 55529 109256 24.02 4. Kangra 152186 152616 304802 7511 7072 14583 159697 159688 319385 21.15
5. Kinnaur 7433 7317 14750 - - - 7433 7317 14750 17.53
6. Kullu 58981 56533 115514 3705 3440 7145 62686 59973 122659 28.01
7. L&S 1154 1081 2235 - - - 1154 1081 2235 7.08
8. Mandi 140605 139975 280580 6645 6514 13159 147250 146489 293739 29.38 9. Shimla 91176 88059 179235 19652 16890 36542 110828 104949 215777 26.51 10.Sirmaur 77367 72352 149719 5650 5376 11026 83017 77728 160745 30.34 11.Solan 76902 71898 148800 8580 7156 15736 85482 79054 164536 28.35 12.Una 54768 53278 108046 3833 3612 7445 58601 56890 115491 22.16 H.P. 812072 794463 1606535 64228 58489 122717 876300 852952 1729252 25.19 Source: Census of India-2011.
I – AREA AND POPULATION
1.18– Scheduled Tribes Population – 2011 Census
District Rural Urban Total Scheduled
Tribes percentage as
to total population Male Female Total Male Female Total Male Female Total
1. 2. 3. 4. 5. 6. 7. 8. 9. 10. 11.
1. Bilaspur 5290 5044 10334 195 164 359 5485 5208 10693 2.80
2. Chamba 66589 66318 132907 1311 1282 2593 67900 67600 135500 26.10
3. Hamirpur 1396 1405 2801 135 108 243 1531 1513 3044 0.67
4. Kangra 39498 40736 80234 2247 2083 4330 41745 42819 84564 5.60
5. Kinnaur 23609 25137 48746 - - - 23609 25137 48746 57.95
6. Kullu 6320 6143 12463 2173 2186 4359 8493 8329 16822 3.84
7. L&-S 12748 12959 25707 - - - 12748 12959 25707 81.44
8. Mandi 6114 6245 12359 231 197 428 6345 6442 12787 1.28
9. Shimla 2795 2604 5399 1759 1597 3356 4554 4201 8755 1.08
10.Sirmaur 5702 5213 10915 210 137 347 5912 5350 11262 2.13
11.Solan 12469 11606 24075 882 688 1570 13351 12294 25645 4.42
12.Una 4366 4086 8452 79 70 149 4445 4156 8601 1.65
H.P. 186896 187496 374392 9222 8512 17734 196118 196008 392126 5.71 Source: Census of India-2011.
I – AREA AND POPULATION
1.19-Total Villages in Himachal Pradesh-1991, 2001and 2011 Census.
District
Number of Villages
1991Census 2001 Census 2011 Census
Total In- habited
Un- Inhabited
Total In- habited
Un- Inhabited
Total In- habited
Un- Inhabited
1. 2. 3. 4. 5. 6. 7. 8. 9. 10.
1. Bilaspur 1044 950 94 1061 965 96 1061 953 108
2. Chamba 1591 1144 447 1591 1118 473 1591 1110 481
3. Hamirpur 1650 1617 33 1672 1635 37 1725 1671 54
4. Kangra 3869 3620 249 3868 3619 249 3869 3617 252
5. Kinnaur 662 228 434 660 234 426 660 241 419
6. Kullu 172 172 - 172 172 - 326 314 12
7. L-Spiti 403 272 131 521 287 234 521 280 241
8. Mandi 3338 2818 520 3338 2833 505 3338 2850 488
9. Shimla 2597 2311 286 2914 2520 394 3231 2705 526
10. Sirmaur 968 965 3 971 966 5 976 968 8
11. Solan 2501 2348 153 2536 2388 148 2544 2383 161
12. Una 593 552 41 814 758 56 848 790 58
H.P. 19388 16997 2391 20118 17495 2623 20690 17882 2808
Source: Census of India-1991, 2001 & 2011.
I – AREA AND POPULATION
1.20 – Villages Classified by Population Size-2011 Census
District Total number of inhabited
villages
Number of villages with population Less
than 200
200-499 500-999 1000-
1999 2000-
4999 5000-
9999 10000
&
above
1. 2. 3. 4. 5. 6. 7. 8. 9.
1. Bilaspur 953 369 380 150 39 15 - -
2. Chamba 1110 648 328 116 18 - - -
3. Hamirpur 1671 916 574 147 28 6 - -
4. Kangra 3617 1402 1316 638 218 43 - -
5. Kinnaur 241 118 63 44 11 5 - -
6. Kullu 314 62 66 46 73 57 9 1
7. L&S 280 237 31 10 2 - - -
8. Mandi 2850 1188 1113 449 86 14 - -
9. Shimla 2705 1590 852 226 33 4 - -
10.Sirmaur 968 347 338 164 92 25 2 -
11.Solan 2383 1720 456 140 55 12 - -
12.Una 790 276 197 153 132 31 1 -
H.P. 17882 8873 5714 2283 787 212 12 1
Source: Census of India- 2011.
I – AREA AND POPULATION
1.21– Population of Cities and Towns – 2011 Census
Districts/Town
Population
Persons Male Female
1. 2. 3. 4.
Bilaspur 25129 13111 12018
1. Ghumarwin 7899 4175 3724
2. Talai 2372 1251 1121
3. Sri Naina Devi Ji 1204 645 559
4. Bilaspur 13654 7040 6614
Chamba 36108 19357 16751
1. Chamba 19933 9971 9962
2. Bakloh (C.B.) 1805 1150 655
3. Chuari Khas 3770 1865 1905
4. Dalhousie 7051 3821 3230
5. Dalhousie (C.B.) 3549 2550 999
Hamirpur 31430 16322 15108
1. Sujanpur Tira 7943 4262 3681
2. Nadaun 4430 2266 2164
3. Hamirpur 17604 9056 8548
4. Bhota 1453 738 715
Kangra 86281 45226 41055
1. Nurpur 9807 5105 4702
2. Dehra Gopipur 4816 2458 2358
3. Jwalamukhi 5361 2782 2579
4. Nagrota Bagwan 5900 3001 2899
5. Kangra 9528 4892 4636
6. Yol (C.B.) 12028 6608 5420
7. Dharamsala 30764 16241 14523
8. Palampur 3543 1814 1729
9. Indora (C.T.) 4534 2325 2209
Kullu 41391 22183 19208
1. Manali 8096 4717 3379
2. Kullu 18536 9608 8928
3. Bhunter 4475 2364 2111
4. Banjar 1414 748 666
5. Shamshi (C.T) 8870 4746 4124
I – AREA AND POPULATION
1.21– Population of Cities and Towns – 2011 Census
1 2 3 4
Mandi 62637 32015 30622
1. Joginder nagar 5335 2707 2628
2. Sarkaghat 4715 2522 2193
3. Rewalsar 1821 984 837
4. Sundarnagar 24344 12461 11883
5. Mandi 26422 13341 13081
Shimla 201351 110744 90607
1. Shimla (M.Corp.) 169578 93152 76426
2. Jutog (C.B.) 2062 1434 628
3. Rampur 5655 2973 2682
4. Narkanda 901 534 367
5. Sunni 2591 1401 1190
6. Theog 4353 2228 2125
7. Chaupal 1851 1032 819
8. Jubbal 1640 930 710
9.Kotkhai 1190 691 499
10. Rohru 6875 3759 3116
11. Jhakri (C.T.) 4655 2610 2045
Sirmaur 57165 30114 27051
1. Rajgarh 3083 1624 1459
2. Nahan 28899 15225 13674
3. Paonta Sahib 25183 13265 11918
Solan 102147 59018 43129
1. Arki 3040 1532 1508
2. Nalagarh 10708 5739 4969
3. Baddi 29911 19332 10579
4. Sabathu (C.B.) 3685 2101 1584
5. Kasauli (C.B.) 3885 2183 1702
6. Solan 39256 21182 18074
7. Dagshai (C.B.) 2904 1805 1099
8. Parwanoo 8758 5144 3614
Una 44913 23438 21475
1. Daulatpur 3763 1878 1885
2. Gagret 3847 1978 1869
3. Una 18722 9851 8871
4. Mehatpur Basdehra 9218 4942 4276
5. Santokhgarh 9363 4789 4574
H.P. 688552 371528 317024
Source: Census of India, 2011.
M.Corp. Municipal Corporation.
C.B. : Cantonment Board.
C.T.: Census Town.
I – AREA AND POPULATION
1.22– Towns Classified by Population Size – 2011 Census
District
Total no. of towns
Number of towns with population 100000 &
above (class I)
50000 to 99999 (class II)
20000 to 49999 (class III)
10000 to 19999 (class IV)
5000 to 9999 (class V)
Less than 5000 (class VI)
1. 2. 3. 4. 5. 6. 7. 8.
1. Bilaspur 4 - - - 1 1 2
2. Chamba 5 - - - 1 1 3
3. Hamirpur 4 - - - 1 1 2
4. Kangra 9 - - 1 1 4 3
5. Kinnaur - - - -
6. Kullu 5 - - - 1 2 2
7. L&S - - - -
8. Mandi 5 - - 2 - 1 2
9. Shimla 11 1 - - - 2 8
10.Sirmaur 3 - - 2 - - 1
11.Solan 8 - - 2 1 1 4
12.Una 5 - - - 1 2 2
H.P. 59 1 - 7 7 15 29
Source: Census of India-2011.
I – AREA AND POPULATION
1.23- Distribution of the disabled population by sex and residence -2011
District Total Rural Urban
Person Male Female Person Male Female Person Male Female
1. 2. 3. 4. 5. 6. 7. 8. 9. 10.
1. Bilaspur 7965 4472 3493 7587 4253 3334 378 219 159
2.Chamba 9500 5226 4274 9059 4968 4091 441 258 183
3. Hamirpur 9995 5296 4699 9587 5057 4530 408 239 169
4. Kangra 33756 19093 14663 31909 17994 13915 1847 1099 748
5.Kinnaur 1919 986 933 1919 986 933 - - -
6. Kullu 8581 4799 3782 7770 4358 3412 811 441 370
7. L&S 696 370 326 696 370 326 - - -
8. Mandi 25921 14180 11741 24571 13459 11112 1350 721 629
9. Shimla 21834 12125 9709 18128 9928 8200 3706 2197 1509
10.Sirmaur 10946 6222 4724 9839 5565 4274 1107 657 450
11.Solan 14815 8283 6532 12943 7191 5752 1872 1092 780
12.Una 9388 5269 4119 8657 4834 3823 731 435 296
H.P. 155316 86321 68995 142665 78963 63702 12651 7358 5293
Source: Census of India-2011.