STATISTICAL HANDBOOK DISTRICT UDHAMPUR
2018-19
ISSUED BY:-
DIRECTORATE OF ECONOMICS & STATISTICS PLANNING DEVELOPMENT AND MONITORING
DEPARTMENT
DISTRICT STATISTICS AND EVALUATION
OFFICE UDHAMPUR
Contents
Table No Description Page No.
1 2 3
i. Conversion Table I
ii. District at a Glance II
I Population 1
1.00 Total Population of the District 2
1.01 Growth of Population 3
1.02 Population by Religion 4
1.03 Tehsil-wise Population 5
1.04 Population Block-wise 6-7
1.05 Population by age groups 8
1.06 Schedule Caste Population 9
1.07 Schedule Tribe Population 10
1.08 Working Force 11
1.09 No. of villages 12
1.10 No. of villages by blocks 13
II Vital Statistics 14
2.00 No. of births & deaths 15
2.01 Infant Death/Maternal Death and Still Births 16
III Climate 17
3.00 Rain fall & Rainy days 18
IV Agriculture 19
4.00 Land Utilization Pattern 20-21
4.01 Area under Crops 22-23
4.02 Land holdings & Holding size 24
4.03 Fertilizer off take 25
4.04 Crop Calendar 26
4.05 Improved Seed Distributed 27
4.06 Area under HYV 28
4.07 Avg. yield of Principal Crops 29
V Horticulture 30
5.00 Horticulture Extension 31
VI Irrigation 32
6.00 Source of Irrigation 33
6.01 Area Irrigated 34
VII Live Stock & Veterinary 35
7.00 Live Stock & Poultry Population 36
as per Live Stock Census
7.01 Tehsil-wise Live Stock Population 37
7.02 Livestock Population Category wise 38
7.03 Breeding Prog./ Artificial insemination 39
7.04 Veterinary Units & Sub units 40
7.05 Sheep farms & Centers 41
7.06 Preventive Measures 42
7.07 Veterinary Personnel 43
7.08 Animals treated 44
7.09 Animal Slaughtered 45
VIII Forest 46
8.00 Area & Out turn of forests 47
IX CD & NES 48
9.00 Panchayats & Villages 49
9.01 Identification of targets Families SGSY 50
9.02 NRLM(National Rural Livelihood Mission) 51
X Co-Operation 52
10.00 No. of Societies 53
10.01 Handicraft & Handloom Cooperatives 54
10.02 financial Structure of Societies 55
XI Electricity 56
11.00 Power Houses 57
11.01 Installed Capacity 58
11.02 Rural Electrification 59
11.03 No. of electric installation 60
11.04 Energy Utilization 61
11.05 Pump sets & Tube wells energized 62
XII Roads & Buildings 63
12.00 Category-wise roads maintained by
State PWD 64
12.01 No. of houses 65
XIII Banking Insurance & Savings 66
13.00 No. of Bank Offices 67
13.01 Sale of Small Saving Securities 68
13.02 Life Insurance 69
XIV Industries & Labour 70
14.00 Small Scale Units Regd. With DIC 71
14.01 Registered Factories 72
14.02 Plantation & No. of trees (Sericulture) 73
14.03 Production of Cocoons (Sericulture) 74
14.04 Handicraft and Handlooms Trgs. 75
14.05 Loan Advance under DIC Prog. 76
14.06 Working of Khadi & vill. Industries
registered under KVIB 77
14.07 Craft-wise No. of handicraft trg. Centres
and persons trained therein. 78
XV Employment Exchanges 79
15.00 Employment Exchanges registration and
Placements 80
15.01 Job seekers on live registers of
Employment Exchanges 81
XVI Trade and Commerce 82
16.00 Shops & commercial Establishment 83
16.01 Ownership of and employment in shops 84
XVII Education 85
17.00 No. of Govt. Institution for Gen. Education 86
17.01 Enrolment in Education Institutions 87
17.02 Enrolment and Dropouts 88
17.03 Literacy level 89
17.04 No. of teachers 90
17.05 Percentage of trained teachers 91
17.06 Institution teacher, teacher pupil and
Institution pupil ratio 92
XVIII Health & Family Planning 93
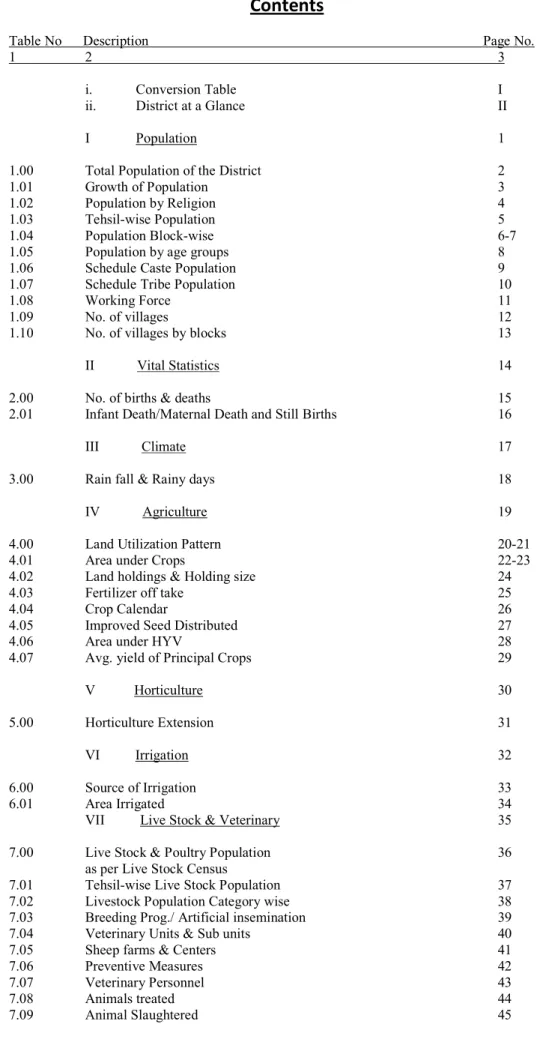
18.00 No. of Medical Institutions 94
18.01 Hospital beds available 95
18.02 Medical personnel available 96
18.03 Sanction Strength of Medical Personal 97
18.04 Health and Family Planning 98
18.05 Patient Doctor Ratio, Population Doctor 99
Ratio, Institution-Population Ratio
18.06 Vaccination Administered 100
18.07 Family Welfare Work done 101
XIX Public Health 102
19.00 No. of wells & drinking water installations 103
19.01 Coverage under Rural Water Supply Prog. 104
XX Post & Telegraphs 105
20.00 Post & Telegraph Offices 106
XXI Social Welfare 107
21.00 Social Welfare Centres 108
21.01 No. of students benefited 109
XXII Judicial Statistics 110
22.00 No. of Judicial Divisions & Courts 111
22.01 Number of Police Stations & Police Posts 112
22.02 Institution and disposal of civil & Criminal
Cases 113
22.03 Civil & Criminal Cases 114
22.04 Cognizable cases reported 115
XXIII Rural Development
23.00 No. of works Taken up and Mandays generated 116
XXIV Planning 117
24.01 Expenditure under Distt. Plan 118
XXV General Information 119
25.00 Entertainment 120
25.01 No. of enterprises and persons
Employed therein 121
25.02 Entertainment and Sales Tax realized 122
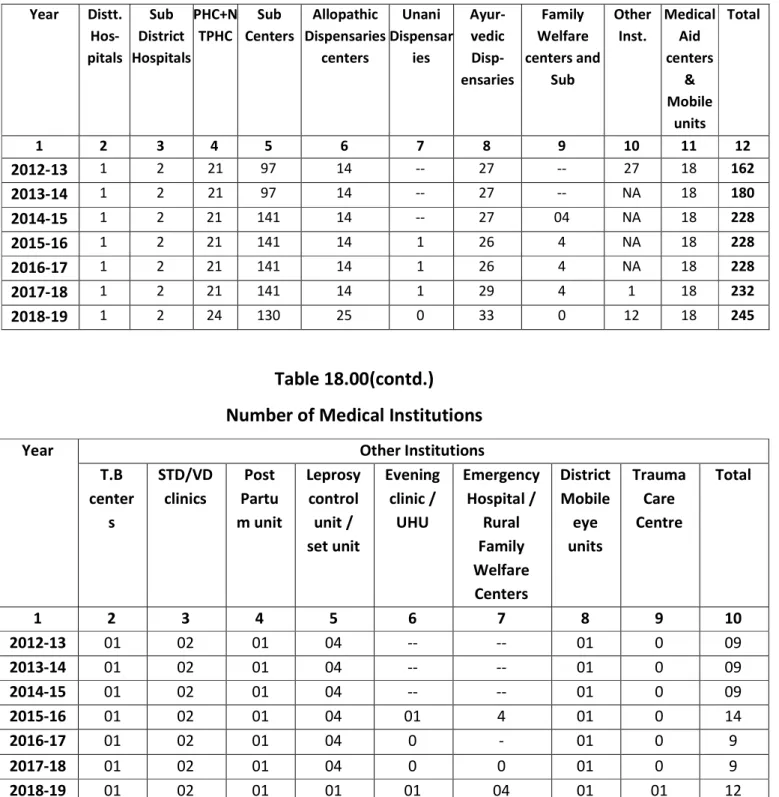
XXV Fire Statistics 123 26.00 Fires Attended and property damaged 124
/salvaged in Udhampur District
XXVII Co-operation 125
27.00 Fruit Growers Co-operative Marketing 126 Societies
XXVIII Tourism 127
28.00 Yatris coming to Shri MataVaishno Devi Ji and 128 Shri Amarnath ji Holy Caves
28.01 No. of Tourists Huts and Bungalows 129 28.02 Hotels and Restaurants for Tourists 130
XXVIX Road Transport 131
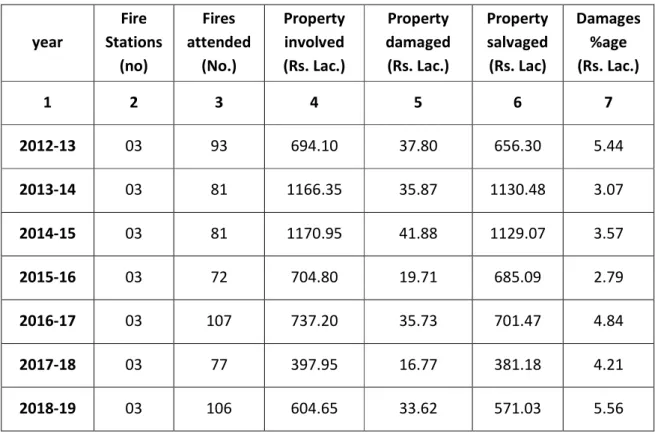
29.00 Road Accident and persons killed/injured 132 29.01 Vehicles Registered 133
XXX Fisheries
30.00 Fisheries (Quantity of Fish caught) 134 30.01 No. of fishing license holders 135
XXXI Floriculture
31.00 Floriculture 136 31.01 Floriculture 137
XXXII Youth Services and Sports
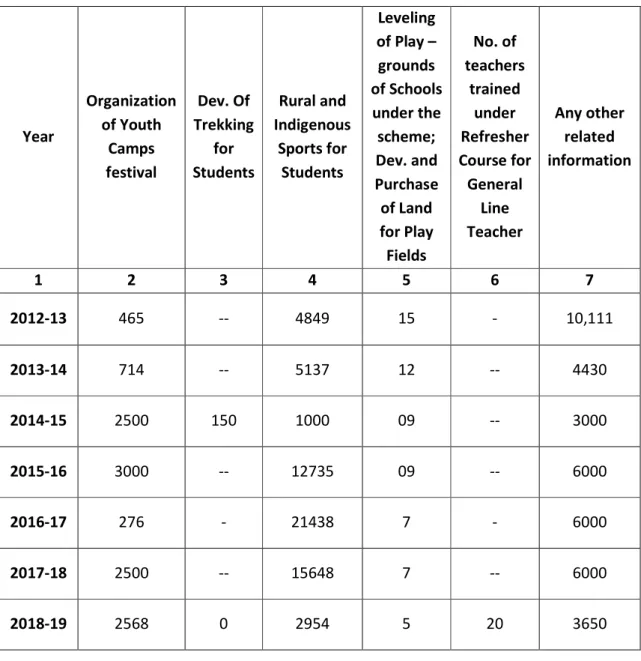
32.00 Youth Services and Sports 138 XXXIII Drug and Food Control organization
33.00 Drug and Food Organization 139
33.01 Inspection conducted during the year 140
33.02 Prosecutions launched and cases decided 141
by the court
33.03 License issued 142 33.04 Premises existing 143
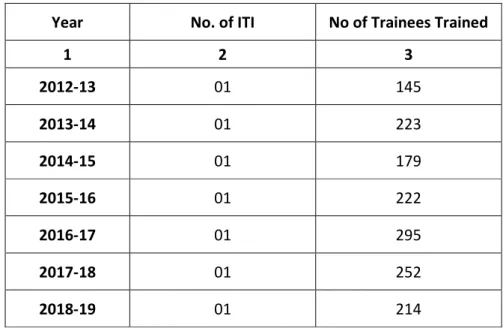
XXXIV Industrial Training Institute
34.00 Industrial Training Institute 144 XXXV IWMP
35.00 IWMP 145
CONVERSION TABLE
1 Area 0.404686 Hectare
1 Square mile 2.59 Sq. Kilometers
1 Square Mile 640 Acres
1 Sq yard 0.84 Sq. meter
1 Hectare 2.47105 Acres
1 Square Kilometer 0.38610 Sq Mile.
1 Square Meter 1.20 Sq. yards
1 Square Kilometer 100 Hectt.(99.99Hectt)
WEIGHT
1 Ounce (oz) 28.3495 Grams
1 Pound 0.45359 Kilogram
1 Long Ton 1.01605 Metric Tonnes
1 Short Ton 0.907185 Metric Tonnes
1 Long Ton 2240 Pounds
1 Short Ton 2000 Pounds
1 Maund 82.2857 Pounds
1 Maund 0.37324 Metric Tonnes
1 Maund 0.3732 Quintals
1 Kilogram 2.20463 Pounds
1 Gram 0.035274 Qunce
0.09 Tolas
1 Metric Ton 0.98240 Long Ton
1.10231 Short Ton
1 Metric Ton 1000 Kilograms
1 Metric Ton 2204.63 Pounds
1 Metric Ton 26.792 Maunds (Standard)
1 Hundred Weight 0.5080423 Quintals
1 Seer 0.933 Kilogram
1 Bale of Cotton (391 Lbs) 0.17781 Metric Tons 1 Bale of Jute (400 Lbs) 0.181436 Metric Ton
1 Metric Ton 5.6624 Bale of Cotton
1 Metric Ton 5.5116 Bale of Jute LENGTH
1 Inch 25.4 Millimeters
1 Yard 0.9144 Meter
1 Mile 1.61 Kilometers
1 Millimeter 0.04 Inch
1 Centimeter 0.3937 Inch
1 Meter 1.094 Yards
1 Kilometer 0.62437 Mile
VOLUME
1 Cubic Yard 0.7646 Cubic Meter
1.03079 Cubic Yards
1 Cubic Metre 35.133 Cubic Feet.
CAPACITY
1 Imperial gallon 4.55 Litres
1 Litre 0.22 Imperial
For Conversion of temperature in Centigrade (C) to Fahrenheit (F) use the relation C/5 = (F –32)/9
II
District Udhampur at a Glance
Description Reference Year Unit Magnitude
1 Geographical area 2018-19 Sq. Kms 2380(587896 Acres)
2 Number of Tehsils 2011 Census No. 8
3 Number of Blocks 2011 Census No. 17
4 Number of Panchayats 2018-19 No. 236
5 Number of Villages 2011 Census No. 357
6 Number of inhabited Villages 2011 Census No. 353
7 Population 2011 Census No. 557689
8 Scheduled Castes 2011 Census No. 139217
9 Scheduled Tribe 2011 Census No. 56696
10 Households 2011 Census No. 99808
11 Main Works 2011 Census No. 152442
12 Marginal Workers 2011 Census No. 91230
13 Net area sown 2018-19 Hect. 37987
14 Gross area sown 2018-19 Hect. 81238
15 Net area irrigated 2018-19 Hect. 5821
16 Gross area irrigated 2018-19 Hect. 9129
17 Number of land holding Agri. Census (2010-11) No. 63880
18 Livestock Population 2018-19 In Lakhs 11.473
19 Average livestock 2009-10 No. 19
Per household.
20 Forest Area 2018-19 Sq. Kms 1042.06
21 No. of cooperative societies 2018-19 No. 59
22 Membership in societies 2018-19 No. 23928
23 Power houses 2018-19 No. 3
24 Installed capacity of 2018-19 MWS 32.8
Power houses
25 Villages electrified 2018-19 No. 353
26 S S I Units 2018-19 No. 8
27 Registered factories 2018-19 No. NA
28 Bank Branches 2018-19 No. 86
29 Bank Advances 2018-19 Rs. Lakh. 150677
30 Bank Deposits 2018-19 Rs. Lakh 430918
31 Small saving security 2018-19 Rs. Lakh NA
Sales net
32 Number of primary schools 2018-19 No. 966
33 Number of middle schools 2018-19 No. 520
34 Number of high/higher 2018-19 No. 227
Secondary school
35 Literacy percentage 2011(census) %` 68.49
36 Number of hospitals. / 2018-19 No. 3
Sub District Hospitals
37 Number of dispensaries 2018-19 No. 58
(Allopathic + Ayurvedic)
38 Number of PHC & 2018-19 No. 154
Sub centres Family welfare centres
39 Number of doctors/hakim/ 2018-19 No. 104
vaids
40 Number of hospitals beds 2018-19 No. 495
41 Villages provided safe 2018-19 No. 352
Drinking water
42 Post Offices 2018-19 No. 103
43 Telephone connections 2018-19 No. 3231
44 Non Agricultural enterprises 2005 Eco. Census No. 24890 45 Agricultural enterprises 2005 Eco. Census No. 290
CHAPTER - I
POPULATION
District Udhampur extending over an area of 2,380 Sq. Kms comprises of 357 Villages including 4 un-inhabited villages. It has a population of 557689 as per 2011 census. The district has recorded population growth rate of 20.78% during the decade 2001-2011. Population is mostly rural and only 20% of it reside in towns. Working force accounts for 44% of population.
The main occupation engaging the working force are cultivation, construction, livestock, hunting, trade and commerce engaging 100% of the working force.
Details of population by Tehsils, Blocks rural and urban areas, religious groups,
age groups, distribution of working force, etc. are given in this chapter.
I – Population Table 1.00
Total Population of the District
Census Rural/Urban Total Population
Male Female Total
1971 Rural 162380 148047 310427
Urban 15216 13203 28419
Total 177596 161250 338846
1981 Rural 215041 195348 410389
Urban 22922 20325 43247
Total 237963 215673 453636
1991(Estimated) 337502 244598 582100
2001 Rural 191266 171848 363114
Urban 57609 38763 96372
Total 248875 210611 459486
2011 Rural 234379 215102 449481
Urban 63810 44398 108208
Total 298189 259500 557689
Note: - Urban Population also includes population of outgrowth villages, Census towns and special charges.
I – Population Table 1.01 Growth of Population
Decade Decadal Growth of Population Percentage
District Udhampur Jammu and Kashmir
1901-1911 7.54 7.16
1911-1921 4.45 5.75
1921-1931 6.37 10.14
1931-1941 8.62 10.36
1941-1951 10.28 10.42
1951-1961 9.32 9.44
1961-1971 30.12 29.65
1971-1981 33.88 29.69
1981-1991 28.75 30.89
1991-2001 27.3 29.43
2001-2011 20.78 23.71
Source: Census Department
I - Population Table 1.02
Population by Religion
[In Numbers]
Tehsil Hindus Muslims Sikhs Buddhists Christians Others Total
1 2 3 4 5 6 7 8
Udhampur 121306 13552 2804 -- 577 5 138244
Chenani 25854 4138 172 -- 2 -- 31066
Ramnagar 100103 12012 49 -- 98 69 112331
Reasi 63073 15034 2362 -- 509 13 80991
Gool Gulabgarh 17202 74251 354 -- 97 -- 91904
Total 327538 118987 5741 -- 1283 87 453636
Percentage (%) 72.20 26.23 1.27 -- 0.28 0.02 100.00 District (2001
Census) 542593 190112 7723 211 2632 238 743509
Percentage 73.00 25.56 1.04 0.03 0.35 0.03 100
Census 2011
Udhampur 242666 27376 3258 96 1709 454 275559
Chenani 54095 10382 146 3 35 92 64753
Ramnagar 150220 16550 11 5 104 120 167010
Majalta 42063 5463 3 2 114 18 47663
Total 489044 59771 3418 106 1962 684 554985
Source: Census Department
Note: 1.Tehsil wise break up of religion wise population for 2001 Census not available.
2. Data pertains to erstwhile district.
I –Population Table 1.03
Population by Tehsils
[In Numbers]Area
Number Enumerated
1981 1991
(Est) 2001 2011
Persons Male Female Persons Persons Male Female Persons Male Female
1 2 3 4 5 6 7 8 9 10 11
Udhampur
Total 138244 72117 66127 177986 239100 134148 104952 228520 127110 101410 Rural 109592 57019 52593 -- 175203 94318 80885 130789 68781 62008 Urban 28652 15098 13554 -- 63897 39830 24067 97731 58329 39402 Ramnagar
Total 112326 57289 55042 144616 131666 68249 63417 132692 68906 63786 Rural 108256 55124 53132 -- 124890 64539 60351 126400 65669 60731
Urban 4075 2165 1910 -- 6776 3710 3066 6292 3237 3055
Chenani
Total 30166 15792 14374 38845 51386 26861 24525 57654 29969 27685 Rural 28865 15099 13766 -- 48089 25055 23034 53469 27725 25744
Urban 1301 693 608 -- 3297 1806 1491 4185 2244 1941
Majalta
Total -- -- -- -- 37334 19617 17717 50367 26492 23875
Rural -- -- -- -- 37334 19617 17717 50367 26492 23875
Urban -- -- -- -- -- -- -- -- -- --
Basantgarh
Total -- -- -- -- -- -- -- 18645 9735 8910
Rural -- -- -- -- -- -- -- 18645 9735 8910
Urban -- -- -- -- -- -- -- -- -- --
Latti
Total -- -- -- -- -- -- -- 22772 11769 11003
Rural -- -- -- -- -- -- -- 22772 11769 11003
Urban -- -- -- -- -- -- -- -- -- --
Panchari
Total -- -- -- -- -- -- -- 27972 14410 13562
Rural -- -- -- -- -- -- -- 27972 14410 13562
Urban -- -- -- -- -- -- -- -- -- --
Moungri
Total -- -- -- -- -- -- -- 19067 9798 9269
Rural -- -- -- -- -- -- -- 19067 9798 9269
Urban -- -- -- -- -- -- -- -- -- --
G.Total
Total 280736 145198 135543 361447 459486 248875 210611 557689 298189 259500 Rural 246713 127242 119491 -- 385516 203529 181987 449481 234379 215102 Urban 34028 17956 16072 -- 73970 45346 28624 108208 63810 44398
Source: Census Department Note: - 1. Urban Population also includes population of outgrowth villages, Census towns and special charges.
2. Population of Tehsil Majalta includes village Chani Mansar and Excludes Village Harduilian.
I - Population Table 1.04 Population by Blocks
Block
NUMBER ENUMERATED 1981
1991 2001 2011
Persons Male Female Persons Male Female Persons Male Female
1 2 3 4 5 6 7 8 9 10 11
UDHAMPUR
Rural 60435 31342 29093 N/A
85888 46340 39548 75481 39976 35505 Urban 28652 15098 13554 63897 39830 24067 88472 53275 35197 Total 89087 46440 42647 149785 86170 63615 163953 93251 70702 PANCHARI
Rural 22662 11967 10695 N/A
39124 21427 17697 26260 13551 12709
Urban -- -- -- -- -- -- -- -- --
Total 22662 11967 10695 39124 21427 17697 26260 13551 12709 CHENANI
Rural 55360 28809 26551 N/A
98280 51606 46674 46943 24354 22589
Urban 1301 693 608 3927 1806 1491 4185 2244 1941
Total 56661 29502 27159 101577 53412 48165 51128 26598 24530 MAJALTA
Rural 22893 11649 11244 N/A
31633 16598 15035 24460 12927 11533
Urban -- -- -- -- -- -- -- -- --
Total 22893 11649 11244 31633 16598 15035 24460 12927 11533 RAMNAGAR
Rural 28490 14348 14142 N/A
44643 23065 21578 36552 19020 17532
Urban 4075 2165 1910 6776 3710 3066 6292 3237 3055
Total 32565 16513 16052 51419 26775 24644 42844 22257 20587 GHORDI
Rural 31323 15668 15655 N/A
47189 24255 22934 40949 21354 19595
Urban -- -- -- -- -- -- -- -- --
Total 31323 15668 15655 47189 24255 22934 40949 21354 19595 DUDU-Basantgarh
Rural 25550 13459 12091 N/A
38759 20238 18521 16630 8738 7892
Urban -- -- -- -- -- -- -- -- --
Total 25550 13459 12091 38759 20238 18521 16630 8738 7892 Latti Marothi
Rural -- -- -- -- -- -- -- 22772 11769 11003
Urban -- -- -- -- -- -- -- -- -- --
Total -- -- -- -- -- -- -- 22772 11769 11003
Chanunta
Rural -- -- -- -- -- -- -- 14357 7420 6937
Urban -- -- -- -- -- -- -- -- -- --
Total -- -- -- -- -- -- -- 14357 7420 6937
Jaganoo
Rural -- -- -- -- -- -- -- 24593 12842 11751
Urban -- -- -- -- -- -- -- 3550 2096 1454
Total -- -- -- -- -- -- -- 28143 14938 13205
Khoon
Rural -- -- -- -- -- -- -- 25907 13565 12342
Urban -- -- -- -- -- -- -- -- -- --
Total -- -- -- -- -- -- -- 25907 13565 12342
Kulwanta
Rural -- -- -- -- -- -- -- 17619 9071 8548
Urban -- -- -- -- -- -- -- -- -- --
Total -- -- -- -- -- -- -- 17619 9071 8548
Sewna
Rural -- -- -- -- -- -- -- 11315 5867 5448
Urban -- -- -- -- -- -- -- -- -- --
Total -- -- -- -- -- -- -- 11315 5867 5448
Parlidhar
Rural -- -- -- -- -- -- -- 13843 7184 6659
Urban -- -- -- -- -- -- -- -- -- --
Total -- -- -- -- -- -- -- 13843 7184 6659
Narsoo
Rural -- -- -- -- -- -- -- 15345 7892 7453
Urban -- -- -- -- -- -- -- 5709 2958 2751
Total -- -- -- -- -- -- -- 21054 10850 10204
Tikri
Rural -- -- -- -- -- -- -- 19238 10014 9224
Urban -- -- -- -- -- -- -- -- -- --
Total -- -- -- -- -- -- -- 19238 10014 9224
Moungri
Rural -- -- -- -- -- -- -- 17217 8835 8382
Urban -- -- -- -- -- -- -- -- -- --
Total -- -- -- -- -- -- -- 17217 8835 8382
DISTRICT [Total]
Rural 246713 127242 119471 N/A
385516 203529 181987 449481 234379 215102 Urban 34028 17956 16072 73970 45346 28624 108208 63810 44398 Total 280741 145198 135543 459486 248875 210611 557689 298189 259500
Sources: Census Department Note: 1.Urban Population also includes population of outgrowth villages, Census towns and special charges.
2. Population of Block Majalta includes village Chani Mansar and Block Khoon Excludes Village Harduilian.
I - Population Table 1.05
Population by age groups (2011)
Source: Census Department
Census Year Age group Male Female Total
1 2 3 4 5
2001 0-6 37622 34322 71944
2011 0-6 44703 39629 84332
I – Population Table 1.06
Scheduled caste Population Number enumerate
[In Numbers]
S.No Rural Urban Total
Tehsil Male Female Total Male Female Total Male Female Total 2001 Census
1 Udhampur 21207 19126 40333 2094 1883 3977 23301 21009 44310 2 Chenani 5552 5167 10719 148 130 278 5700 5297 10997 3 Ramnagar 21263 19834 41097 1030 953 1983 22293 20787 43080
4 Majalta 5146 4638 9784 0 0 0 5146 4638 9784
Total 53168 48765 101933 3272 2966 6238 56440 51731 108171 2011 Census
1 Udhampur 16518 15038 31556 6866 6290 13156 23384 21328 44712 2 Chenani 6045 5590 11635 231 210 441 6276 5800 12076 3 Ramnagar 22690 21176 43866 1150 1080 2230 23840 22256 46096
4 Majalta 6932 6154 13086 -- -- -- 6932 6154 13086
5 Basantgarh 2713 2404 5117 -- -- -- 2713 2404 5117
6 Latti 3537 3402 6939 -- -- -- 3537 3402 6939
7 Panchari 3143 2987 6130 -- -- -- 3143 2987 6130
8 Moungri 2628 2433 5061 -- -- -- 2628 2433 5061
Total 64206 59184 123390 8247 7580 15827 72453 66764 139217
Source: Census Department Note: - Urban Population also includes population of outgrowth villages, Census towns and special charges.
I – Population Table 1.07
Scheduled Tribe Population Number Enumerate
[In Numbers]
S.No Rural Urban Total
Tehsil Male Female Total Male Female Total Male Female Total 2001 Census
1 Udhampur 8977 8209 17186 118 57 175 9095 8266 17361
2 Chenani 5083 4748 9831 15 17 32 5098 4765 9863
3 Ramnagar 6569 6105 12674 14 14 28 6583 6119 12702
4 Majalta 1556 1393 2949 0 0 0 1556 1393 2949
Total 22185 20455 42640 147 88 235 22332 20543 42875 2011 Census
1 Udhampur 7707 7170 14877 1269 1110 2381 8976 8282 17258 2 Chenani 5841 5608 11449 127 144 271 5968 5752 11720
3 Ramnagar 4851 4499 9350 10 11 21 4861 4510 9371
4 Majalta 2865 2599 5464 -- -- -- 2865 2599 5464
5 Basantgarh 1449 1354 2803 -- -- -- 1449 1354 2803
6 Latti 2433 2231 4664 -- -- -- 2433 2231 4664
7 Panchari 2188 2059 4247 -- -- -- 2188 2059 4247
8 Moungri 602 567 1169 -- -- -- 602 567 1169
Total 27936 26087 54023 1406 1267 2673 29342 27354 56696
Source: Census Department
Note: - Urban Population also includes population of outgrowth villages, Census towns and special charges.
I-Population Table 1.08 Working Force
S.No.
Category
Number of Workers
1981 2001 2011
Number Percentage Number Percentage Number Percentage
1 2 3 4 5 6 7
1 Cultivators 99344 69.25 -- -- 57687 23.67
2 Agricultural
Labourers 1115 0.78 -- -- 3858 1.58
3
Livestock, Hunting &
forestry
7009 4.89 -- -- -- --
4 Mining &
Quarrying 113 0.08 -- -- -- --
5
Manufacturing, processing servicing &
Repairs
2456 1.71 -- -- -- --
6
Household, Industry Workers
1745 1.22 -- -- 1210 0.5
7 Construction 8076 5.63 -- -- -- --
8 Trade &
Commerce 5328 3.71 -- -- -- --
9
Transport, Storage &
Communication
2564 1.79 -- -- -- --
10 Other services 15697 10.94 -- -- 180917 74.24
Total 143447 100 222187 0 243672 100
Source: Census Department
I – Population Table 1.09
Number of Census Villages
[In Numbers]
Tehsils Number of Villages by Tehsils
Inhabited Uninhabited Total
Udhampur 139 3 142
Chenani 43 0 43
Ramnagar 67 0 67
Majalta 42 0 42
Basantgarh 15 0 15
Latti 9 1 10
Panchari 23 0 23
Moungri 15 0 15
Total 353 4 357
Source: Census Department
Note: - Villages indicated against Tehsils include villages + outgrowth.
I-Population Table: 1.10
Number of Villages Block wise/Panchayat-wise Census 2011
[In Numbers]
S.No Block Panchayat Villages
Inhabited Un-inhabited Total
1 Udhampur 47 86 3 89
2 Panchari 13 22 0 22
3 Chenani 25 39 0 39
4 Ramnagar 18 18 0 18
5 Majalta 14 25 0 25
6 Ghordi 20 17 0 17
7 Dudu-Basantgarh 9 14 0 14
8 Latti Marothi 12 9 1 10
9 Chanunta 7 8 0 8
10 Jaganoo 11 30 0 30
11 Khoon 13 17 0 17
12 Kulwanta 9 9 0 9
13 Sewna 5 7 0 7
14 Parli Dhar 7 13 0 13
15 Narsoo 8 17 0 17
16 Tikri 10 8 0 8
17 Moungri 8 14 0 14
Total 236 353 4 357
Source: Assistant Commissioner (Dev), Udhampur
CHAPTER - II VITAL STATISTICS
Births and deaths occurring are recorded through chowkidars in
rural areas and sanitary supervisors in the urban areas. The police stations and the local body offices functions as registration office. The field staff and officers of the Directorate of Health and Directorate of Economics and Statistics conduct supervisions of field work. Data are technically tabulated in the central tabulation unit of the Directorate of Economics and Statistics. However, as in the rest of the country, registration is far from complete and would take some time to improve.
The data on births and deaths registered under the normal registration system in the district are given in the chapter.
II - Vital Statistics Table 2.00
No. of Births and Deaths registered by District Sector
Year Sector Births Deaths
Male Female Total Male Female Total
2018 Rural 3672 3513 7185 953 810 1763
Urban 1557 1464 3021 327 165 492
Source: Vital Unit Directorate of Eco. & Stat. Srinagar.
II-VITAL STATISTICS TABLE 2.01
Infant Death/ Maternal Death and Still Births
Year Sector Infant Death Still Birth
Maternal Death Male Female Total Male Female Total
2018 Rural 51 62 113 59 57 116 4
Urban 19 3 22 13 15 28 0
Source: Vital Unit Directorate of Eco. & Stat. Srinagar.
CHAPTER - III CLIMATE
Data on rainfall are recorded at rain gauge stations located at
various places. The amount of rain fall received during the past 24 hours is
recorded at 8.30 hours (1
st) every day. A day recording, rain fall of at least 1/10
of an inch is taken as rainy day. The data recorded on the rain gauge in the
district is given in this chapter.
III - Climate Table 3.00
Rainfall at nearest metrological Station
Year No. of Rainy Days Total Rainfall (in mm)
2018-19 154 1492.00
Source: - Chief Engineer, Irrigation & FC Deptt. Jammu
CHAPTER – IV AGRICULTURE
Agriculture is the main source of livelihood in the district as in the rest of the state. Data on land use, cropping pattern, land holding, off-take of fertilizer, distribution of pesticides and inputs and area sown under different crops are given in this chapter.
.
IV – Agriculture Table No. 4.00 (Area in Hectt.)
Year Reportin g Area
Forest Area
Area not available for cultivation
Other uncultivable land excluding fallow
Fallow land
Net Area Sown Permanen
t pastures and other Grazing
land
Land under
misc.
tree crops groves
not included
area in net area
sown
Cultivabl e land waste
Fallow land other
than current fallows
Current fallows Land
put to non - agricult
ural uses
Barren and uncultiva
ble land
1 2 3 4 5 6 7 8 9 10 11
2012
-13 279310 124276 24516 43700 5572 9576 14106 243 12516 44631 2013
-14 279310 124276 24516 43700 5572 9576 14106 320 12391 44853 2014
-15 279310 124276 24516 43840 5572 3455 22877 297 7826 46651
2015
-16 279310 124276 24516 43666 5572 3392 22877 281 10937 43556
2016
-17 279310 124236 22722 43666 6489 3313 22877 163 6722 48885 2017
-18 279310 124236 22722 43666 7489 5113 20072 198 6722 48885 2018
-19 279310 104206 22722 42658 7489 5176 27003 14555 17340 37987
Source: Financial Commissioner Revenue, J&K.
Contd……
IV – Agriculture Table 4.00 (Area in Hect.)
Year
Marshy and Logged Water
Land
Land Under Still
Water Social Forestry Area Sown More Than Once
12 13 14 15
2012-13 0 174 0 37504
2013-14 NA NA NA 36814
2014-15 0 174 63 34827
2015-16 0 174 63 39876
2016-17 NA 174 63 43880
2017-18 NA 174 63 45899
2018-19 NA 174 63 43251
Source: Financial Commissioner Revenue, J&K.
IV - Agriculture Table No. 4.01
Area Under Crops (Area in Hectt.)
Year Area sown under different crops Paddy Wheat Maize Grim/
Millet
Others (Bajra + Barley)
Pulses Total Food crops
Fruits &
vegetables
Other food crops
Total Food crops (8+9+10)
1 2 3 4 5 6 7 8 9 10 11
2012-
13 7201 33571 34321 0 1383 2042 78518 327 275
(Spices) 79120 2013-
14 7202 33330 34281 34 1268 2126 78241 353 217 78811
2014-
15 6604 30230 33715 16 2795 1472 74832 888 1856 77576
2015-
16 6296 35629 33346 7 2557 1454 79289 472 36 79797
2016-
17 8325 36906 36307 626 2440 1576 86180 4199 0 90379
2017-
18 8325 39643 36307 30 2339 1579 88223 4438 299 92960
2018-
19 6685 35569 27290 191 2366 1371 73472 4446 350 78268
Source: Financial Commissioner Revenue, J&K.
Contd….
IV –Agriculture Table No. 4.01 Area under Crops
Year Area sown under different crops (in Hectares) Oil
seeds
Fibres Fodder Crop
Other Non Food crops
Total Non Food Crops
(12+13+14+15)
Total Area Sown (11+16)
1 12 13 14 15 16 17
2012-13 2617 -- 380 17 3015 82135
2013-14 2283 21 379 00 2683 81494
2014-15 3180 -- 714 8 3902 81478
2015-16 2566 4 305 300 3167 83432
2016-17 1773 8 267 5 2053 92432
2017-18 1509 8 302 5 1824 94784
2018-19 2407 10 532 21 2970 81238
Source: Financial Commissioner Revenue, J&K.
IV – Agriculture Table 4.02
Land holding and holding size
Size Class Holding (Nos.) Area(Hectares)
1 2 3
Marginal 45076 17445.25
Small 11974 16823.40
Semi Medium 5260 14511.90
Medium 1510 8118.40
Large 60 775.10
Total 63880 57674.05
Source: Financial Commissioner Revenue, J&K.
IV – Agriculture Table 4.03
Distribution of Fertilizers [Quantity Distributed in M.Tonnes]
Year Urea DAP MOP NPK Total
1 2 3 4 5 6
2012-13 2163 631 8 0 2802
2013-14 1784 1018 14 0 2816
2014-15 1886 811 28.20 0 2725.20
2015-16 1281.3 785.4 18.4 0 2085.1
2016-17 1534.80 733.70 13.10 0 2281.60
2017-18 1451.5 696.2 28.2 0 2175.9
2018-19 1302.2 668.2 19.4 0.2 1989.8
Source: Addl. Registrar Co-op. Deptt.
IV – Agriculture Table 4.04 Crop Calendar
S.No Crop
Period
Sowing Harvesting Marketing
Peak Lean
1 2 3 4 5 6
1 Paddy May to July October November --
2 Maize April to July September &
October November --
3 Wheat October April to June June & July --
4 Gram October to
November
April May --
5 Urd July November December --
6 Rape & Mustard October to November
April to June June --
7 Onion February June July --
8 Kharief April to June September to
October Oct to Nov December onward
9 Rabi Oct to Dec April – May June July August
onward
Source: Financial Commissioner Office
IV - Agriculture Table 4.05
Improved Seeds Distributed
Year
Quantity Distributed (Quintals)
Paddy Maize Wheat Oil Seeds Fodder Others Total
1 2 3 4 5 6 7 8
2012-13 130.29 708.9 2528.40 36.70 130.60 257.81 3792.70 2013-14 160.00 781.00 5042.30 38.50 186.62 298.60 7343.02 2014-15 214.60 1233.25 5494.40 63.78 315.80 442.60 7764.43 2015-16 137.16 1478.45 7316.00 34.19 584.65 725.10 10275.55 2016-17 211.17 1465.97 4430.20 37.65 458.77 564.37 7168.13 2017-18 225.00 1248.00 5266.00 -- -- 623.00 7362.00 2018-19 162.45 1314.89 4919.60 61.88 320.65 394.10 7173.57
Source: Chief Agriculture Officer Udhampur
IV – Agriculture Table 4.06
Area under HYV Programme
(.000 Hectt.)
Year Area [In Hectares]
Paddy Maize Wheat Others Total
1 2 3 4 5 6
2012-13 9.82 27.98 26.00 10.52 74.32
2013-14 10.00 29.00 10.29 11.399 60.689
2014-15 9.6 28.69 26.00 11.210 75.500
2015-16 10.00 28.50 26.00 11.00 75.50
2016-17 10.00 28.49 23.40 9.91 71.80
2017-18 9.50 28.19 26.59 11.251 75.53
2018-19 9.50 28.35 26.00 11.65 75.50
Source: Chief Agriculture Officer Udhampur .
IV – Agriculture Table 4.07
Average Yield of Principal Crops
Quantils/Hect.
S.
No. Year Rice Maize Wheat
1 2018-19 21.68 26.04 18.58
CHAPTER – V HORTICULTURE
Horticulture has assumed great importance in the State and makes a handsome contribution in the State domestic Product. Data on area under fruit, fruit plant Nurseries and distributions of plants etc. are given in this chapter.
V - Horticulture Table 5.00 Horticulture Extension
Year Area under Fruit(Ha)
No. of Fruit Plant Nurseries
No. of Plants Quantity of fungicides
issued on Govt. account
Equipment issued
As per revenue record Available Distributed Kgs Lts. Ladders Sprayers
1 2 3 4 5 6 7 8 9
2012-13 10571.35 8 37171 22740 140 567 NA NA
2013-14 11130.00 8 31679 18053 60 327 NA NA
2014-15 11130.00 9 21525 14307 110 313 5 42
2015-16 11506.33 9 31753 16752 75 45 -- 8
2016-17 11529.90 9 22734 19586 0 0 0 11
2017-18 11769.65 9 31534 18636 22 26 0 0
2019-19 11809.65 8 84000 17850 14.5 146 6 9
Source: Horticulture Department
CHAPTER – VI IRRIGATION
About 6% sown area in the District is irrigated. Bulk of irrigation is provided by canals. Other sources also irrigate small area. Data on net and gross area irrigated by sources and irrigation of individual crops are given in this chapter.
VI – Irrigation Table 6.00 Sources of Irrigation
Year
Net Area Irrigated(Ha) Gross Area Irrigated(Ha)
Canals Springs /Tank
Wells &
Tube- wells/Bor
e wells
Others Total Canals Springs /Tank
Wells &
Tube- wells/Bore
wells
Others Total
1 2 3 4 5 6 7 8 9 10 11
2012-13 4228 914 2139 529 7810 5485 1185 2775 686 10131
2013-14 4221 914 2339 329 7803 NA NA NA NA NA
2014-15 2994 0 0 0 2994 NA NA NA NA NA
2015-16 3085 0 0 0 3085 6075 0 0 0 6075
2016-17 10212 0 0 0 10212 13339 0 0 0 13339
2017-18 10213 0 0 0 10213 13405 0 0 0 13405
2018-19 5821 0 0 0 5821 9129 0 0 0 9129
Source: Financial Commissioner Revenue, J&K
VI - Irrigation Table 6.01 Area Irrigated
Year
Cropped Area Irrigated Under Different Crops (Ha)
Paddy Wheat Maize Barley /Grim
Other Cereals
&
Millets / Bajra
Total Food Crops
Oil Seeds
Fruits &
vegetabl es
Fodde r
Other Crops
&
Spices
Total Area Irrigate
d (7+8+9+
10+11+
12)
1 2 3 4 5 6 7 8 9 10 11 12
2012-
13 2926 1654 4582 0 198 9427 201 204 100 199 10131
2013-
14 2941 1682 4589 159 68 9439 195 206 100 132 10072
2014-
15 2463 337 1569 -- 32 4401 60 57 26 155 4699
2015-
16 2949 2221 98 76 15 5359 545 17 35 119 6075
2016-
17 3104 6439 1994 43 25 11605 366 1125 40 129 13265
2017-
18 3104 2034 6439 48 82 11707 368 1159 49 122 13405
2018-
19 2779 1992 2048 136 563 7518 377 980 117 137 9129
Source: Financial Commissioner Revenue, J&K
CHAPTER – VII
LIVESTOCK AND VETERINARY
Livestock rearing is an important occupation of the village folks in general and migratory proportion in particular. As per 19
thlivestock Census 2012 the District accounts for 10.948 lakh livestock heads out of a total of 98.993 lacks heads in the state. Every effort is being made to give proper health coverage and breeding facilities, so as to improve the health and quality of the animals. Information on livestock population, health and breeding programme, number of animals and institutions existing, preventive measures and operation preformed etc. is given in this chapter.
VII - Livestock and Veterinary Table 7.00
Livestock and Poultry Population
Number of heads/birds (in Lacs)
Species 2012-13 2013-14 2014-15 2015-16 2016-17 2017-18 2018-19
1 2 3 4 5 6 7 8
Cattle 2.21 2.21 2.21 2.21 2.21 2.590 2.590
Buffalo 0.813 0.813 0.813 0.813 0.823 1.040 01.040
Sheep 2.584 2.609 3.345 3.378 3.412 3.446 3.481
Goat 1.707 1.728 2.470 2.501 2.533 2.564 2.596
Poultry 1.67 1.67 1.67 1.67 1.67 1.67 1.672
Others 0.312 0.376 0.376 0.376 0.376 0.0940 0.094
Total 9.296 9.406 10.884 10.948 11.024 11.404 11.473
Source: Live Stock Census/Distt. Sheep/Animal Husb. Deptt.
VII - Livestock and Veterinary Table: - 7.01
Tehsil wise livestock and Poultry Population (in nos.)
Tehsil Number of Heads in Tehsil
---
Cattle Buffaloes Sheep Goats Others Total Poultry
Birds
1 2 3 4 5 6 7 8
2012-13
Udhampur 93580 36594 71800 49900 15853 267727 92567
Ramnagar 73428 25678 42500 17300 10463 169369 37929
Chenani 27247 9487 23100 26400 2284 88518 24712
Majalta 26664 9525 121000 77100 2594 236883 11703
TOTAL 220919 81284 258400 170700 31194 762497 166911
2013-14
Udhampur 93580 36594 72500 50500 18323 271857 92567
Ramnagar 73428 25678 122200 78100 12421 311827 37929
Chenani 27247 9487 23300 26700 2831 89565 24712
Majalta 26664 9525 42900 17500 4070 100659 11703
TOTAL 220919 81284 260900 172800 37645 762497 166911
2014-15
Udhampur 93580 36594 72500 50500 18323 271857 92567
Ramnagar 73428 25678 122200 78100 12421 311827 37929
Chenani 27247 9487 23300 26700 2831 89565 24712
Majalta 26664 9525 42900 17500 4070 100659 11703
TOTAL 220919 81284 260900 172800 37645 762497 166911
Source: Livestock Census /Animal/Sheep Husbandry Deptt.
Note: - Tehsil wise Data for the year 2018-19 not available
VII – Livestock and Veterinary Table 7.02
Livestock Population (In Lacs)
Year
Cattle Buffalo
Male Female Young
Stock Total Male Female Young
Stock Total 2013-14 0.757 0.976 0.475 2.21 0.057 0.570 0.226 0.813 2014-15 0.757 0.976 0.475 2.21 0.057 0.529 0.226 0.813
2015-16 0.757 0.979 0.476 2.209 0.058 0.529 0.226 0.813
2016-17 0.757 0.976 0.476 2.209 0.058 0.529 0.226 0.813 2017-18 0.930 1.190 0.470 2.590 0.120 0.690 0.230 1.040 2018-19 0.930 1.190 0.470 2.590 0.120 0.690 0.230 1.040
Source: Livestock Census /Animal/Sheep Husbandry Deptt.
VII - Livestock and Veterinary Table 7.03
Natural coverings Insemination & Birth recorded under Cattle Development Programme (Lac.No.)
Year
Natural Coverings Cows/Buffalos
Insemination done
Birth Recorded Cows/Buffalos
No. of Animals Castrated
1 2 3 4 5
2012-13 0.015 0.293 0.107 0.196
2013-14 0.015 0.305 0.105 0.075
2014-15 0.012 0.322 0.105 0.062
2015-16 0.014 0.34 0.116 0.07
2016-17 0.014 0.27 0.104 0.07
2017-18 0.008 0.27 0.09 0.05
2018-19 0.004 0.256 0.093 NA
Source: Animal Husbandry Department