This is to certify that the thesis entitled "Design & Fabrication of an Experimental Set-up for Susceptibility Measurement" submitted by Rakhee Sharma in partial fulfillment of the requirements for the award of the degree of Master of Science in Physics at the National Institute of Technology, Rourkela is an authentic work done by her under our supervision. To the best of my knowledge, the question in this thesis has not been submitted by any other university/institute for the award of any degree or diploma. Prakash Nath Vishwakarma, Faculty Member of NIT, Rourkela, and this project work has not formed the basis for the award of any degree or diploma/associate-ship/fellowship and similar project, if any.
I sincerely thank him for his valued encouragement from the beginning to the end of the project. I thank Miss Sanghamitra Acharya for her support and also all PhD students related in completing my work. I am grateful to the Department of Metallurgy for letting me use their XRD characterization technique.
I would especially like to thank my friends who encouraged me in any way to complete my work.
INTRODUCTION 1-13
Susceptibility Measurements 6
The basic principle on which this method is based is the flux change in the search coil when the sample is removed (or withdrawn) from the coil, or when the sample and search coil together are withdrawn from the field [1]. It is based on the flux change in a coil when a magnetized sample is vibrated near it [3]. The oscillating magnetic field of the moving sample induces an alternating emf in the detection coils, the magnitude of which is proportional to the sample's magnetic moment.
Note that the VSM measures the magnetic moment 'm' of the sample, and thus the magnetization M, while the fluxmeter method usually measures the flux density B. The VSM is very versatile and sensitive. If the vibration frequency is tuned to a resonance frequency of the system, the vibration amplitude increases by a factor equal to the quality factor Q of the vibrating system. Piezoelectric crystal is used to generate a voltage proportional to the vibration amplitude, which in turn is proportional to the sample moment.
It is of such high sensitivity that in a working instrument the magnetic field is held precisely constant by a superconducting shield and the sample moves slowly through a superconducting coil attached to the squid while the flux quanta are counted.
Difference between ac and dc susceptibility. 10
A detection coil is used to detect the change in magnetic flux due to the change in magnetic moment of the sample. Since the applied magnetic field is constant, there will be no signal associated with Hdc (Faraday's law). The sample flux connected to the detection coil is made to change by moving/vibrating the sample.
Although the principle behind both the dc magnetometer and the ac susceptometer is the detection of magnetic flux, the main difference lies in how the change in flux is achieved. The flux produced by the sample placed inside a detection coil is sensed by the detection coil. The detection circuit is generally balanced with a second, identical but counter-winding coil to cancel the flux changes associated with Hac.
Consequently, any experimentally detected change in current is only due to the sample's changing magnetic moment (dm) as it responds to the alternating field (no movement of the sample is required to generate the output signal) and not the moment itself as in the DC technique. Thus, AC susceptibility is actually the slope (dM/dH) of the magnetization curve (M vs. H curve). The alternating current technique detects changes in magnetization that lead to dM/dH in the limit of small alternating fields, so it is sometimes called differential sensitivity.
In the DC measurement, the magnetic moment of the sample does not change with time. In a VSM, an AC output signal is detected, but this signal arises from the periodic motion of the sample and is not representative of the AC response of the sample itself. In the AC measurement, the moment of the sample actually changes in response to an applied AC field, allowing the dynamics of the magnetic system to be studied.
Since the actual response of the sample to an applied alternating current field is measured, the magnetodynamics can be studied via the complex sensitivity (′+i′′). The real component ′ is associated with dispersive magnetic response and the imaginary component ′′ is associated with absorbing components arising from energy dissipation in the sample.
Why ac susceptibility? 12
The Meissner effect is considered a fingerprint in superconductivity, but whether it is a surface or bulk phenomenon can only be determined by AC susceptibility measurements. Furthermore, the presence of multiple TCs, the line of irreversibility, critical current density, intergranular and intragranular contribution has also been studied by AC sensitivity [7]. The various applications of AC sensing have installed a motivation to design and fabricate an AC susceptometer.
DESIGN AND FABRICATION OF SETUP 14-20
- Introduction to our setup. 15
- Design 1. 15
- Design 2. 17
- Calculations. 19
The pickup and reference coils are connected to the differential input of a computer controlled lock-in amplifier used as an off-balance and linked to the computer with a standard and a serial interface. It is good to cover both the sample and the thermocouple with a thin layer of vacuum grease, which ensures good thermal contact. Youssif et al. discuss the details behind the measurement principle and the way to extract the sample sensitivity from the experimental data, taking into account demagnetizing factors [8].
The secondary coil can be placed inside the primary coil and the primary coil can also be placed inside the secondary coil. The design of our setup is based on the previous concept because we wanted the secondary coil to be close to the sample for higher induction. Figure 2.1 shows the schematic cross-sectional design of the primary coil, the secondary coil and the sample holder.
Here we made a special sample holder, as we wanted to wrap a small heating wire so that the temperature of the sample can vary locally. The secondary coil is a two-winding system and the winding area is separated by a distance of 4 mm. A Pt100 temperature sensor is also inserted inside the sample holder, in contact with the sample, for recording the local temperature.
Figure-2.2 shows the dimension (in mm) of primary, secondary coil and sample holder. The change in flux due to the sample is picked up by the secondary coil surrounding the sample and the resulting voltage induced in the coil is detected. The sample (pellet form which is cut cylindrically) was rolled on Teflon tape and placed inside the secondary coil.
Great care has been taken in the miniaturization of the instrument to achieve high sensitivity. Figure 2.5 shows the primary and secondary (after winding) according to the second design. Figure 2.4 shows the schematic diagram of the second design.
SAMPLE PREPARATION 21-29
Review of synthesis techniques. 27
Experiment. 28
Co(NO3)2.6H2O is re-dissolved in 25 ml of distilled water, a brick-red (pink) colored solution is obtained. We took a 500 ml beaker and added a measured amount of glycine to it. Then both precursor solutions were poured into it and a magnetic stirrer was kept in it. The beaker was then held on a magnetic heater and the excess water was allowed to evaporate.
After cooling, the sample was collected from the oven and ground again in the agate mortar. The sample was then granulated in the hydraulic press and then sintered for 5 hours at 8250C.
Flowchart. 29
The structural characterization of the as-prepared cobalt ferrite was carried out by X-ray diffraction (XRD) technique, the scanning range was 200 to 800, and the formation of a well-defined single-phase spinel structure was confirmed.
RESULTS AND DISCUSSION 30-34
High Temperature Measurement. 31
The two terminals of the secondary coil are connected to the input of the lock-in amplifier and. The temperature sensor which was placed in a hole in the setup was connected to a multimeter. To measure the sensitivity to high temperature, the entire installation was placed inside an oven and idle work was performed.
This cut pattern was then wrapped in Teflon tape to the desired thickness so that it penetrated the secondary coil tightly. The pattern is set to be in the middle of the outer secondary coil. To get the sample readings, we subtracted both the readings viz. with pattern and without pattern.
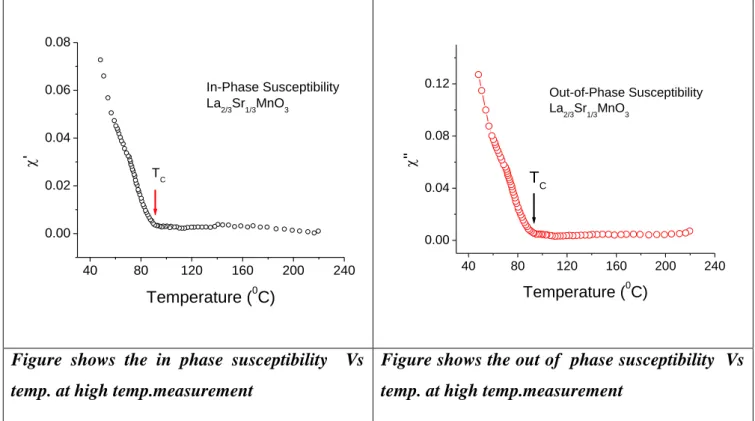
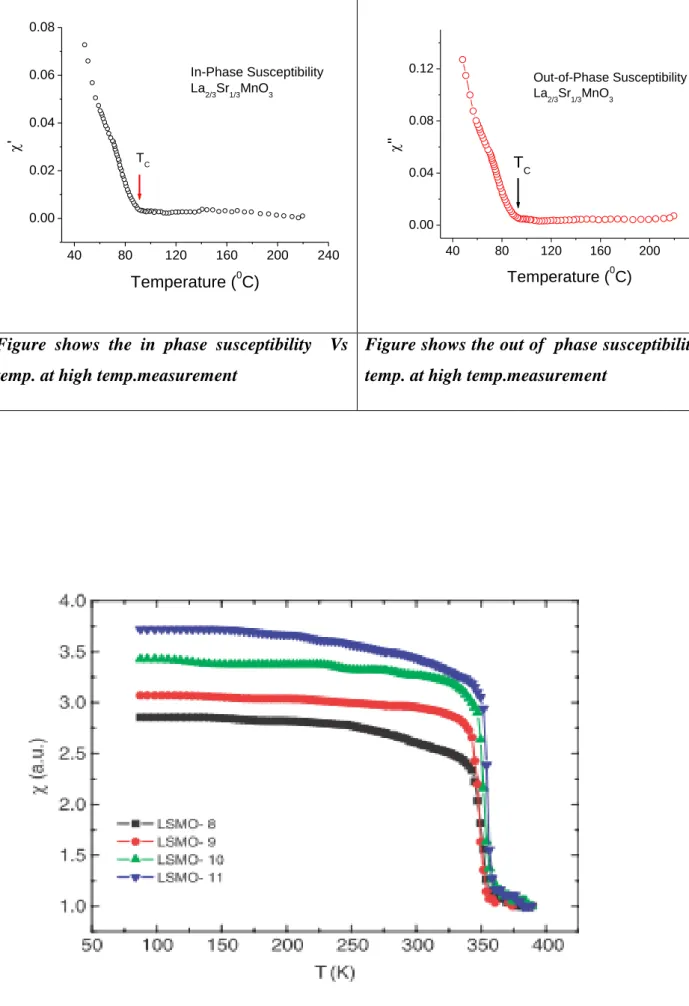
The inclusion amplifier gave the in phase and out of phase voltages Vx and Vy. To convert this into susceptibility, it was divided by V0 [25]. Plot of susceptibility (real part χ' and imaginary part χ”) Versus Temperature was done using standard software “Origin”. The standard graph of χ‟ with temperature is given in figure below. The transition temperature of CFO is very high around 793 K, so the transition is not shown here. The figure shows decreasing trend of susceptibility with temperature. This nature is very well shown in our case.
The device was designed in such a way that it consisted of three parts, viz. primary coils, secondary coils and sample holders. In the high temperature measurement, when the sample was inserted into the furnace, it melted. Instead, the sample was placed in the secondary coil so that there is a high inductance.
After all the installation connections are made with the lock-in amplifier and the multimeter, the measurement is done. The plotted graphs matched the standard very well, indicating that our setup was working correctly. A detailed example of CoFe2O4 is discussed in this thesis, and a detailed discussion of LSMO can be found in Debjana Banerjee's thesis.
A graph of sensitivity and temperature measurement at high temperature is given on the next page.
CONCLUSION 35
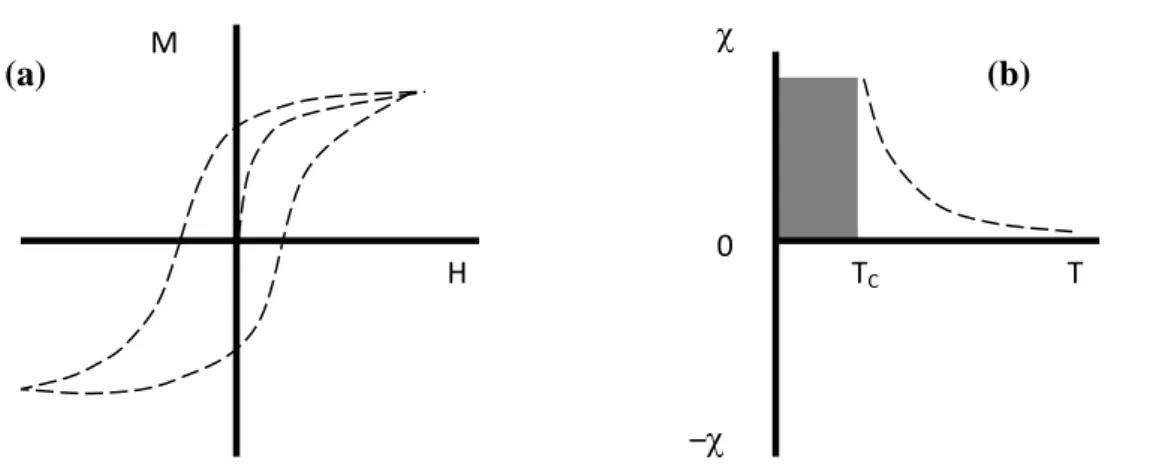
![Figure 1.5 shows the (a) M-H loop and (b) M-T response of ferrimagnetic material. Below Neel temperature(T N ) the material is antiferromagnetic and above T N it is paramagnetic.[2]](https://thumb-ap.123doks.com/thumbv2/azpdfnet/10558310.0/12.892.162.707.221.453/figure-response-ferrimagnetic-material-temperature-material-antiferromagnetic-paramagnetic.webp)