Introduction and Literature Review 1
Introduction 3
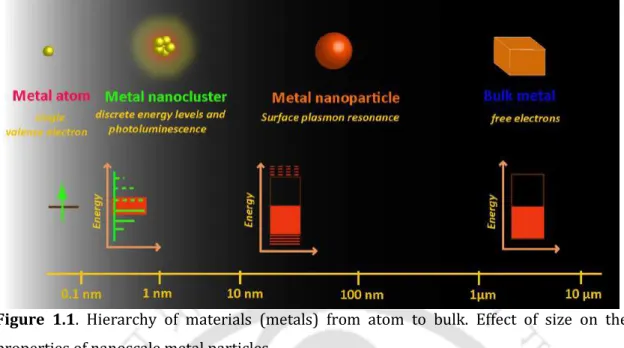
The term "nano" refers to matter in the scale regime - that is one billionth of a meter. They fall in the size scale between the individual atoms and their corresponding bulk dimensions.
Nanoscale Metal Particles and their Properties 3
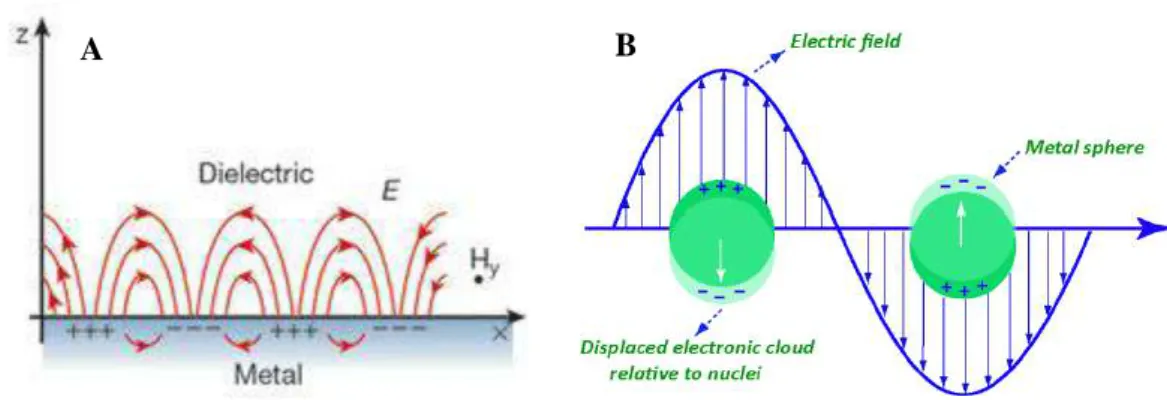
This results in an optical extinction peak at a wavelength corresponding to the frequency of plasmon oscillations.8,10 Among all, coin metal NPs - gold (Au), silver (Ag) and copper (Cu) - are the most studied due to the appearance of their surface plasmon oscillation in the visible area of the electromagnetic spectrum, which therefore gives them a characteristic color.3. So far, phenomenal progress has been made in the studies of Au and Ag NCs, and increasing interest has also been documented in the studies of Cu NCs recently.
Higher Ordered Assembly of Nanoscale Metal Particles 12
One of the important features observed in the ensemble of inorganic fluorophores (metal nanoclusters and semiconductor NPs) is that they become highly excited. The excitonic particles within a distance of 5 nm from the surface can interact electronically with the surface.
Reaction Kinetics and Dynamics of Higher Ordered Assembly 21
One of the salient features of plasmonic particles and their assemblies is that they support SERS. Therefore, we have attempted to address the above issues through the experiments carried out and therefore their results in the next chapter of the thesis.
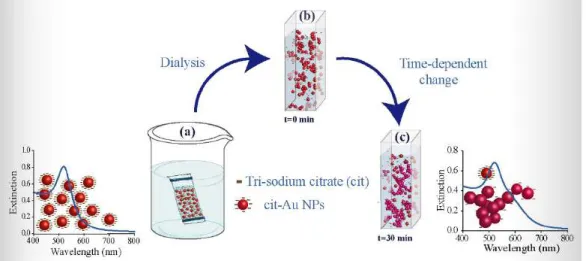
The kinetics of the reaction was then examined by monitoring time-dependent changes in the visible extinction spectrum. Figure 2.2 shows a schematic representation of the dialysis process and the reaction of the dialyzed Cit-Au NPs.
Kinetics of Reaction of Gold Nanoparticles Following Partial
Introduction 35
However, although complete removal may not be possible, partial removal of stabilizers may provide sufficient stability (and thus instability) for studying NP reaction kinetics. There are reports where dialysis of prepared nanomaterials has been performed to remove excess ligands and free ions from the medium.12-13 However, to our knowledge, there is no literature on the use of dialysis to prepare initial reaction conditions involving NP- of bare and reactive gold to study the kinetics of the reaction in liquid medium.
Outline of the Present Work 36
Experimental Section 36
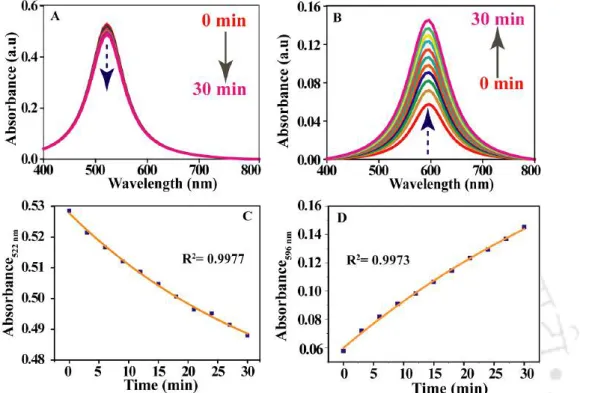
The formation of Cit-Au NPs was confirmed by recording UV-vis spectrum and TEM analysis. The initial velocity values corresponding to six different concentrations of Cit-Au NPs were calculated from the slope (obtained from the first four data points) of the graph of Ext.
Characterization 38
By the time of experimental spectra and from the plot of Absorbance By the time of the primary developed band. Rate constant values were obtained from the slope of the integrated rate comparison plot i.e. ln(Ext.) vs Time and ln[A] vs t as well as from the differential rate comparison plot ie. ln (rate) vs ln (Ext. )0 and ln (rate) vs ln[A]0 corresponding to six different concentrations of Cit-Au NP dialyzed.
Results and Discussions 39
Therefore, the agglomeration of the NPs and the resulting change in the UV-visibility spectrum was due to the depletion of citrate. The reaction followed the first order law with respect to the concentration of the monomeric NPs.
![Figure 2.1. (A) Representative TEM image of as-synthesized Cit-Au NPs, (B) particle size histogram as calculated based on the TEM image, (C) Surface plasmon resonance (SPR) extinction spectra of as-synthesized Cit Au NP (with [Au NP] ~0.62 nM) dispers](https://thumb-ap.123doks.com/thumbv2/azpdfnet/10448469.0/49.892.118.738.217.542/representative-synthesized-particle-histogram-calculated-resonance-extinction-synthesized.webp)
Conclusion 53
The Effect of Temperature on the Aggregation Kinetics of Partially
Introduction 59
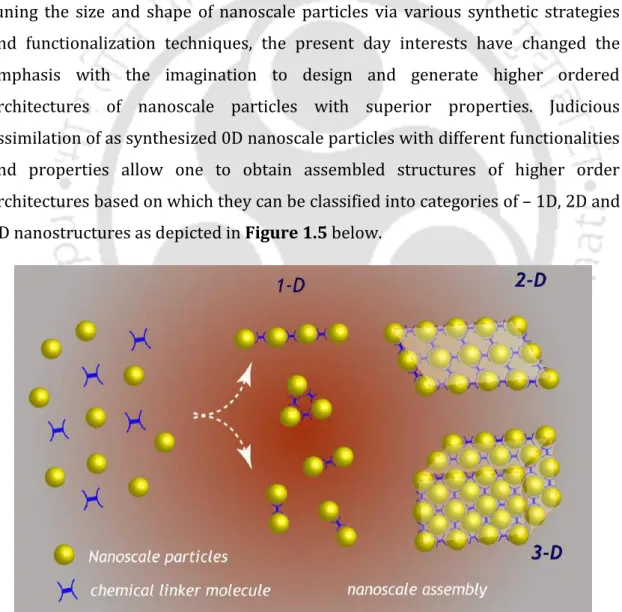
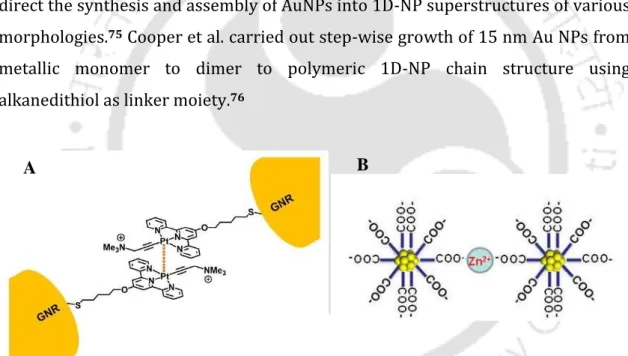
Systematic organization of nanoscale particles in well-defined geometries, based on the principle of synthetic chemistry,1 has primarily been a challenge. Recent efforts to study the growth of particles at the nanoscale are based on two hypotheses: Ostwald ripening (OR), where larger particles are grown at the expense of smaller particles, and oriented attachment (OA), where two identical crystal lattice planes of the reacting NP' are come into contact with each other, leading to the formation of a larger particle via fusion at the contact planes.18-19 While the mechanism of particle fusion or attachment has attracted considerable attention, the future of the field may lie in improved understanding of the kinetics, dynamics and also the thermodynamics of reaction of NPs.
Outline of the Present Work 60
We recently reported the dominance of first-order kinetics in aggregation reaction of partially bare Au NPs - obtained after dialysis of as-synthesized citrate-stabilized Au NPs (Cit-Au NPs)24 where the rate law was established based on a proposed model.
Experimental Section 60
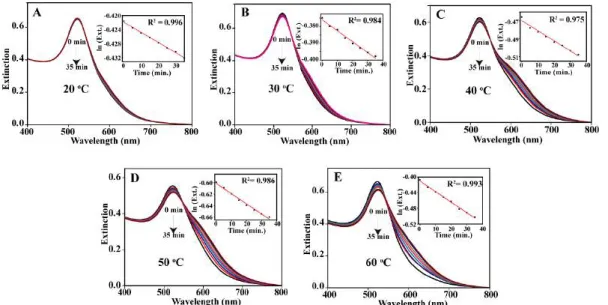
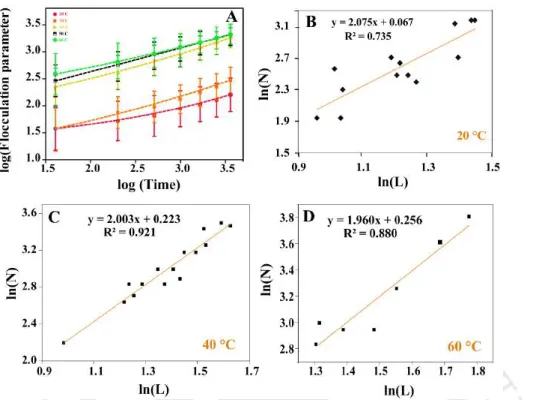
A time-dependent kinetic study of the reaction of partially bare Au NPs at five different temperatures. The time-dependent extinction spectra obtained for all four concentrations of Au NPs (i.e., 1.59 nM, 1.19 nM, 0.78 nM, 0.51 nM) at five different temperatures were deconvolved into three-component spectra—the first deconvolved band represented the spectrum due to background scattering (dotted green curve), the second represented the primary deconvoluted band (blue curve), and the third represented the secondary deconvoluted band (pink curve) (see Fig. A3.3, Appendix). Calculation of the flocculation parameter for the reaction of partially bare Au NPs at five different temperatures.
Characterization 65
Thus, the total amount of citrate present in the Au NP dispersion after dialysis was obtained by considering the amount of citrate initially present before dialysis. Then, the concentration of all citrate species in the dialyzed Au NP dispersion was determined from the calculated total citrate concentration after dialysis. The concentrations of sodium ions in the samples were determined using an atomic absorption spectrometer (Varian, AA240, The Netherlands).
Results and Discussions 66
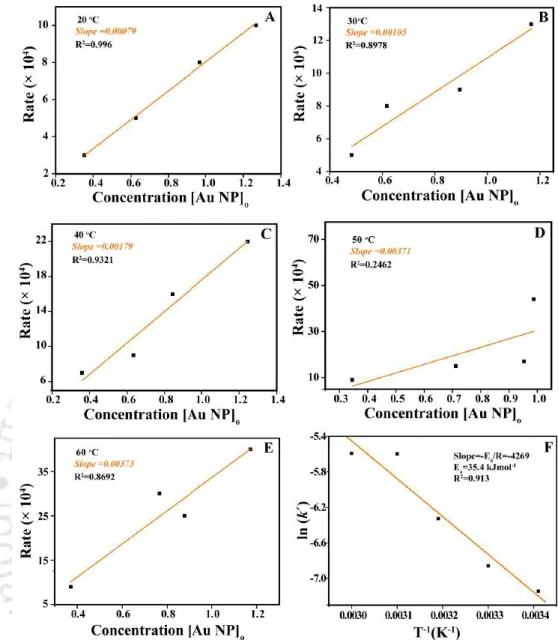
The changes in the UV-vis spectra indicated reactions of individual NPs which led to the increase in the concentration of the aggregated products. The activation energy, Ea of the reaction was calculated from the slope (negative), which resulted in a value of kJmol-1. Data points were fitted to linear function to obtain activation energy from the slope of the linear fit.
Conclusion 82
Schematic representation of the whole aggregation reaction of partially bare Cit Au NPs. I) diffusion of partially bare Cit-Au NPs obtained after dialysis, (II) desorption of citrate from the surface (crystallographic planes) of Au NPs (rate-determining step), (III) reorientation and favorable rotation of NPs to achieve proper crystallographic agreement at the interface (IV) leading to coalescence. The reaction is therefore limited by the citrate desorption step, which represents the highest activated state in a whole series of plausible steps (such as NP diffusion, relative NP orientation, desorption of adsorbed species, rotation to planar alignment, self-diffusion of Au adatoms towards the attachment site and surface relaxation), which take place after dialysis of Cit-Au-NPs, resulting in the coalescence of partially bare Au NPs. Therefore, the experimentally observed activation barrier of 36.2 ± 3 kJ mol-1 can be explained as arising solely from the desorption of the citrate anion from the Au NP surface, which limits the overall reaction and is therefore called the rate-determining step.
The synthesized Cu NCs obtained at pH=4.5 were further treated with 1.0 M NaOH to gradually increase the pH of the environment to 7.4. Next, the pH response of the NC probe in two different cellular environments (pH 4.5 and 7.4) was investigated. Time-dependent change in the PL spectrum of (A) as-synthesized CuNCs alone; as CuNCs synthesized in the presence of (B) BSA and (C) lysozyme when the pH of the dispersion was maintained at pH 7.4 and monitored for 240 min (λex = 365 nm).
Introduction 89
In principle, chemical bond information at single-molecule resolution should be obtainable using SERS. In practice, however, the best spatial resolution that can be achieved depends on the diffraction-limited laser focus size. In that regard, tip-enhanced Raman spectroscopy (TERS) offers a more convenient approach, utilizing the concept of SERS in combination with scanning probe microscopy (SPM) imaging to obtain structural and Raman spectral information at nanometric scale spatial resolution . Based on this, it could be concluded that if the induced plasmon at the tip could be combined with plasmon enhancement at the hotspot due to dimeric or oligomeric metal NPs, the signal intensity enhancement could be the highest.9.
Outline of the Present Work 90
Experimental Section 90
This was followed by repeated washing of the slides with Milli-Q water, which were then dried in an oven at 60 °C for further use. The as-synthesized Au nanodimer dispersion (~8 μL) was drop-cast onto a pre-cleaned silicon substrate and then allowed to dry overnight. Sample preparation: To prepare the STM-TERS sample, 8 μl of the as-synthesized Au nanodimer dispersion was dropped onto a carbon-coated copper TEM grid, which was then allowed to dry overnight.
Characterization 94
Imaging condition: STM-TERS operation was performed by turning on the etched gold tip at a set current of 1.0 nA and a bias voltage of 0.5 V. For TERS acquisition, the 632.8 nm laser was aligned with the tip of the gold tip and the spectral acquisition was recorded with filter ND = 25% with an acquisition time of 20 s.
Results and Discussions 95
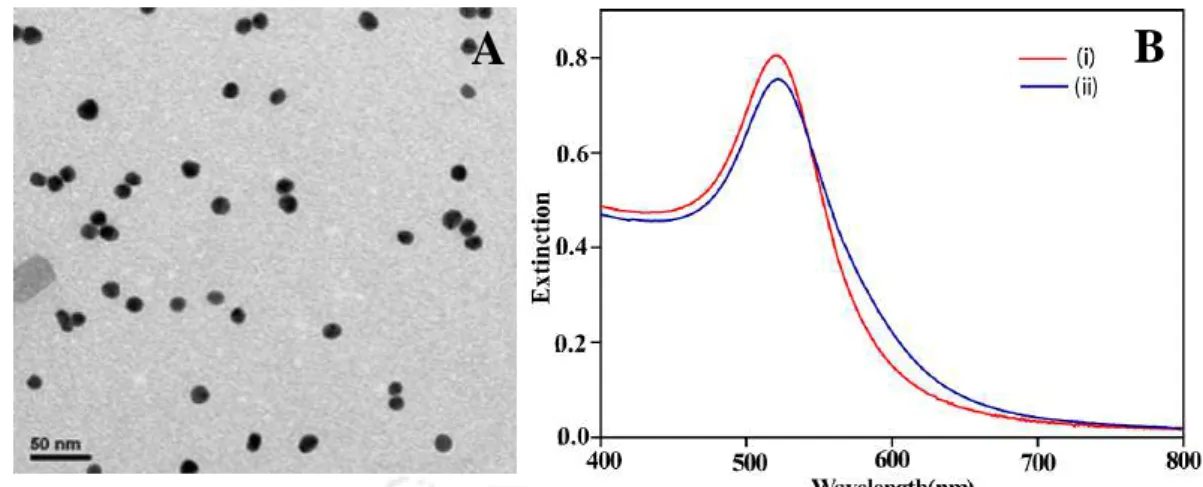
Selective dimerization resulted in a 5 nm red shift of the extinction band with a peak centered at 525 nm along with a broadening in the 580–600 nm region as shown in Figure 4.4.A(ii), which is in good agreement with the previous literature report. The dimer gap calculated17 from the high-resolution (HR)-TEM image of a representative Au nanodimer shown in Figure 4.4.E was found to be 0.95±0.06 nm, which is close to the theoretically calculated S⋯S distance of 1.006 . nm in space (using "Avogadro") of the synthesized metal complex (Figure 4.1.B). Interestingly, the SERS spectrum of the Eu_complex in the Au nanodimer was dominated by two strong bands (Figure 4.6.A(ii), green peak) due to the stretching of the aromatic ring at 1078 cm-1 and 1588 cm-1, respectively, when the excitation source was set to 632.8 nm.
![Figure 4.2. 1 H-NMR (400 MHz) spectra of [Eu (phen) 2 (MBA) 2 ]Cl in CDCl 3 . The peak in the range 7-9.5 ppm corresponds to the aromatic protons](https://thumb-ap.123doks.com/thumbv2/azpdfnet/10448469.0/102.892.133.727.519.912/figure-nmr-spectra-cdcl-range-corresponds-aromatic-protons.webp)
Conclusion 107
Moreover, in this case, a redistribution of the hot spot can occur in the presence of the tip, since the interaction between the field generated by the tip and the individual nanoparticle can also become part of the system (see Fig. A4.7, Appendix). Thus, hot spot enhancement in the presence of a tip would be more complex than a simple interaction between the field generated by the tip and the molecular bond. Thus, the availability of a selected metal based on the probe molecule to be studied at the hot spot may provide us with a new platform to study the complex chemistry within it.
Calculation of SERS and TERS Enhancement Factor 108
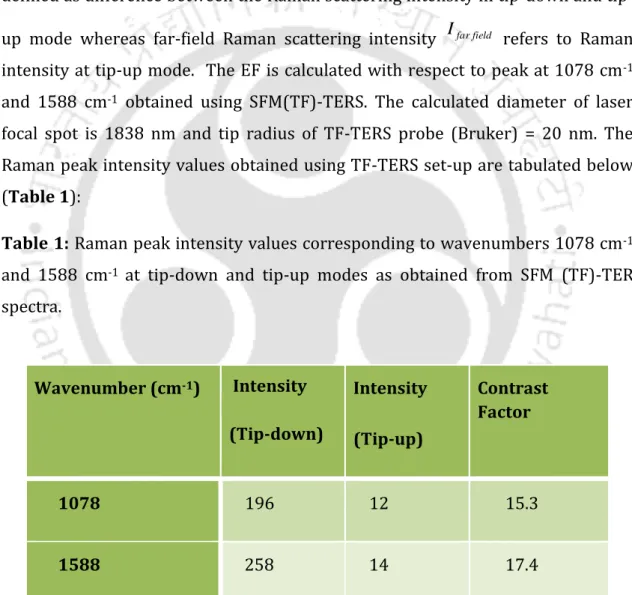
The percent yield of dimer, trimer, and tetramer obtained after reaction of Cit-Au NP dispersion with Eu complex in the reaction mixture was found to be 0.28%, respectively. Number of complex molecules in 5 ml reaction volume that form dimer = Number of dimer in 5 ml reaction volume. Therefore, the Raman scattering intensity in the near field Inearfield is defined as the difference between the Raman scattering intensity in the tip-down and the tip-up mode, while the Raman scattering intensity in the far field Ifarfield refers to the Raman intensity in tip-up mode.
To study the AIE kinetics in the respective cell lines, the culture medium of the treated cells at pH 4.5 was replaced with fresh culture medium (pH 7.4) after 1 h of incubation. Furthermore, the absence of an absorption band in the visible region (Figure 5.2.C) excluded the possibility of the formation of Cu nanoparticles in the dispersion. The results showed that more than 80% of the cells were viable in the presence of maximum (with respect to copper) in both HEK-293 (Figure 5.7.A) and MCF-7 (Figure 5.7.B) cells after 24 hours therapy .
Probing Cancer Cells through Intracellular Aggregation Induced
- Introduction 117
- Outline of the Present Work 118
- Experimental Section 118
- Characterization 124
- Results and Discussion 125
- Conclusion 140
- References 141
Biomimetically Crystallized Protease Resistant Zinc Phosphate
- Introduction 145
- Outline of the Present Work 146
- Experimental Section 146
- Characterization 151
- Results and Discussions 152
- Conclusion 165
- References 166
Thesis Summary and Future Prospects 169
- Summary of the Thesis 171
- Future Prospects 172