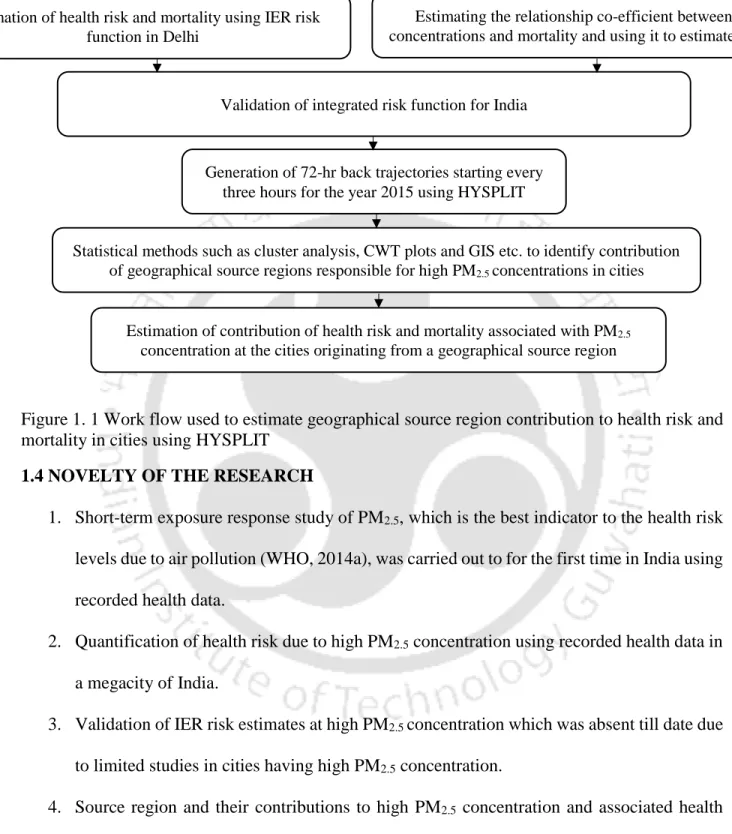
The HYSPLIT PM2.5 contribution from geographic source regions was combined with the IER risk function to estimate the source region contribution to PM2.5-related mortality. Cs PM2.5 concentration associated with trajectories passing through state s Ts Number of endpoints of trajectories passing through state s.
GENERAL
Guttikunda and Goel (2013) studied the health impacts of PM10 and PM2.5 in Delhi using the exposure response coefficients of R. The region of origin of high PM2.5 and associated risks is a crucial knowledge that can help authorities make an informed decision to be taken while formulating a mitigation policy.
RESEARCH OBJECTIVE
WORK PLAN
NOVELTY OF THE RESEARCH
ORGANIZATION OF THE THESIS
Previous studies have shown that China and India account for almost half of all premature deaths from air pollution (IEA, 2016). Due to China's unprecedented pollution crackdown, the number of deaths from ambient air pollution in India has overtaken China (Greenpeace, 2016).
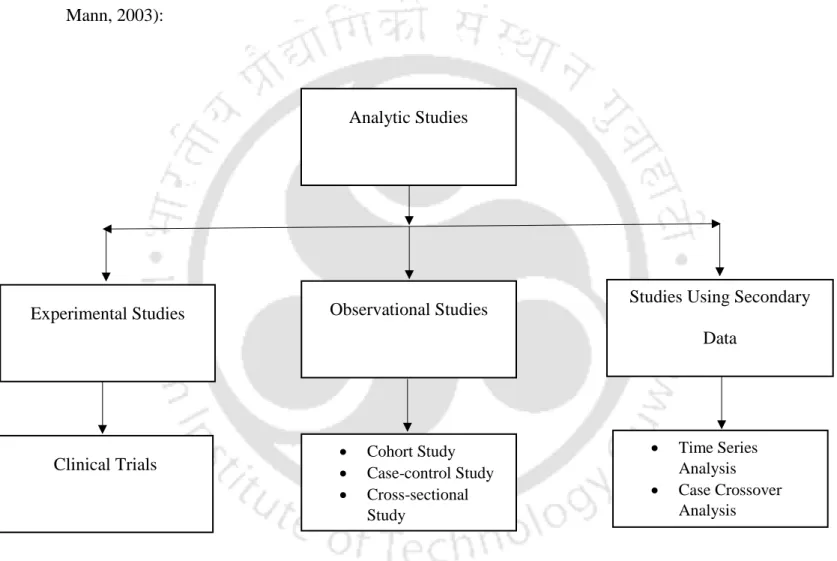
EPIDEMIOLOGICAL STUDIES
2011) conducted a time series analysis in Chennai and found that a 10 µg/m3 increase in daily PM10 concentration will result in a 0.44% increase in all-cause mortality. 2011) conducted a time series study in Delhi and found that a 10 µg/m3 increase in PM10 and NO2 concentrations will result in a 0.15% and 0.84% increase in all-cause mortality, respectively.
RISK FUNCTION TO ESTIMATE HEALTH RISK
2014) developed an integrated risk function (IER) as shown in equation (2.1) to estimate the health risks due to ischemic heart disease (IHD), stroke, chronic obstructive pulmonary disease (COPD) and lung cancer (LC) using relative risk information from epidemiological studies of long-term exposure to PM2.5 from AAP, SHS, AS and household air pollution (HAP). Two models in which risk increased as a linear function of PM2.5 concentration up to 30 µg/m3 in one while 50 µg/m3 in another were included in the sensitivity analysis.
REGION OF ORIGIN OF HIGH HEALTH RISK
Unfortunately, such studies are very rare in India: Marrapu et al. 2014) used WRF-Chem and analyzed the effectiveness of control measures taken during the Delhi Commonwealth Games. A dust storm in Patna was studied by Giri et al. 2016) conducted an assessment of gaseous pollutants over the NCR region of Delhi and used HYSPLIT to assess the origin of pollution.
SUMMARY
2015) used HYSPLIT to investigate potential regional and local sources contributing to PM2.5 concentrations in Delhi.
KNOWLEDGE GAPS
It also discusses risk functions used to estimate urban health risks without mortality data and their validation for Indian cities with high PM2.5 concentrations. Finally, the contribution of geographic source region to urban PM2.5 concentration is evaluated using HYSPLIT regression trajectories analysis, which, in conjunction with the risk function, will also estimate the mortality contributed by geographic source regions.
TIME SERIES EPIDEMIOLOGICAL STUDY IN DELHI
- Assumptions
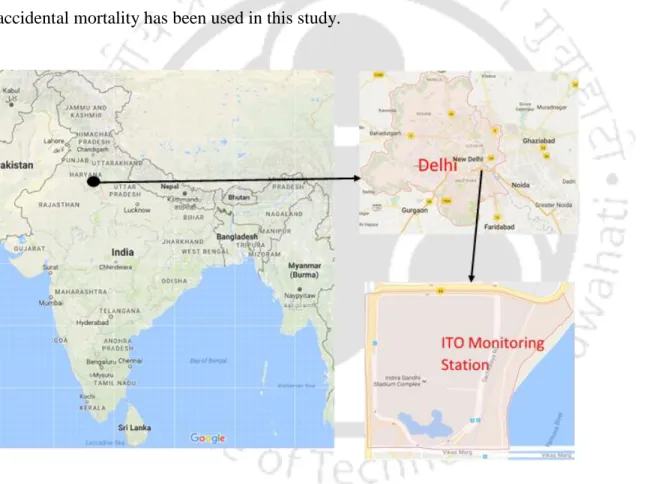
- Study area and data sources
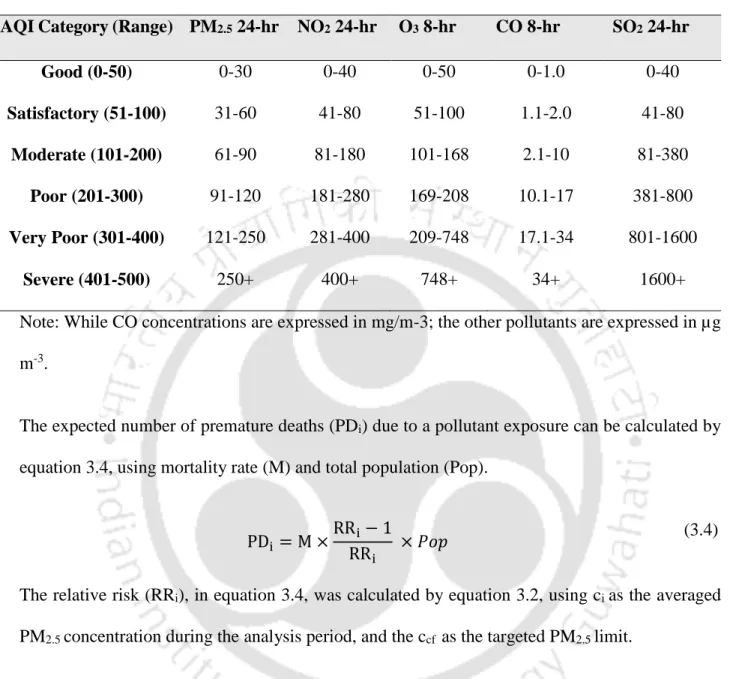
- Indian AQI
- Health risk estimation
The details about health risk study undertaken in Delhi city to quantify the effect of PM2.5 have been detailed in the present chapter. Hourly concentrations of CO, O3, NO2, SO2 and PM2.5 were collected by the Central Pollution Control Board (CPCB). The overall AQI can only be estimated if the concentrations of a minimum of three pollutants are available, with at least one of them being either PM2.5 or PM10.
According to the WHO (2005), adverse health effects can be expected for any concentration of PM2.5, O3, NO2 and SO2.
RISK FUNCTION TO ESTIMATE HEALTH RISK
- Assumptions
- Linearly increasing function
- Power function
- Integrated exposure response function (IER)
These functions are specific to the pollutant, so PM2.5 risk functions cannot be used to estimate health risk from exposure to PM10 concentrations or vice versa. The average daily inhaled dose is measured by multiplying the PM2.5 concentration by the average inhalation rate. The lung cancer exposure–response plot showed a monotonically increasing risk estimate with increasing PM2.5 concentrations as indicated in equation (3.6).
The function as given in equation (2.1) was based on information from previous studies showing that cardiovascular disease risk estimates increase rapidly at baseline and level off at higher PM2.5 concentration (C. A. Pope, 3rd et al., 2009), while for lung cancer, risk estimates increase monotonically with increasing PM2.5 concentration (C. A. Pope et al., 2011).
GEOGRAPHICAL SOURCE REGION CONTRIBUTION TO MORTALITY IN CITIES
- Assumptions
- Study area and data sources
- HYSPLIT back trajectory
- Cluster analysis
- IER model for risk estimation in Indian cities
- Health risk associated with trajectories
- Contribution to premature mortality in cities from states and neighbouring countries
As indicated in previous sections, the IER model performed better compared to the other existing models at high PM2.5 concentration. The health risk of runways reaching the study area was calculated corresponding to the median PM2.5 concentration of the runway. The health risk corresponding to a PM2.5 concentration is usually calculated using equations (3.2) and (3.3) as stated in previous sections.
Finally, the contribution of geographical source region to mortality due to PM2.5 in Indian cities is discussed.
TIME SERIES EPIDEMIOLOGICAL STUDY IN DELHI
- Seasonal, long term and effects of temperature on mortality
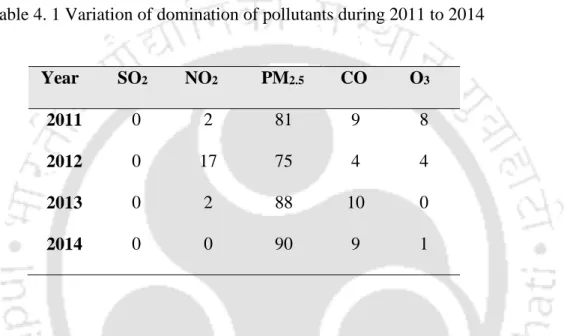
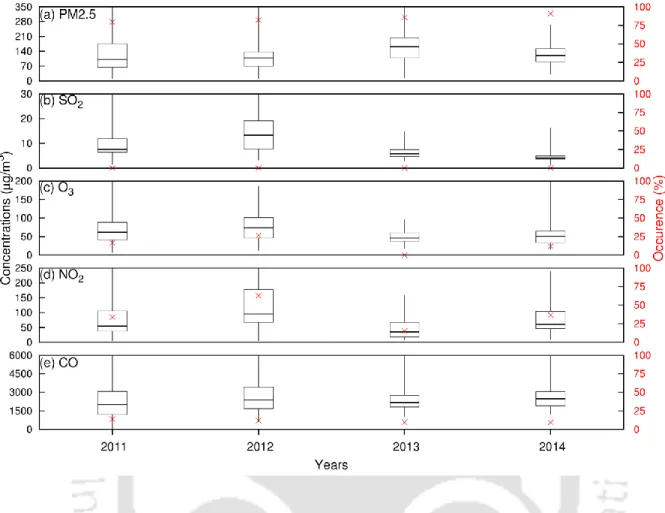
- Variation of pollutant concentration at the study site
- Variation of AQI over the years
- Health risk estimation
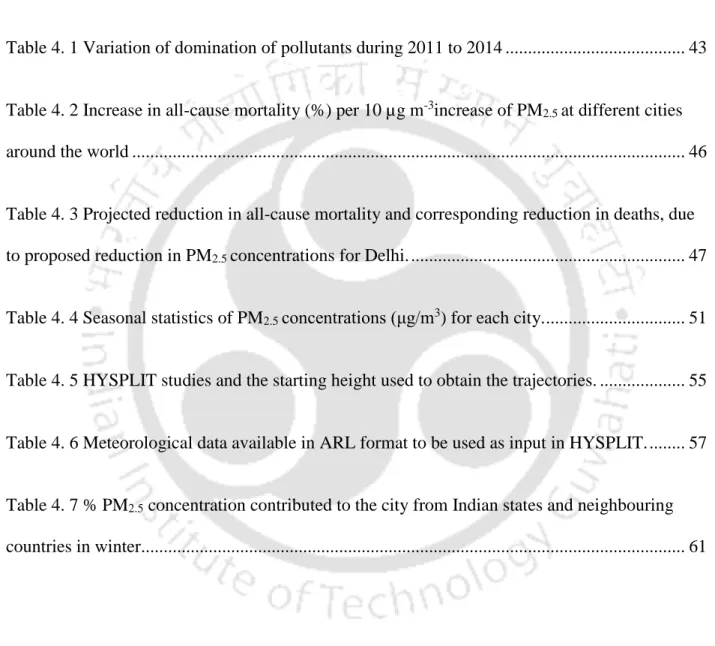
1 Time series of monthly average PM2.5 (µg m-3) and deaths on the left y-axis and temperature (̊C) on the right y-axis. 2 Increase in all-cause mortality (%) per 10 µg m-3 increase in PM2.5 in various cities around the world. The benefit of reducing PM2.5 concentration to INAAQS and WHO standards was estimated using equation 3.4.
3 Projected reduction in all-cause mortality and corresponding reduction in deaths due to proposed reduction in PM2.5 concentrations for Delhi.
RISK FUNCTION TO ESTIMATE HEALTH RISK
Validation of IER model for Indian cities
The middle bars reflect the mean estimate, while the upper and lower ones reflect the 97.5% and 2.5% confidence intervals (CI) in the case of IER estimates indicated in red, while the green ones are the estimates shown obtained using time series studies in Delhi and the upper and lower bars. the bottom bars herein indicate estimates obtained using a 95% CI of the risk coefficient. IER was found to predict 2.14% more mortality per 100,000 inhabitants than time series studies in Delhi.
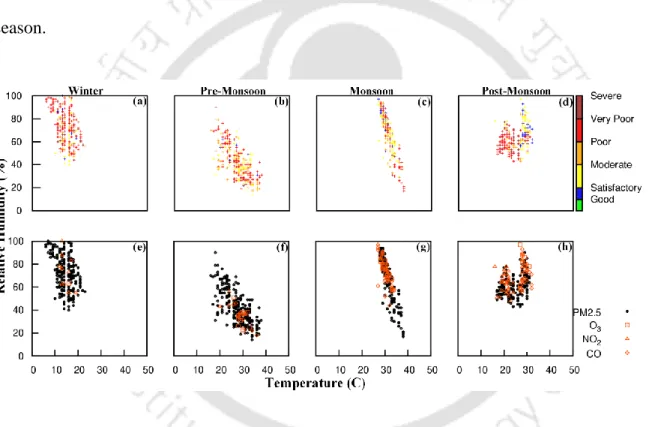
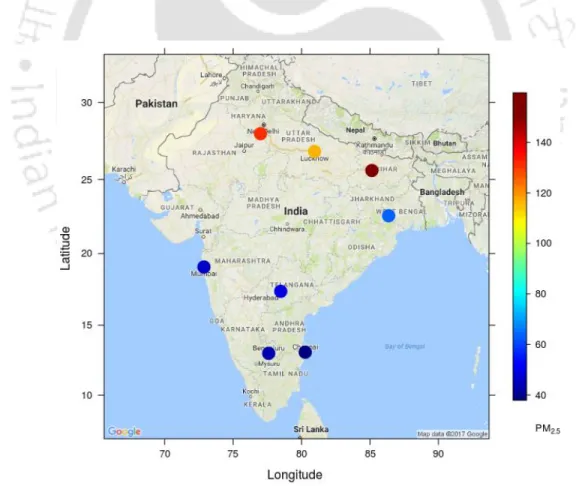
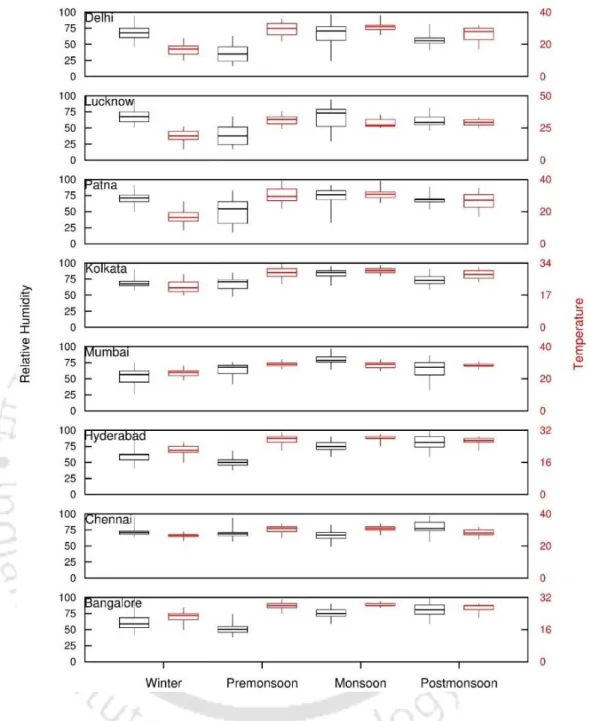
Variations of PM 2.5 and meteorological parameters in Indian cities
The horizontal lines in the box indicate the 25th, 50th, and 75th percentiles, while the whiskers indicate min and max values, with the left Y-axis representing RH values and the right Y-axis representing temperature. Heavily polluted hours in the winter and after the monsoon in the north, east, west and south were respectively and 64%.
Risk estimation in cities across India
The risk due to shocks in northern and eastern cities during winter and post-monsoon was observed to be 1.17 and 1.41 times higher than that in southern cities. Average risks in Delhi, Lucknow and Patna were observed to be similar during winter (COPD=1.60, LC=1.90, IHD=1.49, STROKE=2.15) across all diseases with Patna being the city experiencing the highest health risk during the same period. . Patna is observed to have higher risk during winter (1.01 times) and post monsoon (1.011 times) compared to Delhi while it is vice versa during monsoon and pre monsoon.
GEOGRAPHICAL SOURCE REGION CONTRIBUTION TO MORTALITY IN CITIES
Sensitivity of HYSPLIT back trajectories on model inputs
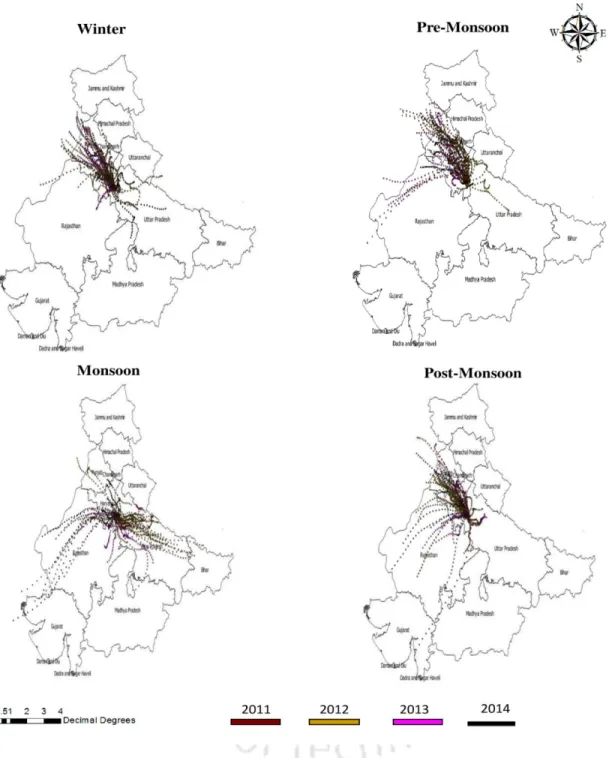
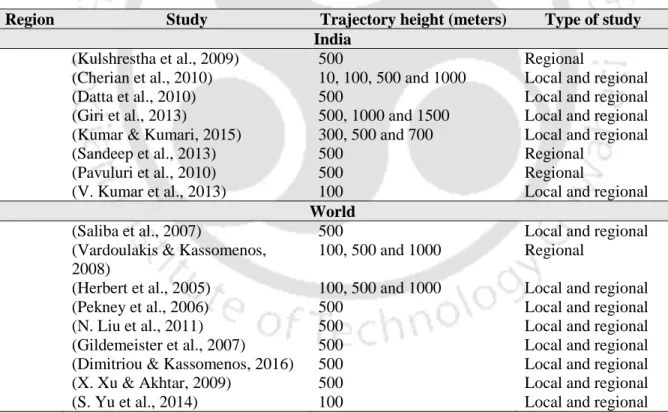
Since starting heights of trajectories are only provided at the beginning of the analysis, the selection of starting heights is usually done on the basis of previous studies. The CWT plots at 100, 500 and 1000 m are observed to be similar except for the spatial extent of the trajectories. This may be the reason why 500 m was chosen as the starting height by most of the studies in the past, as observed from Table 4.5.
Thus, although analysis was performed for all three trajectory heights, only results from 72 h back trajectory simulation with 500 m initial height are shown.
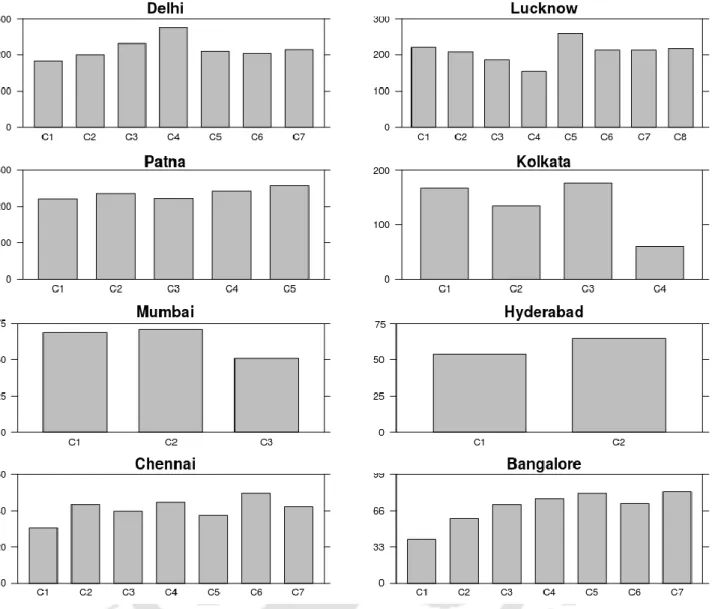
Trajectory cluster to identify its origin
Regardless of their region of origin, all trajectory clusters were associated with PM2.5 concentrations above 190 µg/m3. Uttar Pradesh contributed the most to PM2.5 concentration during winter (70%) and pre-monsoon (60.5%). During the post-monsoon period, short clusters covering Uttar Pradesh and Bihar were observed to be associated with PM2.5 concentrations above 120 µg/m3.
In Hyderabad, similar to Mumbai, no clusters in pre-monsoon and monsoon were associated with PM2.5 concentrations above 60 µg/m3.
Premature mortality contribution in cities from states and neighbouring countries
Uttar Pradesh contributed to 30% of the total premature deaths in Delhi, with 2653 premature deaths due to COPD, 2528 due to IHD, 3069 due to stroke and 181 due to lung cancer. Punjab and Haryana account for 33% of Delhi's total premature deaths due to high PM2.5. Meanwhile, high PM2.5 concentration from Pakistan resulted in 1043 premature deaths due to COPD, 994 due to IHD, 1207 due to stroke and 71 due to lung cancer.
Premature mortality in Lucknow was mainly caused by high PM2.5 concentration from Uttar Pradesh, which was responsible for 1604 deaths due to COPD, 1530 due to IHD, 1860 due to stroke and 109 due to lung cancer.
SUMMARY
Time series epidemiological study in Delhi
Major contribution of high PM2.5 concentration from Karnataka and Tamil Nadu led to 35% of the total premature deaths due to air pollution in Bangalore which was 1142 deaths due to COPD, 1478 due to IHD, 2076 due to stroke and 79 due to lungs included Cancer. Chennai was observed to be heavily affected by marine pollution from the Indian Ocean, which contributed to 99% of the total deaths due to air pollution, resulting in 1129 deaths due to COPD, 1743 due to IHD, 2260 as as a result of stroke and 77 as a result of lung cancer. Additionally, the Indian Ocean was observed to be a major contributor to premature deaths due to high PM2.5 concentration in all the cities in southern India, leading to 32% of premature deaths in Hyderabad and 54% in Bangalore.
Finally, the impact of reducing the current PM2.5 concentrations, the most dominant pollutant in New Delhi, was investigated.
Risk function to estimate health risk
Geographical source region contribution to mortality in cities
The current study estimates 94%, the coarse grid resolution of 2.5 degrees in the current study as opposed to the 4 km grid resolution in the TERI study could account for the overestimation of the regional contribution. Uttar Pradesh was observed to be a major contributor to premature mortality in Delhi, Lucknow and Patna, accounting for 30%, 71% and 42% of the total premature deaths due to high PM2.5. High concentrations of PM2.5 from West Bengal and Bangladesh were responsible for 52% of the total premature mortality in Kolkata.
The Indian Ocean was a major contributor to premature mortality due to PM2.5 concentration in the western and southern cities of Mumbai, Hyderabad, Bangalore and Chennai, accounting for 99% of total premature mortality in winter respectively.
GENERAL
MAJOR CONCLUSIONS
The integrated exposure risk function (IER) was found to slightly overpredict mortality in Delhi by 2.14% per 100,000 population compared to risk estimates obtained from the Delhi Epidemiological Time Series Study. Uttar Pradesh contributed the most to PM2.5 concentration and associated premature mortality during winter in Delhi (30%), Lucknow (71%) and Patna (42%). Chennai, Hyderabad and Bangalore are heavily influenced by marine sources in the three seasons (pre-monsoon, post-monsoon), with most of the pathways (at least 27%) from the Indian Ocean, and thus PM2.5 concentrations are lower compared to other cities. .
Reduction of both local and regional pollution is required to provide significant reduction in premature mortality due to PM2.5 concentration in all cities except Delhi and Lucknow where regional and local sources are dominant respectively.
FUTURE SCOPE
Short-term effect of fine particulate matter (PM2.5) and ozone on daily mortality in Lisbon, Portugal. INVESTIGATION OF URBAN AIR QUALITY WITH RESPECT TO FINE PARTICULAR MATTER (PM2.5) AND RESPIRAL PARTICULAR MATTER (PM10) IN LUCKNOW CITY, INDIA Journal of Environmental Research And Development, 11(2). In winter, local sources in the northeast and northwest were the main contributors to PM2.5 in Patna.
Distribution of PM2.5 concentrations (μg/m3) in each wind speed, wind direction bins for each city by monsoon. In the monsoon, the positive correlation between PM2.5 and wind speed (0.33) indicated that regional sources were dominant. Correlation of PM2.5 concentration with meteorology and other pollutants in each post-monsoon city.