MANUFACTURING IN THE PRESENCE OF UNCERTAINTIES
A Thesis Submitted in Partial Fulfillment of the Requirements for the Degree of
DOCTOR OF PHILOSOPHY
by
Faladrum Sharma (Roll No. 166103105)
Department of Mechanical Engineering Indian Institute of Technology Guwahati
Guwahati 781039 INDIA
January 2022
CERTIFICATE
It is certified that the work contained in the thesis entitled “Sustainability Assessment of Additive Manufacturing in the Presence of Uncertainties” is submitted by Mr. Faladrum Sharma to the Indian Institute of Technology Guwahati for the award of the degree of Doctor of Philosophy. The work has been carried out under my supervision in the Department of Mechanical Engineering, Indian Institute of Technology Guwahati. This work has not been submitted elsewhere for the award of any other degree or diploma.
Dr. Uday Shanker Dixit Professor
Department of Mechanical Engineering, Indian Institute of Technology Guwahati, Guwahati-781039, INDIA
Date: January 24, 2022
Indian Institute of Technology Guwahati, Guwahati-781039, INDIA
DECLARATION
I declare that,
a. The work contained in this thesis is original and has been done by me under the guidance of my supervisor.
b. The work has not been submitted to any other institute for any degree or diploma.
c. I have followed the guidelines provided by the institute in preparing the thesis.
d. I have confirmed the norms and guidelines given in the ethical code of conduct of the institute.
e. Whenever I used materials (data, theoretical analysis, figure and text) from other sources, I have given due credit to them by citing them in the text of the thesis and giving their detail in references.
Faladrum Sharma
Dedicated to Almighty GOD, My
Late Grandmother Mrs. Snehalata
Devi, My Teachers and My Parents
Acknowledgement
I am privileged to take this opportunity to express my respect towards all who have supported me during the tenure of my PhD programme at IIT Guwahati. The first person I would like to express my sincere gratefulness is my supervisor Prof. Uday Shanker Dixit.
I feel fortunate for getting the opportunity to work under him as a research scholar. His endless support, encouraging interactions and constructive criticism was a great driving force for me to carry out this research work.
I express my sincere gratitude to my doctoral committee members Prof. S.
Senthilvelan, Dr. Manas Das and Prof. Subhash Thota for their encouragement and suggestions throughout the study. I express my sincere thanks to the former and present heads of the Department of Mechanical Engineering, Prof. A.K. Das, Prof. S.K. Dwivedy, Prof. S. Senthilvelan and Prof. KSR Krishna Murthy. I would also like to thank the staff members of the Department office and Central Workshop for their support and cooperation.
A special thanks to Mr. Gwmchar Baro for helping me in carrying out experiments. Also, the financial support provided by the Ministry of Human Resource and Development (MHRD), India is greatly acknowledged.
I express my sincere thanks to my friends Dr. Besufekad Negash Fetene, Dr. W.G.
Jiru, Dr. Polash Pratim Dutta, Dr. Rajkumar Shufen, Dr. Vikash Kumar, Dr. Amit Raj, Mr.
Sujoy Tikader, Mr. Nitish Bhardwaj, Mr. Nilkamal Mahanta, Mr. Kaustabh Chatterjee, Mr.
Bappa Das, Mr. G. Safiur Rahiman, Mr. Bhanu Prakash Bonthala, Mr. Snehal Shende and Mr. Biswajeet Barman. Special thanks to all my Umiam hostel mates who made my stay enjoyable and memorable.
I am always indebted to my parents for generously encouraging me and providing moral support during every footstep of my life. My father Mr. Balindra Nath Sharma, my mother Mrs. Pranita Sharma and my sister Miss Susismita Sharma deserve my wholehearted thanks. I will be grateful to them for sharing every responsibility in my family during my PhD. Finally, I would like to express my special thanks to all those who have helped me in various ways directly and indirectly during the tenure of my Ph.D. work. I shall always be grateful to the entire fraternity of IIT Guwahati for their encouragement and wishes.
Faladrum Sharma IIT Guwahati
Abstract
Additive manufacturing (AM) has gained enormous attention in the present digital era of sustainable manufacturing. It is popularly known as 3D printing and is one of the foundations of the fourth industrial revolution, i.e., Industry 4.0. This technology has promising applications in several fields, viz., medical, aerospace, construction, automobiles and electronics. Despite the unique advantages offered by AM, there is a hesitation in purchasing a 3D printer and including it in the manufacturing route. Although it is adopted by some industries, its rate of adoption is not high as predicted in the past. One of the main reasons is the concern of sustainability. AM needs to be cost-effective as well as sustainable to compete with traditionally established manufacturing technologies.
The focus of the thesis is to explore the sustainability of AM in the presence of uncertainties. Cost analysis is carried out to assess its competitiveness with other manufacturing processes. For this, first, a cost estimation model is proposed. The cost estimation model is developed based on several elements, i.e., material, operator, slicing and overhead cost. One of the most important steps in cost analysis is to determine the build time. Hence, as a part of cost estimation, build time estimation models of two popular AM processes, viz., selective laser sintering (SLS) and fused deposition modelling (FDM) are developed. The analytical models are developed based on machine kinematics and geometrical parameters. For SLS, the model is validated with data available in the existing literature. For FDM, the model is validated by conducting in-house experiments.
In practice, the parameters are often uncertain and vary with management policies.
Hence, to take into account uncertainties, the deterministic cost model is converted into a fuzzy set-based cost model. For this, the uncertain quantities are treated as fuzzy variables and suitable arithmetic operations are performed. For simplicity, only linear triangular fuzzy members are used in this work for uncertain parameters. The low (l) and the high (h) estimates are assigned a membership grade of 0.5, whereas the most likely (m) estimate is assigned a membership grade of 1. The cost model is illustrated with examples. The cost of different parts fabricated by SLS and FDM are evaluated. First, the deterministic model is used to obtain the cost. The most dominating part in the cost estimation is the machine depreciation. It is a part of overhead cost. Later, based on fuzzy set-based theory, the fuzzy cost estimates are obtained. The fuzzy cost of the parts is obtained in the form of a triplet.
The working conditions of a typical Indian factory is considered. Based on the information
available in different internet sources and literature, cost parameters are quantified. The cost is obtained in Indian dollars. However, all the cost related elements are reported in dollar as it is considered a universal currency.
In the next part of cost analysis, SLS, a typical AM process is compared with injection moulding (IM) based on cost competitiveness considering the demand scenario.
A cost model for IM is developed based on the information available in literature. The cost of IM is obtained by the algebraic summation of material, mould and processing cost. For SLS, the cost remains almost constant irrespective of the number of quantities albeit with some fluctuations. The design time associated with the designer and the slicing cost gets reduced with the number of quantities of the part. The processing cost per quantity (when the part is fabricated inside the machine chamber) is dependent on the build time per quantity. On the other hand, for IM, the cost per quantity decreases with an increase in the number of quantities. The mould cost, the most dominating cost component and the processing cost are divided among the units of the product. Based on the results obtained, it is seen that for some situations, some estimates of a process are lower and some are higher in comparison to the other process. For this, the concept of fuzzy reliability is used. The reliability estimates at different values of fuzzy cost are obtained. Based on the reliability estimates, a favourable manufacturing process is chosen.
The next part of the work delivers guidelines to an organization for assessing the utilization of AM. For this, a parameter, called utilization factor (Uf) is proposed based on total production time and available time. Based on Uf, the proper use of 3D printing is evaluated. Uf is incorporated in the cost model to understand its impact on the production cost. Typical cases of under, proper and over utilization of a 3D printer are discussed. The effect of Uf on the production cost for fabricating the same product and two different products are discussed. To compare two manufacturing processes, the unit cost and total production time for injection moulding (IM) and 3D printing are evaluated. Membership grades for suitability are provided based on cost and time. Assigning membership grades is subjective and may vary from organization to organization. The ability of AM to produce a product digitally reduces the requirement of human labour. This may give rise to unemployment amongst the labourers. To address such societal issues, a quantitative method to evaluate the labour penalty cost due to the reduction in employment is presented.
For environmental sustainability, approach for the estimation of energy consumption is discussed. Every AM process follows a similar pattern of layer by layer manufacturing, but the working principle varies for different processes. Hence, energy
consumption also varies. The energy consumption models of SLS and FDM are described based on their working principle. The importance of different energy-consuming elements is described. The energy consumed for a single as well as multiple parts are evaluated. The results revealed that the mass and volume of a fabricated part give some indication about the energy consumption, but it also depends on part complexity. The energy consumption of the parts is used to estimate the energy cost and the amount of CO2 emission. The energy cost is estimated based on the values of energy consumption and electricity rate. For simplicity, it is taken as the cost of electricity. The amount of CO2 emission in kg is estimated on an annual basis.
Overall, the work content of this thesis contributes to the sustainability evaluation of additive manufacturing processes. As the first pillar of sustainability, cost analysis of AM is carried out in the presence of uncertainties. Necessary guidelines are provided for industries willing to adopt AM. In the context of environmental aspect, energy consumption models are proposed where the role of energy consuming elements of AM based machines is described. Some aspects of social sustainability of AM and its impact on the society is discussed.
Contents
Abstract ... vii
Contents ... xi
List of Figures ... xv
List of Tables ... xvii
Nomenclature ... xix
Chapter 1 ... 1
Introduction ... 1
1.1 Additive manufacturing... 1
1.2 Need for sustainability analysis of additive manufacturing ... 2
1.3 Scope and primary objective of the thesis ... 2
1.4 Organization of the thesis ... 2
Chapter 2 ... 5
Literature Survey and Detailed Objectives ... 5
2.1 Introduction ... 5
2.2 Economic sustainability of additive manufacturing ... 5
2.2.1 Build time estimation models of additive manufacturing ... 5
2.2.2 Cost estimation models of additive manufacturing ... 9
2.3 Environmental assessment of additive manufacturing ... 17
2.3.1 Energy estimation of additive manufacturing ... 18
2.4 Societal aspects of additive manufacturing ... 24
2.5 Necessary aspects for procuring Additive Manufacturing ... 27
2.5.1 Decision support system for procuring 3D Printing ... 28
2.5 Major gaps in literature ... 30
2.6 Objectives of the present thesis ... 30
Chapter 3 ... 35
Cost Estimation of Additive Manufacturing ... 35
3.1 Introduction ... 35
3.1.1 Selective laser sintering (SLS) ... 35
3.1.2 Fused deposition modelling (FDM) ... 36
3.2 Deterministic model for cost estimation ... 37
3.2.1 Build time estimation model for selective laser sintering ... 39
3.2.2 Build time estimation model for fused deposition modelling ... 45
3.2.3 Cost model ... 50
3.3 Implementation of fuzzy set theory for handling uncertainties... 52
3.4 Illustration of the methodology by examples ... 54
3.4.1 Cost estimation for SLS ... 54
3.4.2 Cost estimation for FDM ... 59
3.5 Conclusion ... 65
Chapter 4 ... 67
Cost Comparison of Additive Manufacturing with Traditional Manufacturing in the Presence of Uncertainties ... 67
4.1 Introduction ... 67
4.2 Cost estimation of injection moulding (IM) ... 68
4.2.1 Estimation of mould cost in injection moulding ... 68
4.2.2 Estimation of processing cost in injection moulding... 70
4.3 Methodology to compare two uncertain costs... 71
4.4 Illustration of the methodology by examples ... 74
4.4.1 Cost estimation of the parts by selective laser sintering ... 74
4.4.2 Cost estimation of the parts by injection moulding ... 75
4.4.3 Estimation of reliability of fuzzy cost ... 80
4.4.4 Comparison of two uncertain costs and choosing a favourable manufacturing process ... 81
4.5 Conclusion ... 84
Chapter 5 ... 85
An Analytical Method for Assessing the Proper Utilization of Additive Manufacturing ... 85
5.1 Introduction ... 85
5.2 Deterministic analysis of utility assessment for a process ... 85
5.2.1 Evaluation of utilization factor ... 86
5.2.2 Impact of utilization factor on cost ... 86
5.2.3 Scheduling issues ... 87
5.3 Incorporation of uncertainty in the analysis ... 88
5.4 Factors for comparing additive manufacturing with other processes ... 90
5.5 A quantitative method for evaluating the penalty due to reduction in employment 91 5.6 Illustration of the methodology by examples ... 92
5.6.1 Case of producing multiple quantities of a single part ... 92
5.6.2 Case of producing multiple quantities of different parts ... 95
5.6.3 Comparison of additive manufacturing with injection moulding ... 96
5.7 Conclusion ... 98
Chapter 6 ... 101
Energy Consumption in Additive Manufacturing ... 101
6.1 Introduction ... 101
6.2 Energy consumption model of selective laser sintering ... 102
6.2.1 Energy consumed by laser system ... 102
6.2.2 Energy consumed by heater system ... 102
6.2.3 Energy consumed by roller ... 103
6.2.4 Energy consumed by the movable platform ... 105
6.3 Energy consumption model of fused deposition modelling (FDM) ... 106
6.3.1 Energy consumed during melting of the filament ... 106
6.3.2 Energy consumed during extrusion ... 106
6.3.3 Energy consumed in heating the baseplate ... 109
6.3.4 Energy consumed by the movable platform ... 109
6.3.5 Miscellaneous energy consumptions ... 110
6.4 Illustration of the methodology by examples ... 110
6.4.1 Energy consumption calculation by selective laser sintering ... 110
6.4.2 Energy consumption calculation by fused deposition modelling ... 115
6.5 Overall sustainability analysis ... 119
6.6 Conclusion ... 120
Chapter 7 ... 123
Epilogue ... 123
7.1 Introduction ... 123
7.2 Cost estimation of additive manufacturing in the presence of uncertainties ... 123
7.3 Cost comparison of additive manufacturing with traditional manufacturing in the presence of uncertainties ... 124
7.4 An analytical approach for assessing the utility of additive manufacturing in an organisation ... 124
7.5 Energy estimation of additive manufacturing ... 125
7.6 Overall Conclusions ... 125
7.7 Scope for future work ... 126
References ... 129
Appendix A ... 141
Appendix B ... 143
Appendix C ... 145
Appendix D ... 147
Appendix E ... 149
Publications ... 151
List of Figures
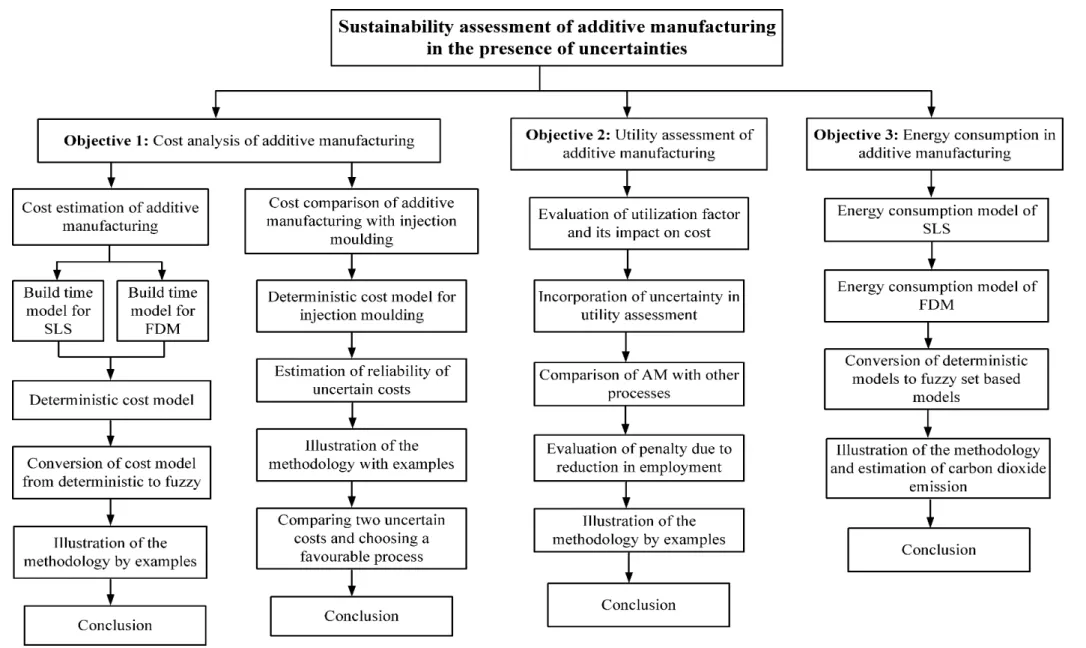
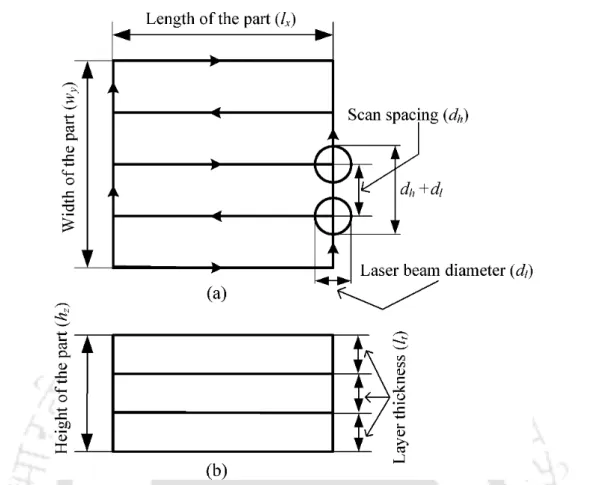
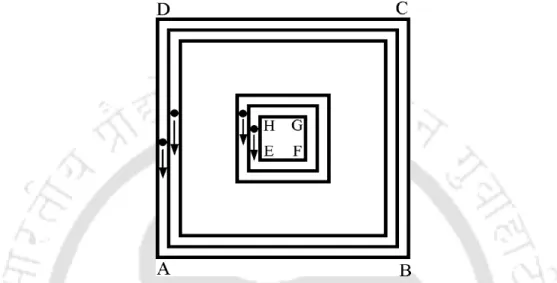
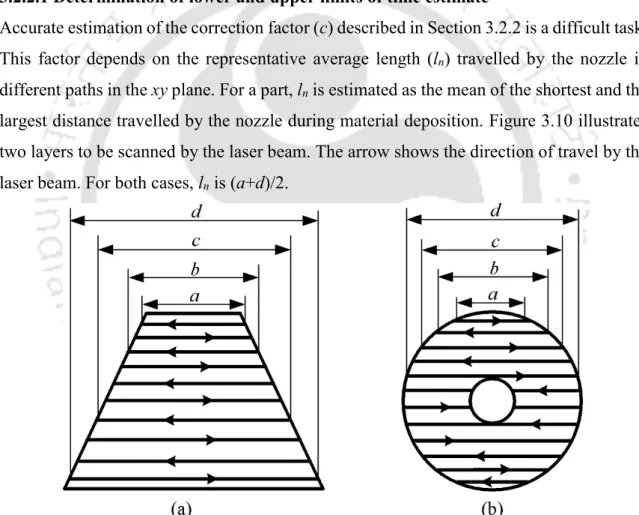
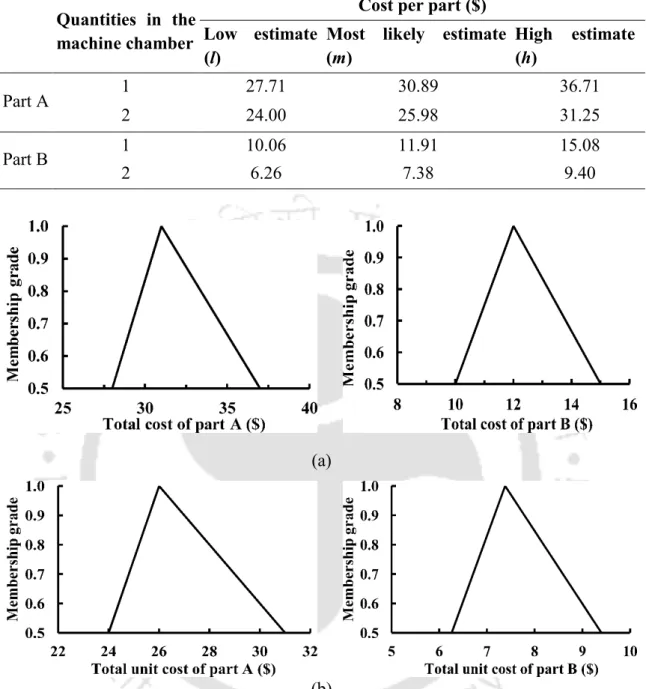
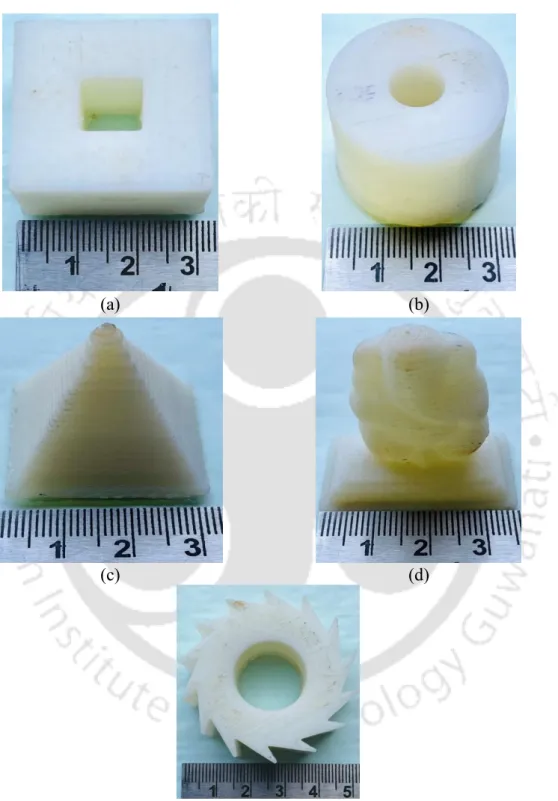
Figure 2.1 Flow chart of the present thesis ... 33 Figure 3.1 An illustration of SLS ... 36 Figure 3.2 An illustration of FDM (Qattawi et al. 2017) (Under a Creative Commons License) ... 37 Figure 3.3 A typical time-velocity diagram of the roller ... 39 Figure 3.4 A schematic of scanning process: (a) top view of the part illustrating laser beam diameter and scan spacing, (b) front view illustrating layer thickness of the part ... 41 Figure 3.5 A typical layer undergoing sintering process with a small empty space and corresponding time-velocity diagram ... 42 Figure 3.6 A typical layer undergoing sintering process with a large empty space and corresponding time-velocity diagram ... 44 Figure 3.7 A pictorial view representing generation of boundaries in a rectangular layer... 45 Figure 3.8 Representation of (a) solid layer (100% infill density) and (b) partially filled layer... 46 Figure 3.9 Time-velocity diagram of nozzle for covering (a) a large and (b) a small distance ... 47 Figure 3.10 Illustration of representative average length (ln) travelled by the nozzle for (a) a layer to be completely filled, (b) a layer to be partially filled... 49 Figure 3.11 Fuzzy variable as a function of membership grade ... 53 Figure 3.12 Arithmetic operations (addition and subtraction) of two fuzzy numbers ... 54 Figure 3.13 Representation of cost as a fuzzy number: (a) Considering 1 quantity at the machine chamber, (b) Considering 2 quantities at the machine chamber ... 59 Figure 3.14 Photograph of fused deposition modelling (Make: Riwell RL 200A) ... 60 Figure 3.15 Parts printed in FDM based 3D printer: (a) Part 1, (b) Part 2, (c) Part 3, (d) Part 4, and (d) Part 5 (Least count of the scale shown is 1 mm) ... 61 Figure 3.16 Representation of cost as a fuzzy number for parts produced by FDM: (a) Part 1, (b) Part 2, (c) Part 3, (d) Part 4, and (d) Part 5... 65 Figure 4.1 A schematic of a typical mould ... 69 Figure 4.2 SLS cost at different membership grades: (a) cost versus quantities of part A, (b) cost versus quantities of part B ... 75
Figure 4.3 IM cost at different membership grades: (a) cost versus quantities of part A, (b) cost versus quantities of part B ... 79 Figure 4.4 Cost comparison of IM and SLS: (a) part A, (b) part B ... 80 Figure 4.5 Variation of fuzzy reliability with cost considering 1 quantity at the machine chamber for (a) part A, (b) part B ... 81 Figure 4.6 Reliability at different values of fuzzy costs for SLS process ... 82 Figure 5.1 Variation of Uf with membership grade for the production of (a) 1000, (b) 1500 and (c) 2100 units... 94 Figure 5.2 Variation of unit cost with membership grade for the production of (a) 1000, and (b) 2100 units ... 95 Figure 6.1 Velocity versus time diagram of the roller ... 103 Figure 6.2 Different zones of the extruder. With permission from Turner et al. (2014).
Copyright 2014, Emerald Publishing Company. ... 107 Figure 6.3 Variation of energy consumption with quantities of part B ... 113 Figure 6.4 Representation of energy consumption as a fuzzy number for parts produced by SLS: (a) Considering a single quantity, (b) considering full utilization of the machine chamber (two and eighteen quantities of part A and part B, respectively) ... 115 Figure 6.5 Representation of energy consumption as a fuzzy number for parts produced by FDM: (a) Part 1, (b) Part 2, (c) Part 3, (d) Part 4, and (d) Part 5 ... 119
List of Tables
Table 3.1 Different elements for cost ... 38
Table 3.2 Estimation of build time of the two parts ... 55
Table 3.3 Estimation of build time of the two parts ... 55
Table 3.4 Details of different cost components ... 57
Table 3.5 Cost per unit with lot sizes of 1 and 2 unit(s) inside the machine chamber ... 57
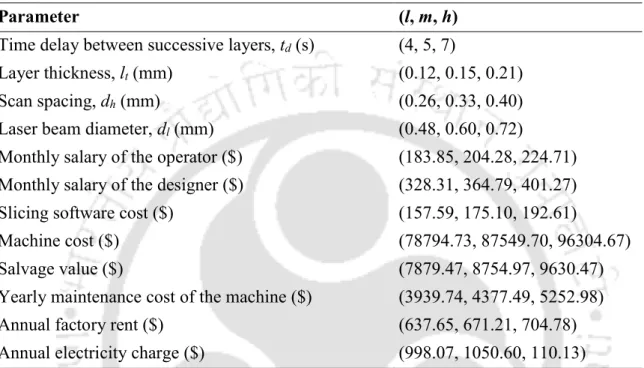
Table 3.6 Values of fuzzy parameters ... 58
Table 3.7 Total cost of part as a fuzzy number ... 59
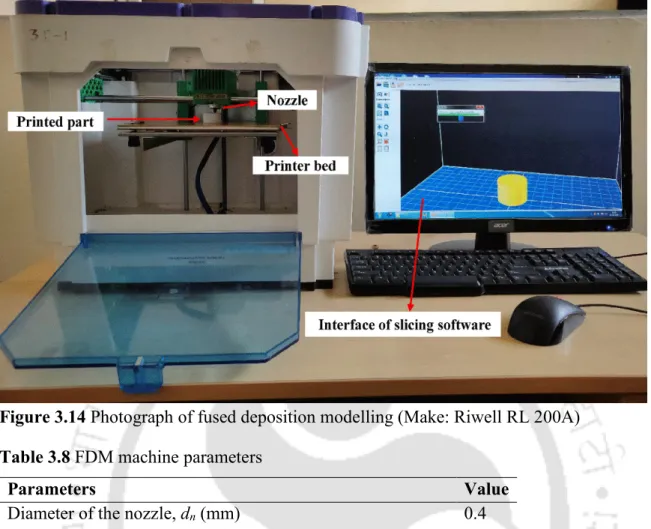
Table 3.8 FDM machine parameters ... 60
Table 3.9 Geometrical parameters of the parts ... 62
Table 3.10 Printing time for different parts... 62
Table 3.11 Interval estimation of build time ... 63
Table 3.12 Details of different cost components for FDM ... 63
Table 3.13 Cost of the parts produced by FDM process ... 64
Table 4.1 Details of material cost, operator, labour and overhead cost in injection moulding ... 77
Table 4.2 Estimation of mould cost ... 78
Table 4.3 Estimation of cycle time in injection moulding ... 79
Table 4.4 Cost per quantity when the demand for part A varies from 390–406 quantities ... 82
Table 4.5 Cost per quantity when the demand for part B varies from 4500–5000 quantities ... 83
Table 4.6 Reliability estimates at different values of upper estimates of cost for part B corresponding to respective membership grades ... 83
Table 5.1 Details of machine utilization and costs for producing different quantities of polymer cutters on an SLS 3D printing machine ... 93
Table 5.2 Details of machine utilization and costs for producing different quantities of two parts on an SLS 3D printing machine ... 96
Table 5.3 Details of cost (considering full utilization) and production time for injection moulding and 3D printing associated with membership grade ... 97
Table 5.4 Details of cost (considering full utilization) and production time for injection moulding and 3D printing associated with membership grade ... 98
Table 6.1 Energy consuming components of SLS ... 102
Table 6.2 Parameters for energy consumed by the laser and heater system ... 111
Table 6.3 Parameters for estimating the roller energy ... 111
Table 6.4 Parameters for estimating the energy consumed by the pistons ... 112
Table 6.5 Energy consumption by different sources for part A and part B ... 112
Table 6.6 Fuzzy parameters considered for estimation of energy consumption in SLS . 114 Table 6.7 Unit energy consumption as a fuzzy number considering a single part and full utilization of the machine ... 114
Table 6.8 Parameters for estimating the energy consumed during melting of the filament and heating the base plate ... 116
Table 6.9 Parameters for estimating the energy consumed during extrusion of the molten filament and the movable platform ... 117
Table 6.10 Energy consumption by various sources for the parts ... 117
Table 6.11 Fuzzy parameters considered for estimation of energy consumption in FDM ... 118
Table 6.12 Energy consumption of the parts produced by FDM ... 118
Table 6.13 Cost, energy usage and CO2 emission of the parts on an annual basis ... 120
Nomenclature
Roman letters
Ab Area of mould base cavity
Af Cross-sectional area of the filament al Acceleration of the laser beam
an Acceleration/retardation of the nozzle in FDM ar Acceleration/deceleration of the roller
c Correction factor
C* Cost at which possibility index is evaluated cd Completion date of the product
CI Confidence interval
CIM Cost of an injection moulded part CL Left (lower) limit of cost
cmaterial Material cost per unit mass Cmaterial Material cost
Cmb Mould base cost
Cmm Mould manufacturing cost
Cmould Mould cost
coperator Operator cost per hour Coperator Operator cost
coverhead Overhead cost per hour
Coverhead Overhead cost
cp Specific heat of the powder cpb Specific heat of the baseplate cpm Specific heat of melted polymer Cprocessing Processing cost
cps Specific heat of solid polymer CR Right (upper) limit of cost cslicing Slicing cost per hour Cslicing Slicing cost
Ctotal Total cost
Cu Unit cost, i.e., cost per quantity dd Due date of the product
dh Scan spacing
dl Laser beam diameter
dn Diameter of the nozzle in FDM
dpowder Diameter of the powder
droller Diameter of the roller Ed Energy density of a laser Eextrusion Energy required in extrusion
Eheater Total energy consumed by the heater system Eir Energy consumed by the infrared heater Emelting Total energy required during melting Emisc Miscellaneous energy
Ep Energy consumed by the movable platform Episton Total energy consumed by the piston Er Total energy spent by the roller
Erh Energy consumed by the resistive heater Eroller Total energy consumed by the roller Fi Amount of time spent on ith job
Fr Resistive force provided by the powder to the roller G Acceleration due to gravity
h High estimate of a parameter
H(T) Temperature-dependent term for viscosity hb Height of the bounding box
hp Thickness of cavity and core plates hps Height travelled by the piston hz Height of the part
Id Percentage of infill density
Ir Moment of inertia of the roller about its centre K Power law fit parameter
l̿ Grand mean
l Low estimate of a paramete
l1 and l3 lengths of the extruder corresponding to zone I and III, respectively lb Length of the bounding box
l̄j Mean length
ln Time required for traversing a distance in FDM lr Distance travelled by the roller
ls Percentage loss of the material lt Layer thickness
lx Length of the part
m Most likely estimate of a parameter mb Mass of the base plate
me Mass of the extruded material mf Material constant
mp Mass of the powder
mps Mass of the piston mr Mass of the roller N Power law fit parameter
nc Number of cavities in the mould nd Replicates of a sample
nf Deciding factors
Nl Number of layers present in the part np Number of quantities of a part ns Number of samples
Ns Total number of scans P(x) Probability of each quantity pi Perimeter of rectangular EFGH PI Possibility index
Pir Power rating of the infrared heater Pl Power rating of the laser
po Perimeter of rectangular ABCD py Production yield in injection moulding qf Heat of fusion
Qm Heat required during melting of the filament
Qr Heat input Re Reliability
ro Ratio of overhead cost to other cost
rp Ratio of the volume of the actual part to that of the bounding box rr Radius of the cylindrical roller
ru Ratio of actual cost to the cost with Uf=1
s Distance BE in layer
Sb Surface area of the bottom of a part
sf Strategy factor
sm Standard deviation of the means St Surface area of the top of a part T Temperature at the end of the extruder
t Time taken to travel the overall empty distance BE in a layer T0 reference temperature at which the power-law fit parameters are
determined
t3D Time for 3D printing for a product
ta Time required to travel the distance BC in a layer tal Lower estimate of available time
tam Most likely estimate of available time tap Time for adding powder by the roller tau Upper estimate of available time
tbuild Total build time
tc Cooling time
tcm Time for conventional manufacturing
tcycle Cycle time in injection moulding
td Tardiness, i.e., the time difference between completion date and due date tdesign Time required to convert the CAD model to proper STL file format teo Time required in ending operations
Tf Final temperature
tf Injection time or fill time Ti Initial temperature ti Time taken for stage i
tideal Ideal time to traverse tii Time taken for stage ii tiii Time taken for stage iii tiv Time taken for stage iv
tl Time for traversing a distance in FDM process Tm Melting temperature of the material
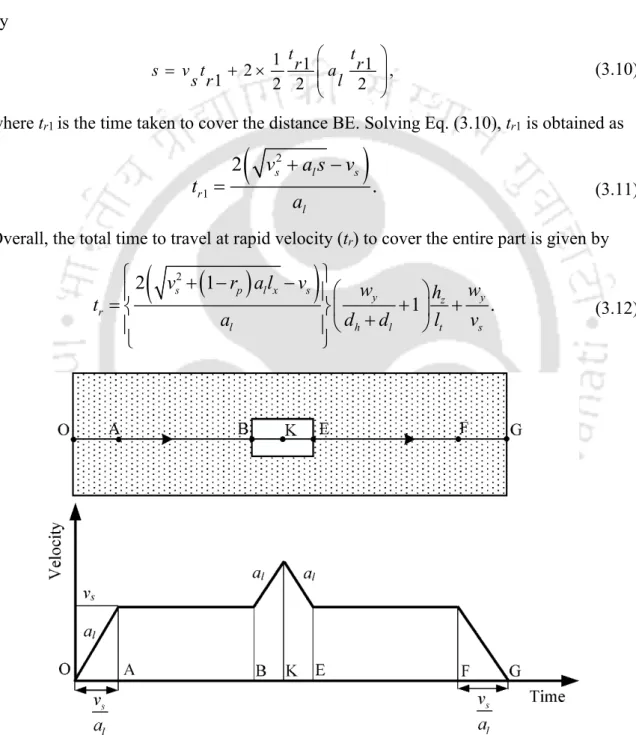
tmp Time required for machine preparation tpp Time required for post-processing tr Total time to travel at rapid velocity
tr1 Time taken to cover the distance BE in a layer tr2 Time taken to cover the distance BC or DE in a layer trs Mould resetting time
tscan Time required to scan
tsetup Setup time of the machine tv Time taken for stage v Uf Utilization factor
Vb Volume of the bounding box
vf Velocity of the filament at the entry of the extruder vn Maximum velocity of the nozzle in FDM
Vnet Net volume of part to be filled
Vpart Volume of the actual part
vps Velocity of the piston
vr Maximum attainable velocity of the roller vra Rapid velocity of the laser nozzle
vs Scan velocity of the laser beam wb Width of the bounding box wy Width of the part
x̄ Mean value
Greek letters
∆P1 Pressure drop in the extruder
α Activation energy
β Reliability index
βf Parameter for assisting decision process βn Nozzle angle of the extruder
γ̇ Shear rate
η Viscosity of the material
ηir Efficiency of the infrared heater ηm Efficiency of the motor
ηr Efficiency of the resistive heater
μ Membership grade
μo Overall membership grade ρm Density
σ Standard deviation
Φ Material constant
ωr Maximum attainable angular velocity by the roller List of abbreviations
ABC Activity-based costing
ABS Acrylonitrile butadiene styrene AHP Analytic hierarchy process AM Additive manufacturing ANN Artificial neural network BJ Binder jetting
CAD Computer aided design CM Conventional manufacturing CNC Computer numerical control DMD Direct metal deposition DOE Design of experiments DP Dimensional performance EBM Electron beam melting FDM Fused deposition modelling HTP Human toxicity potential IM Injection moulding LCA Life cycle analysis
LOM Laminated object manufacturing
OEE Overall equipment effectiveness PBF Powder bed fusion
PLA Polylactic acid
PPE Personal protective equipment RP Rapid prototyping
SFF Solid Freeform Fabrication SLA Stereolithography
SLM Selective laser melting SLS Selective laser sintering SM Subtractive manufacturing STL Standard tessellation language
Chapter 1 Introduction
1.1 Additive manufacturing
Additive manufacturing (AM) refers to the practice of making a product layer by layer based on a digital model prepared by computer-aided design (CAD) software. AM is one of the foundations of the fourth industrial revolution, i.e., Industry 4.0. This layer-by-layer method of manufacturing was patented by George J. Peacock in 1902 for making laminated horseshoes (Yang et al. 2017). At that time, computers were not available, but Peacock’s method can be considered as an initiator to AM. Initially, AM emerged as rapid prototyping (RP) technology in the 1980s. AM emerged as rapid prototyping (RP) technology in the 1980s. The purpose was to build a prototype before the final configuration for commercialization.
This emerging technology is referred by numerous names: automated fabrication, freeform fabrication, digital fabrication, layer manufacturing, rapid manufacturing, rapid tooling, rapid prototyping and 3D printing. Though there is still a debate regarding the acceptance of a universal terminology, the recently adopted ASTM standards use the term additive manufacturing (AM). However, the most commonly used spoken term is 3D printing (Weller et al. 2015). This disruptive technology is inherent in efficient use of raw materials and producing minimum waste unlike conventional manufacturing. Also, it does not require any fixtures or cutting tools. Advances in this technology have resulted in producing implants, aero parts, robots and even a house. AM comprises the following steps:
A 3D solid model is developed in the computer and converted to STL (standard tessellation language/standard triangle language) file format. The continuous geometry is converted into small triangles.
The file is then transferred to the AM machine. Some operations are done to ensure proper size, position and orientation of the part.
The part is built by automated process in the AM machine. However, skilled monitoring is needed to ensure minimum error of the parts.
The final step includes removal of the part and post-processing. The part is removed from the build platform. Post-processing involves clean-up of the part and proper finishing before final commercialization.
There are several AM processes. These can be classified either based on raw material or the process of layer formation. Based on raw material, the processes are classified into powder-based, liquid-based and solid-based. Based on the layer formation mechanism, AM can be classified into the following processes— vat photopolymerization, material extrusion, powder bed fusion, direct energy deposition, binder and material jetting, and sheet lamination.
1.2 Need for sustainability analysis of additive manufacturing
The origin of sustainability can be traced back to the eighteen century. At that time, the focus was only on environmental protection (Michelsen et al. 2016). This perception has gained huge attention due to increasing environmental concerns. Sustainable development, as reported by Brundtland Commission in 1987, is “to meet the need of the present as well as safeguarding the need of the future generation” (Imperatives 1987). Since then, several concepts were proposed over the years. The World Summit held in 2005 put forward a universally acceptable concept of sustainability as a combination of economic, environmental and societal aspects (Ma et al. 2018). These are considered as three pillars of sustainability. In the context of AM, its birth and development took place by the drive of sustainability. The coaction of AM with sustainability can lead to a new dawn in the coming era of manufacturing. It is claimed that AM will be the most promising campaigner for sustainable development. In spite of several claims made for AM, there is an unwillingness for adopting it.
1.3 Scope and primary objective of the thesis
This thesis attempts to get answers to the following questions:
Is it worthy to invest in AM for an industry in spite of the presence of conventionally established manufacturing technologies?
What are the necessary factors that need to be considered before purchasing a 3D printer?
Based on these factors, how the suitability of a 3D printer can be assessed?
1.4 Organization of the thesis
The content of this thesis is organized as follows:
The present chapter briefly introduces AM, its relevance to sustainability along the primary objectives and organization of the thesis.
Chapter 2 provides a literature review on economic, environmental and societal aspects of AM. Important deciding factors for procuring AM in an industry are discussed.
Subsequently, inferences from the literature review and detailed objectives are presented.
Chapter 3 presents cost estimation of AM in uncertain conditions. The importance of different cost elements and activities relevant to AM are discussed. For illustration, two popular AM processes, i.e., selective laser sintering (SLS) and fused deposition modelling (FDM) are considered.
Chapter 4 presents cost analysis of AM and conventional manufacturing technology.
The concept of fuzzy reliability is proposed to compare two uncertain costs and choose a favourable manufacturing process. Also, a variable demand scenario is considered.
Chapter 5 presents a method for assessing the utility of AM in an organisation. The concept of utilisation factor is introduced and its effect on production planning and associated costs are discussed. Also, a method to evaluate the labour penalty due to reduction in employment is presented.
Chapter 6 discusses the energy consumption of AM. Analytical models based on the working principle of two popular AM processes, SLS and FDM are presented. The effect on the energy consumption based on the production of single and multiple parts are discussed.
Chapter 7 presents the Conclusion and the scope of future work. This is followed by references and appendices.
Chapter 2
Literature Survey and Detailed Objectives
2.1 Introduction
In recent years, the sustainability concerns of additive manufacturing (AM) have gained significant attention. A review on all three facets of sustainability, i.e., economic, environmental and societal, pertinent to AM technology, is discussed in this chapter.
Section 2.2 presents a review of economic aspects of AM. Several cost estimation models of different AM processes developed over the years are discussed. Section 2.3 presents the energy estimation for different AM processes. Section 2.4 discusses the societal aspects of AM. Section 2.5 presents a review of various factors and motives for procuring AM.
2.2 Economic sustainability of additive manufacturing
The concept of engineering economy is based on a proper time value of money. It acts as a catalyst for increasing profitability. A robust understanding of cost assessment is a key factor for attaining economic sustainability (Ma et al. 2018). Cost assessment is a crucial parameter for demand, worth and functionality of the product to be customized. For this, a necessary requirement is the estimation of build time. Build time influences several elements of production cost. A prudent estimation of build time helps in evaluating the cost of the process as well as comparing its productivity with other manufacturing processes.
Hence, it is necessary to have a basic understanding of how different process parameters influence the build time of an AM process. Section 2.2.1 discusses the build time estimation models in AM. Section 2.2.2 discusses the cost estimation models in additive manufacturing.
2.2.1 Build time estimation models of additive manufacturing
Build time is defined as the time required to produce the part in the AM based machine.
Sometimes, time consumed in pre-processing operation and post-processing operation is also considered as a part of build time. Several attempts have been made to understand the effect of machine and geometry related parameters on build time of an AM process.
Estimation of an AM based technology is process specific and varies according to the working principle. Numerous models, viz., analytical, parametric and soft computing models have been proposed for estimating the build time in AM process. The following subsections discuss different build time estimation models developed in the past.
2.2.1.1 Analytical models
In one of the earliest investigations, Kechagias et al. (1997) attempted to estimate the build time for two different laser-based AM processes, i.e., stereolithography (SLA) and laminated object manufacturing (LOM). At that time, these technologies were at infant stage and the term ‘additive manufacturing’ (AM) was not coined. These processes were referred to as rapid prototyping (RP). For both the processes, time was estimated as algebraic summation of time taken in layer preparation and layer processing. Layer preparation comprises the time to form a new layer, time required by the platform to move downwards and delay time. Layer processing time comprises the time taken by the laser to scan a layer according to the geometry of the part. Different parts were fabricated to validate the accuracy of the proposed methodology. The deviation between the experimental value and estimated value was estimated. For SLA, the lowest and highest deviation of build time was found to be 0.3% and 14.5%, respectively; whereas for LOM, the lowest and highest deviation was found to be 3.45% and 54.83%, respectively.
In another early attempt, Alexander et al. (1998) proposed a methodology to estimate the build time of two popular AM processes, i.e., fused deposition modelling (FDM) and SLA. These processes were referred to as layered manufacturing. The build time (tbuild) was given by
b u ild m a n idle
,
t t t
(2.1) where tman is the manufacturing time where the part and support are produced in a layer by layer fashion. On the other hand, tidle is the non-production time. This time period involves the movement of the nozzle without depositing material, cleaning of the nozzle, command execution time and movement of the z axis. The time estimated by this method underestimated the true time, as the effect of acceleration, deceleration and the time taken for changing the direction of the nozzle was not considered.A popular laser-based process that uses polymeric material is selective laser sintering (SLS). It is one of the oldest and popular powder bed fusion AM processes.
Specific to SLS, Pham and Wang (2000) investigated the effect of machine parameters such as roller speed, roller travel distance, delay time, laser scan speed and laser scan spacing for estimating the build time. The study considered two SLS machines and four different raw materials for case studies. The maximum error, i.e., the difference between actual and estimated build time was 8%. The authors highlighted that inclusion of the effect of acceleration and deceleration of the roller can make the model more accurate. In another
study confined to SLS, Zhang and Bernard (2013) proposed a method to estimate the build time for a single part, similar multiple parts and mixed parts. The model comprised laser- based parameters such as laser velocity, laser diameter and hatching distance. However, some important parameters specific to SLS process such as roller velocity, roller travel distance, delay time was not considered. Instead, the recoating time, a part of layer preparation time was taken as six seconds. The time required for machine preparation and ending operation was considered as one hour. Two products having different geometrical features and sizes were considered for the case study; these were dissimilar products and the ratio of their volumes was 19:1.
In extrusion-based AM process, i.e, FDM, Thrimurthulu et al. (2004) proposed a methodology to estimate the build time of a part based on fundamental machine and geometrical parameters. They assumed that the deposition of the thermoplastic material is continuous and there is no interruption. Also, the study ignored the non-productive time and the effect of orientation of the part in the printing process. Assuming continuous deposition of the molten material, tbuild was obtained as
p
,
build
n e
t V
a v
(2.2) where Vp is the volume of the part to be fabricated, an is the cross-sectional area of the nozzle and ve is the extrusion velocity of the filament. The time estimated by this method will be different from the actual build time, as non-productive time (lowering down of the platform, time between ending and starting between two different paths) was not considered. This gap was addressed in the work of Han et al. (2003). They carried out a build time analysis for FDM process. The algorithm to estimate the build time comprised the procedure to determine the repositioning and cleaning time of the nozzle. The authors proposed adaptive slicing (variable layer thickness) method by dividing the part into different zones; each zone was assigned a different layer thickness. Parts having simple geometry, e.g., a cylinder, comprised only one zone. However, the parts having complex geometrical features like sharp curvatures had multiple zones.In another study specific to FDM process, Komines et al. (2018) presented analytical as well as empirical build time estimation models, which were validated by experiments. As per the authors, the build time is highly influenced by the acceleration of the nozzle especially for fabricating complex geometrical parts. In the analytical approach, the deposition time was estimated as the time required by the nozzle head to move with
constant velocity and the acceleration time of the nozzle. On the other hand, in the parametric approach, an acceleration coefficient was considered. However, the effect of different geometries on acceleration was not mentioned explicitly. The analytical model produced relatively more accurate results than the parametric model.
2.2.1.2 Parametric models
Specific to SLS, Ruffo et al. (2006b) proposed a parametric model for estimating the build time. They explored the effect of geometrical parameters on the build time of an object.
The overall build time was given by algebraic summation of recoating time, scanning time, and heating and cooling time (thc); thc was taken as one hour. Case studies were conducted and it was reported that two parts having same height and volume may take different time to build.
The effect of different orientations (rotation about different axes) of a part on the build time was explored by Rathee et al. (2017). They built a cylindrical shaped object by FDM process. They conducted several experimental runs and used response surface methodology, a statistical based technique, to establish parametric models. The layer thickness had the maximum effect on the build time irrespective of any orientation. Build time was the least for orientation having the minimum z height; although it may increase the cross-sectional area of a layer, it also reduces the number of layers in the z direction.
However, it was observed by Chacon et al. (2017) that specific to some geometries and process parameters, the orientation having lesser number of layers took relatively more time. High printing speed and feed rate may increase the deposition rate of the material, but repositioning of the nozzle takes additional time due to the effect of acceleration and deceleration.
2.2.1.3 Soft computing models
Some researchers used artificial neural network (ANN), a popular soft computing technique in build time estimation of AM processes. For example, Munguia et al. (2009) proposed an ANN model for the time-estimation in SLS process based on geometrical features of the product. They considered height of the part, volume of the part and bounding box as input parameters (referred to as input neurons). A bounding box is an imaginary cuboidal shaped box that contains every edge of the part. Munguia et al. (2009) took same examples as taken by Ruffo et al. (2006b) and compared the results. The average error in time estimation obtained by ANN model was reduced to 2.08% from 14.98% as obtained by empirical relation of Ruffo et al. (2006b). In another ANN based study, Di Angelo and Di Stefano
(2011) estimated the build time of several AM processes including SLA, SLS, FDM, LOM and three-dimensional printing (3DP). For this, they considered the part’s height and volume, layer thickness and repositioning movements. Experiments were conducted only for FDM and 3DP considering six test cases. The average percentage errors for FDM and 3DP were 11.5% and 12%, respectively.
2.2.2 Cost estimation models of additive manufacturing
Proper knowledge of cost estimation is crucial for decision making in academia, research and business. The survival of any manufacturing company is at stake unless it is influenced by a proper cost estimation approach. A customer expects a product at a reasonable cost without any compromise in the quality. Underestimation of cost results in the financial loss of business that hampers its growth. On the other hand, overestimation of cost results in the loss of goodwill of the company and customer relations.
Cost estimation techniques can be broadly divided into two categories— qualitative and quantitative (Niazi et al. 2006). Qualitative technique lies on the wise utilisation of the historical data. The similarity between the old and new parts are identified. It is based on a comparative analysis of a new product with the previously manufactured products to identify the similarities in the new ones. The past data and experience guide to generate reliable cost estimation for the newly developed product. Expert judgement is preferable for adopting this technique. On the other hand, a quantitative technique is based on identifying different cost elements to manufacture the product. Cost is estimated using analytical function comprising necessary cost variables. Every cost variable gives an idea about different resource consumption involved in manufacturing the product. One of the popular cost estimation approaches is activity-based costing (ABC). It falls under the category of quantitative technique (Andrade et al. 1999). This technique is practised amongst several small to large scale industries. It identifies all the activities and the accompanying cost for making an end-usable product. For example, in machine handling, an operator is associated with machine setup and basic maintenance. Here, the cost is associated with the operator also. For running the machine, the cost is associated with depreciation, utilization, running time and number of shifts. ABC approach measures the performance activity-by-activity. If an activity incurs a high cost in the production cycle without adding much value to the final product, the management scrutinizes the activity and tries to improve it.
2.2.2.1 Preliminary investigations
Alexander et al. (1998) estimated the cost for two processes— FDM and SLA. The total cost was taken as the summation of prebuild, build and post-processing costs, i.e.,
C
total C
prebuild C
build C
post processing.
(2.3) The prebuild cost comprised the cost involved in positioning and scaling the part, slicing the part and computational cost involved for fixing necessary parameters. The build cost comprised the power consumption, machine capital, depreciation, maintenance and the material cost. The post-processing cost included the cost involved in removing the support structures and performing finishing operations. It was emphasised that proper build orientation could lower the build and post-processing cost. This study assumed that the cost of each stage was independent and performed one after the other. Based on orientation, the minimum and maximum cost for FDM was $ 72 and $ 113, respectively, for a specific product. For SLA, minimum and maximum cost was $ 102 and $ 129, respectively. In another early attempt, Xu et al. (2001) evaluated the cost of AM by considering the cost of material, cost of running the machine, cost of data preparation and cost of post-processing.They considered FDM and three laser-based AM viz., SLA, selective laser sintering (SLS) and laminated object manufacturing (LOM). Unlike the study of Alexander et al. (1998) that considered material cost as a part of build cost, this study considered the cost of material separately.
Later, investigations were carried out to compare AM with other manufacturing processes based on cost-competitiveness. For example, Hopkinson and Dickens (2003) compared the costs incurred in AM and injection moulding (IM). For AM, three cost elements were considered— machine cost, labour cost and material cost. The costs of IM, SLA, FDM and SLS for producing typical components were compared. The authors estimated the unit costs of two different parts (one of small size and the other of medium size). They found that for a small-sized part, SLA and FDM were profitable for manufacturing up to 6000 quantities. On the other hand, SLS was economical for manufacturing up to 14000 quantities. For the medium-sized part, SLA and FDM were economical for manufacturing up to 700 quantities. SLS process was not considered for manufacturing the medium-sized part. For low volume of production, IM was found to be an expensive process.
Ruffo et al. (2006a) proposed a new cost model for SLS to estimate the unit cost of the small-sized part earlier considered by Hopkinson and Dickens (2003). The unit costs of
the small-sized part were compared when manufactured by SLS and IM processes. The cost of build (Cbuild) was estimated as
build direct indirect
,
C C C
(2.4) where Cdirect is the direct cost associated with the material and Cindirect is the time-dependent indirect cost associated with the machine, software, labour, maintenance and overhead.Based on this model, SLS process was found to be favourable for manufacturing up to 9000 quantities as compared to 14000 quantities estimated by Hopkinson and Dickens (2003).
Ruffo et al. (2006a) also discussed the effect of orientation of the parts during manufacturing on the cost. They suggested the recycling of powders to reduce the cost of the part.
2.2.2.2 Production of mixed parts in the build chamber
Ruffo and Hague (2007) explored how manufacturing several parts simultaneously in a build chamber can achieve a cost reduction. Two different automotive parts, one of a smaller size and the other of large volume were considered for the case study. The authors focussed on the aspect that a manufacturing company always sets a build chamber with the highest packing ratio to lower the unit cost of a product and achieve economy of scale.
Rickenbacher et al. (2013) attempted to estimate the cost of every individual part produced in a build chamber. The AM process chosen was selective laser melting (SLM). The model comprised several different cost elements including the cost to produce an inert gas environment. However, the energy consumption was excluded. The cost of a part was given by
total prep buildjob setup build removal substrate pp
,
C C C C C C C C
(2.5)where Ctotal is the total manufacturing cost, Cprep is the cost of preparing geometrical data for orientation and support structures of the part, Cbuildjob is the cost associated with the part for arranging it in the machine chamber, Csetup is the setup cost of the machine, Cbuild is the cost for building the part in the machine, Cremoval is the cost involved in removing the part from the machine, Csubstrate is the cost to separate the parts from substrate and Cpp is the cost for post-processing that involves removal of the support structures and surface finishing.
Three parts having different volumes (14.65 cm3, 4.9 cm3, 2.02 cm3) were considered as a case study. The costs of the largest and the smallest part when manufactured separately in the machine were found to be € 1800 and € 500, respectively. However, if all three parts are manufactured simultaneously, an average cost reduction of 41% was achieved. Hence,