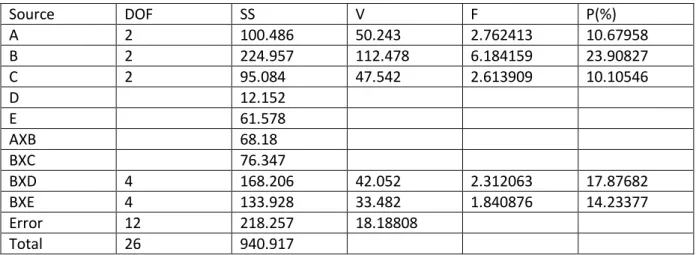
The purpose of the analysis of variance (ANOVA) was to investigate which parameters significantly influenced the quality characteristic [16]. Knowledge base: The main part of the fuzzy system is the knowledge base, where both rule base and database are referred to jointly. The database defines the membership functions of the fuzzy sets used in the fuzzy rules, where the rule base contains a number of fuzzy if-then rules.
A real world system will always need the output of the fuzzy system in the form of real input. The defuzzifier's job is to receive the fuzzy input and provide real-world output [20]. With the availability of a set of measured data, the input and output of the fuzzy system would be able to predict the output for a given input, even if a specific input condition was not covered in the build phase [21].
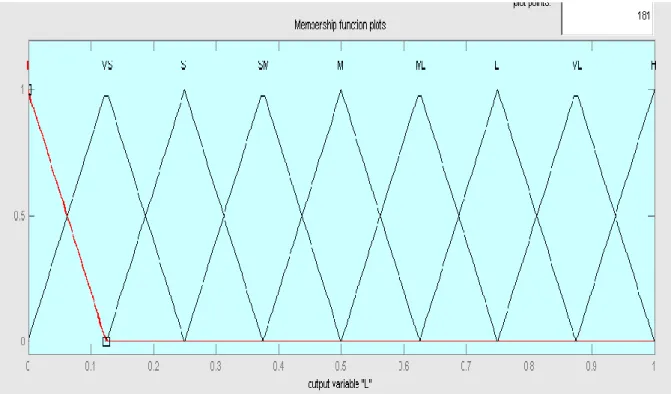
The universe of discourse was also decided based on the physical nature of the problem [22]. In general, triangular and trapezoidal membership functions have been used to normalize discrete inputs due to their simplicity and computational efficiency. The triangular membership function as described in Equations 3 is used to convert linguistic values in the range 0 to 1. Where a, b, c, d are the linguistic value parameters and x is the input parameter range.
In this proposed model, each input has five triangular membership functions, with the output of the proposed model having nine triangular membership functions.
![Table 2: Process parameters to be controlled: [38]](https://thumb-ap.123doks.com/thumbv2/azpdfnet/10332151.0/12.893.209.683.141.536/table-process-parameters-controlled.webp)
Defuzzification
Center of mass
This technique takes the output distribution and finds the mass of it to come up with one sharp number. This technique takes the output distribution and finds its mean of maxima to come up with one sharp number.
From statistical analysis ,the effect of each parameter on responses are calculated and the using the SN ratios from Table 3, the SN ratios plots are shown below for
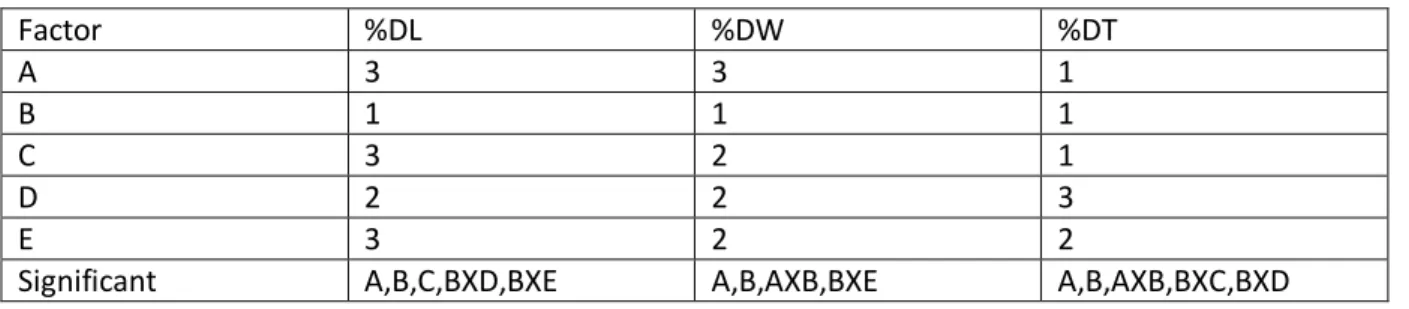
The experimental data on the percent change in dimension are converted to the S/N ratio value as shown in Table 3 using Eq. 2) for smaller, more qualitative features. Significant factors and interactions (Table 7) are identified using ANOVA shown in Tables 4–6 for %DL, %DW and %DT, respectively [38]. 1)The best optimal parameter settings for %change in length are A3,B1,C3,D2,E3 2)The best optimal parameter settings for %change in width are A3,B1,E2.
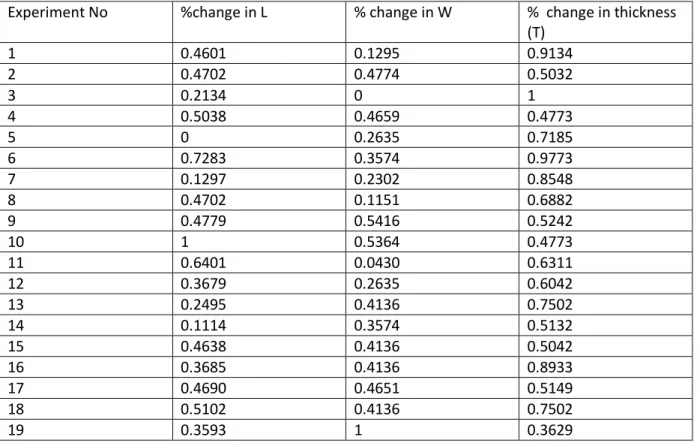
As discussed above, Mamdani's fuzzy inference is used for predicting the dimensional accuracy of test specimens [31], as this method accounts for uncertainty and is very useful in the workplace practice. high) which the workers could understand very easily. Normalization: .Experiments performed provide data in SN ratio (the smaller the better), but this data must be normalized using the formula below[32]. The normalization is done to give values in the range from 0 to 1 for all answers so that the rule box to be created using the Fuzzy toolbox in MATLAB2009 can be done easily, and hence it will help in predicting dimensional accuracy in more accurate way.
Ymax and Y min are the maximum and minimum values of SN ratio of 27 trials shown in Table 3 of %DL or %DW or %DT. W is width, T is thickness, L is length, %DL is change in length, %DT is change in thickness, %DW is change in width. There are five factors and each factor has three levels, so there will be 3^5 experiments.
Therefore, it also requires the same amount of rules to be created in the toolbox in MATLAB while using fuzzy logic [33]. This can be time-consuming and expensive, so design of experiments (DOE) is used to reduce the number of experiments and 27 experiments will be performed as shown in Table 3. Using the design of experiment technique, a rule box is created in the fuzzy logic tool in MATLAB 2009. There were 5 inputs (A, B, C, D, E) and 3 outputs ( %DL,%DW,%DT) and each input has five member functions and each output has 9 member functions.
Using the normalized data in Table 9 above, we partitioned the range of the output functions and thereby plotted the membership functions. Finally, the results were predicted by fuzzy inference system (FIS) in MATLAB 2009 as shown below [41]. Graphs: After calculating the % error, graphs were drawn between the experimental and predicted Fuzzy Inference System (FIS). 1) Experimental %DL versus predicted %DL (FIS).
![Table 4 Anova table for %change (%DL) in length [38]](https://thumb-ap.123doks.com/thumbv2/azpdfnet/10332151.0/26.893.99.796.296.551/table-anova-table-change-dl-length.webp)
Experimental %DW versus Predicted %DW(FIS)
Experimental %DT versus Predicted % DT (FIS)
The results predicted by the Taguchi method show that shrinkage is dominant along the length and width of the test piece, while the thickness is always greater than the desired value. The best combination to reduce % length change is higher layer thickness (level 3), orientation (level 1), maximum raster angle (level 3), mean raster width (level 2), maximum air gap (level 3). To reduce the % change in width, it requires medium screen angle (level 2) and medium air gap (level 2), and for less thickness it requires layer thickness (level 1), orientation (level 1), screen angle (level 1), and a higher value raster widths (level 3) and air gaps at level 3.
Study on observed results shows that there are a large number of conflicting factors independently or interacting with others can affect the dimensional accuracy. The dimensional accuracy was predicted using the Fuzzy inference system (FIS) and error was calculated between the experimental results and predicted results. The graphs between experimental and predicted results were plotted for % change in length, width and thickness.
Correlation coefficients were determined between the experiment results and the predicted results indicating the strong linear relationship between them. The low percentage error indicates that the results predicted by Mamdani fuzzy logic were very precise and accurate.
Future Scope of work
2007), “Improving accuracy through shrinkage modeling using the Taguchi method in selective laser sintering”, International J Mach Tools Manufacturing, Vol. 2000), "Sensitivity of RP Surface Finish to Process Parameter Variation in Solid Freeform Manufacturing Processes", University of Texas, Austin, p. 3] Es Said Os, Foyos J, Noorani R, Mandelson M, Marloth R, Pregger BA Effect of Layer Orientation on Mechanical Properties of Rapid Prototype Specimens.”, Mater Manufacturing Process , Vol. 2005), “Optimization of rapid prototyping parameters for flexible ABS object production”, J Mater Process Technologies, Vol. 2007), "Measurement of Anisotropic Compressive Strength of Rapid Prototyping Parts.". J Mater Process Technologies, p. 2001), “Critical parameters affecting prototype quality in fused deposition modeling.”, J Mater Process Technologies, Vol. 7] Zhou Jack G, Herscovici Daniel, Chen Calvin C. 2000), "Parametric Process Optimization to Improve the Accuracy of Rapid Prototype Stereolithography Parts", International J Mach Tools Manufacturing, Vol. 8] Campanelli SL, Cardano G, Giannoccaro R, Ludovic AD, Bohez ELJ. 2007), “Statistical analysis of a stereolithography process to improve accuracy”, Computer Aided Design, Vol. 1998), “Online optimization of turning using inverse process neurocontroller”, Transactions of ASME, Journal of Manufacturing Science and Engineering, Vol. 1996), "Tool Condition Monitoring in Drilling Using Vibration Signature Analysis", International Journal of Machine Tools and Manufacture, Vol. 1994), “Correlation of Tool Wear, Tool Life, Surface Roughness and Tool Vibration in End Turning with Wear of Coated Carbide Tools”, Vol. 1986), “Tool wear monitoring through stable turning dynamics”, Journal of Engineering for Industry, Vol.
2003), "Experimental Analysis and Optimization of Tool Wear in Dry Machining Aluminum Alloy Wear", Vol. 2002), “Determination of the optimal conditions for ion nitriding of AISI 5140 steel.” , Surface Coating Technologies, Vol. 2001), “Plasma surface hardening of ASSAB 760 steel samples with Taguchi optimization of the processing parameters”, J Mater Process Technologies, Vol. 1999), "Strategies and Applications for Rapid Product and Process Development at Daimler-Benz AG", Computer Industry, Vol. 2005), "Rapid prototyping - principles and application", New Jersey, John Wiley & Sons Inc. 2003), "The rapid prototyping technologies", Rapid Prototyping, Vol. Determining the Optimal Build Direction for Different Rapid Prototyping Processes Using Multi-Criteria Decision Making”, Robot Computer Integrated Manufacturing, Vol. 1975), “An Experiment in Linguistic Synthesis with a Fuzzy Logic Controller”, International Journal of Man-Machine Studies, Vol. Characteristic analysis of the tungsten EDM surface. Taguchi Method Carbide”, International Conference on Precision Engineering, Taipei; .pp. 2000), "A New Method for Optimizing Material Removal Rate Using EDM with Copper-Tungsten Electrodes", International J Machine Tools Manufacturing, Vol.40, pp. 1996), “Simultaneous Optimization of Flame Spray Process Parameters for High Performance Molybdenum Coatings Using Taguchi Methods.”, Surface Coating Technologies, Vol. 31] Fallbohmer P, Altan T, Tonshoff HK, Nakagawa T. 1996), “Research of Die and Die Making Industry”, J Mater Process Technologies, Vol. 1993), "Taguchi methods a practical approach", New York: Addison Wesley Publishers. 2001), "A new slicing procedure for rapid prototyping systems".
34] Pandey Pulak Mohan, Venkata Reddy N, Dhande Sanjay G. 2003), “Cutting Processes in Multilayer Manufacturing a Review.”, Rapid Prototyping J, Vol. 2004), “Microinjection Process Optimization Using Gray Relational Analysis and Mold Flow Analysis”, Journal of Reinforce Plastic Composite, Vol.
![Table 3. L 27 Orthogonal ray with S/N ratio Data for Experimental plan: (Reference [38]) Experimental plan was carried out based on Taguchi method and results were are shown below](https://thumb-ap.123doks.com/thumbv2/azpdfnet/10332151.0/13.893.103.798.226.863/table-orthogonal-experimental-reference-experimental-carried-taguchi-results.webp)
![Table 6:Anova table for % change(%DT) in thickness [38]](https://thumb-ap.123doks.com/thumbv2/azpdfnet/10332151.0/26.893.99.802.625.880/table-anova-table-change-dt-thickness.webp)
![Table 8 . Results of confirmation experiment [38]](https://thumb-ap.123doks.com/thumbv2/azpdfnet/10332151.0/27.893.94.812.670.778/table-results-confirmation-experiment.webp)
![Table 7 Optimum factor level with significant factors and interactions [38]](https://thumb-ap.123doks.com/thumbv2/azpdfnet/10332151.0/27.893.103.799.108.173/table-optimum-factor-level-significant-factors-interactions.webp)