Centre for Sustainable Employment
CSE Working Paper
#35
Tracking Employment Trajectories In the
Covid-19 Pandemic: Evidence from Indian Panel Data
Rosa Abraham, Amit Basole, and Surbhi Kesar
January 2021
Tracking Employment Trajectories during the Covid-19 Pandemic: Evidence from Indian Panel Data
Rosa Abraham12, Amit Basole2 and Surbhi Kesar2
Abstract
Using the CMIE’s Consumer Pyramids Household Survey, we track a panel of households prior to the lockdown (in December 2019), during the lockdown (in April 2020) and afterwards (in August 2020) to investigate the employment and income effects of the Covid-19 pandemic and its associated
containment measures. We identify four distinct employment experiences during the pandemic for those who were in the workforce just prior to the lockdown: no loss of employment ("No effect"), loss of employment followed by recovery ("Recovery"), loss of employment with no recovery ("No recovery"), and a delayed loss of employment ("Delayed job loss"). Overall, 54% of individuals experienced no job loss, while 30% lost work in April but recovered by August. 12% had not recovered employment as of August 2020. We analyse how these trajectories vary across different social and economic
characteristics to quantify contractions and recovery in the labour market and the extent to which the vulnerabilities vary across different social groups, employment arrangements, and industries. We find that women were substantially more likely to lose employment as well as less likely to recover employment. Job loss was also more severe for lower castes as compared to intermediate and upper castes and for daily wage workers as compared to regular wage workers. Younger workers were
particularly vulnerable to job loss compared to older workers. Having lost employment in April, younger workers were also less likely to recover employment in August. Finally, for those who were employed in both December 2019 and August 2020, we examine the changes in employment arrangements. We find a much greater frequency of transitions from wage employment to self-employment, more than that in the seasonally comparable period last year (Dec 2018 to Aug 2019). Our results call for urgent
additional fiscal measures to counteract these effects.
JEL Classification: J21, J64, J46
Keywords: Covid-19, employment, lockdown, employment transitions, gender
1 Corresponding author. Email: [email protected]
2 Azim Premji University, Bengaluru, India.
1. Introduction
The Indian economy is in the midst of a deep recession caused by the Covid-19 pandemic. Economic growth has been negative for the first two quarters of financial year 2020-21, and the annual rate of growth is likely to be negative as well. Even prior to the pandemic-induced crisis, the economy had been slowing down for several quarters (Subramanian and Felman 2019). The causes identified in the
literature include short-run shocks such as demonetisation and rollout of the GST, medium-run factors including the growing “twin-balance sheet” problem and NPA crises, and long-run structural weaknesses such as poor infrastructure and complex regulations on the supply-side, and insufficiently broad-based domestic demand (lack of inclusive growth). While the economy recovered rapidly from the short-run shocks (baring a few informal industries that have yet to recover from the GST-induced changes), the medium- and long-run weaknesses remain.
On the back of these problems, the impact of Covid-19 has been devastating. Economic activity came to a halt across the country in most sectors during April-May 2020 because of the nationwide lockdown3. Even in sectors which were operational, there were major disruptions in supply chains across the country. It is possible that already fragile enterprises (particularly in the MSME sector) would not have been able to survive this sudden stoppage of revenue stream. Not surprisingly, according to the Centre for Monitoring Indian Economy (CMIE) the months of April and May 2020 witnessed the highest unemployment rates of 23.5 per cent and 21.7 per cent respectively.
The gradual unlocking of the economy, beginning in late-May, resulted in a slow pick up of economic activity. The unemployment rate fell to 10.2 per cent in June and further to 7.4 per cent in July.
Thereafter it rose slightly to 8.35 per cent in August and subsequently fell. However, the unemployment rate is an unreliable indicator of labour market health even in normal times. And in such exceptional times, it can be very misleading (Bertrand et. al., 2020). The nature of the recovery, as far as
employment is concerned, thus remains unclear.
Two aspects of the Indian economy are salient to understanding the employment impact of the crisis and the nature of the recovery. First, the highly impacted sectors are also large employers - particularly trade, restaurants, manufacturing and construction. Second, the nature of employment is predominantly
3The Indian government announced a nationwide lockdown beginning from March 24th. It was extended twice and went on till the end of May after which there was some relaxation of lockdown restrictions.
https://www.thehindu.com/news/national/pm-announces-21-day-lockdown-as-covid-19-toll-touches-10/
article31156691.ece
precarious, with little or no job security or social protection via their employers available to the majority of workers.
Thus, early Covid-19 impact surveys conducted in the months of April, May, and June revealed large job losses and significant hardship such as increased food insecurity and hunger as well as increased
indebtedness.4 However, most of these surveys were purposive in nature, targeting vulnerable workers, and hence their findings are not representative of the entire Indian workforce.
Two kinds of attempts have been made to arrive at more representative estimates of job loss. Putting pre-Covid Period Labour Force Survey (PLFS) data on informal employment together with the nature of containment measures, Estupinan and Sharma (2020) estimate that 104 million workers were
potentially at risk of job loss in late-March and early April, and 69.4 million in the latter half of April. But these are not actual measurements of job loss. Bertrand et. al. (2020), World Bank (2020) and
Deshpande (2020) use the nationally representative household survey data from the CMIE Consumer Pyramids Household Survey (henceforth CPHS) to directly measure job losses. These estimates are available for the months of April through August.
In this paper, we use the panel nature of the CPHS data to measure the impact of the lockdown and the extent of subsequent recovery by following the same set of individuals at three points in time,
December 2019, April 2020, and August 2020, i.e. pre-lockdown, during lockdown and post-lockdown5. We estimate the likelihood of employment loss between December and April controlling for
demographic as well as employment characteristics, and similarly estimate the likelihood of recovery between April and August. We also look at the transitions in employment arrangements between December and August for those who are in the workforce at these two points in time.
We find that women were eight times more likely to have lost work than men, controlling for caste, religion, age, level of education, employment arrangement, industry, and state of residence. Having lost employment during the lockdown, they are nearly eighteen times more likely than men to have been still out of work in August. While the gender effect is the most prominent, we also find significant effects for age, caste, employment arrangement and industry of employment. For those who did recover employment by August, we observe increased transitions from wage employment to self-employment, compared to that in the same period last year.
4 See Kesar et al (2020) for one such study. Several such surveys have been compiled into an online database by Azim Premji University’s Centre for Sustainable Employment.
5 At the time of writing this paper, this was the latest data available.
To sum up we report on the highly differentiated nature of recovery by social identity, type of employment, and industry. Our results make a strong case for continued fiscal expansion to aid distressed families and restore aggregate demand.
The remainder of this paper is organized as follows. Section 2 briefly surveys the literature on the employment impact of Covid-19 and its associated containment measures in India and other developing countries. Section 3 describes the data and methods used. In section 4 we offer some measures of absolute numbers of jobs lost by gender. Section 5 contains descriptive statistics on trajectories of employment loss and gain by demographic and employment categories. Section 6 describes the results of the logistic regressions. Section 7 discusses employment transitions. Section 8 concludes.
2. The impact of Covid-19 and associated containment measures on employment in India
The vast majority of the Indian workforce comprises informal workers, who are either self-employed or work on daily wages and other forms of short-term, oral contracts (State of Working India 2018). A forced stoppage of economic activity, such as one that occurred in the months of April and May on account of a country-wide lockdown, results in an immediate loss of work for casual workers as well as others on temporary contracts, and a loss of income for the self-employed. Such workers constitute around 75 per cent of the non-farm workforce.
Thus, one of the most prominent impacts of the lockdown has been a sudden increase in the rate of unemployment and a drastic fall in incomes. Since May 2020, a large number of independent surveys have been carried out by civil society organisations, academic researchers, and consultancy firms. Many of these have been conducted during the course of administering relief and unless otherwise indicated, they are based on purposive sampling of relatively more vulnerable sections of the population (such as informal sector workers, migrant workers, slum dwellers, etc.). The sample sizes vary from a few hundred to tens of thousands. A database of such surveys has been compiled by the Centre for Sustainable Employment at Azim Premji University (see footnote 1). Taken together, these surveys constitute a valuable resource for analysing the economic impact of the pandemic as well as the reach and efficacy of government relief and support measures.
Most COVID-19 livelihoods impact surveys quantify employment loss as the share of workers who were in the workforce pre-lockdown, but reported being either unemployed, out of the labour force or in the
workforce but with zero income or zero days worked during this period. This is important to emphasise because, as mentioned earlier, the conventional unemployment rate is not an appropriate measure to capture the effects of the lockdown. In particular, self-employed workers may consider themselves
“employed” even if they are unable to work for even a single day in the reference period. They also fully expect to resume work in the future, hence are not unemployed by that definition as well. Women, on losing employment, may temporarily withdraw from the workforce rather than report themselves as unemployed. On the other hand, salaried workers who were not actually working, due to the lockdown, may have continued to receive a salary and were therefore employed without having worked a single day.
Using the above expansive definition of loss of employment, the Azim Premji University survey2 (conducted mid-April to mid-May, with just under 5000 respondents) found that 66 per cent of the workforce in the sample had lost employment during the lockdown. The impact was greater in urban areas than rural (80 per cent as opposed to 56 per cent). Excluding farmers, three-fourth of workers (self-employed as well as wage) suffered a loss in employment. Those self-employed in agriculture were the least affected (45 per cent), while the urban self-employed were the worst affected (87 per cent). 77 per cent of urban regular wage workers also lost work. As expected, women reported higher loss of employment relative to men.
The Dalberg survey3 (conducted in April and May, having around 25,000 respondents) found that 52 per cent of low-income households had a primary income earner who lost work during the lockdown. An additional 20 per cent of households had primary earners who retained employment but had reduced or no earnings. Once again, the situation was worse in urban areas (57+23) than in rural (50+18). As with the Azim Premji University survey, urban casual workers and self-employed workers were the hardest hit with employment loss crossing 80 per cent while farmers and salaried government workers were the least hit (37 per cent and 7 per cent respectively).
In the ActionAid survey4 (conducted May-June) out of 11,537 respondents, 75 per cent reported a loss of livelihood (78 per cent urban and 58 per cent rural). Close to half of the respondents said that they had not received any wages and about 17 per cent had received only partial wages. Loss of livelihood ranged from 60 per cent for self-employed workers to 70 per cent for casual workers and almost 80 per cent for regular wage workers.
Notably, despite different sampling strategies and geographies, there is some agreement in the findings.
Most strikingly, nearly 80 per cent of the urban workers lost their livelihoods during the lockdown months.
Kesar et al (2020) use a multivariate logistic regression on the Azim Premji University sample to estimate the determinants of employment loss. They show that farmers were significantly less likely to
experience employment loss compared to casual workers in construction, trade, hotels and transport.
Further, urban self-employed, consisting largely of petty shopkeepers, street vendors, drivers, and small business owners, were hit harder compared to the wage workers in these areas. In terms of social identities, they find that rural women were significantly more likely to experience loss of employment compared to men, and Muslims were significantly more likely to lose employment relative to Hindus in the urban areas. In both rural and urban areas, migrant workers were more likely to experience loss in employment. This points to a higher vulnerability in their occupations in addition to the widely documented hardships they endured on their way home (SWAN 2020).
Though most Covid-19 impact surveys have been purposive in nature, there are two small surveys that are based on random samples. One such survey, from the London School of Economics Center for Economic Performance (Bhalotia et. al., 2020) surveyed 8500 workers between the ages of 18 to 40 years in urban India. They reported 52 per cent of urban workers having either lost work, or having worked zero hours, or receiving no pay during the lockdown. The number is lower than the purposive Covid surveys reported above, most likely due to the fact that it includes respondents from higher income groups who were relatively less affected. A second study that surveyed a random non-purposive sample is the NCAER Delhi Coronavirus Telephone Survey (DCVTS) which also allow us to track the recovery of employment after the nationwide lockdown was lifted in June.1 This survey reported that only 32 per cent of casual workers reported having work in April and May. However, by June this had gone up to 62 per cent. The corresponding numbers for the self-employed are 36 per cent and 76 per cent. However, even within the 62 per cent of casual workers who were employed in June, nearly half reported finding work only with difficulty in the month of June.
Using the CMIE-CPHS panel, Bertrand et. al. (2020) find that although unemployment rates returned to pre-lockdown levels by October 2020 and theworkforce participation rates was between 37 to 38 per
cent, which is about two to three percentage points below pre-lockdown levels. Total income per capita in June 2020 had fallen by nearly a quarter compared to the June 2019 income, with the fall being driven predominantly by a fall in labour income. Deshpande (2020) reports larger absolute losses in
employment for men compared to women in April. However, by August 2020, while employment had recovered for men, compared to the baseline period, the likelihood of for women to be employed in August was 9.5 percentage points lower than that for men.
World Bank (2020) also use the CMIE panel data to explore the impact on employment and the subsequent recovery of the labour market. They find that 43 per cent of those employed in December had lost employment by April. However, by August 2020, 95 percent of the December workforce were back in employment. However, this recovery was accompanied by huge transitions of the workforce into informal employment, particularly self-employment, with nearly 30 per cent of those who had formal jobs in April becoming self-employed in August. Using regression estimates, they find that informal workers were especially vulnerable to employment loss compared to formal workers, even after controlling for industry of employment, occupation type and location.
Our findings are in broad agreement with the CPHS-based studies quoted above. But we go beyond these studies by constructing a December-April-August panel and investigating the complete set of employment trajectories as well as how they differ by social identity and employment characteristics.
We also compare the trajectories for the same cohort of workers over the same period in the previous year, i.e. December 2018, April 2019 and August 2019 to understand to what extend the post-lockdown trajectories and transitions are unusual.
Before concluding this section, we note that these large dis-employment effects are not unique to India.
Most economies with precarious and informal job relations, have been similarly impacted in terms of massive loss of livelihoods, with the impact being higher for socially disadvantaged groups. For example, Jain et al (2020) found a 40 percent employment loss in South Africa due to Covid lockdown, with the impact being much higher for the vulnerable groups. Further, Bottan et. al. (2020) analyse the impact of Covid-19 on seventeen developing economies across Latin America and the Caribbean and find a disproportionately higher impact on those in lower income groups and for countries with high levels of informality. Additionally, Che et al (2020) document the high rates of job loss among the migrant workers in China and find that the job loss was much higher for high educated and low skilled workers.
These findings of differential impacts are not limited to the developing economies. Several studies measuring the Covid-19 impact on the US labour markets document the significantly higher impact of the pandemic on people of colour, who, in turn, were more likely to be employed in relatively insecure jobs (see, for example, Fairlie 2020; Couch et. al., 2020). The widening of the pre-existing structural inequalities in the economy due to the pandemic appears to be a uniform finding across various economies.
3. Data and methods
3.1 CMIE-CPHS data and the “trajectory panel”
The Centre for Monitoring Indian Economy (CMIE) has been conducting the Consumer Pyramids Household Survey since 2014. The survey collects information on demographics, employment status including industry and occupation, income, consumption, and assets. Over the years, further questions on time-use and more details on occupation and employment arrangements have also been added.
Every household in the sample is interviewed once every four months, i.e. thrice in the year. The first
“wave” of the year lasts from January to April. The same households are re-visited from May to August (wave 2) and September to December (wave 3). Further, the composition of households within the months of a wave remains unchanged across waves. So, if a household is interviewed in the first month of wave one, it will be interviewed next in the first month of the second wave, and again, in the first month of the third wave.
For the lockdown month of April 2020, the CMIE-CPHS transitioned from a door-to-door to a phone survey. This resulted in a significant reduction in sample size. The number of individuals for whom data are available falls from approximately 1.8 lakh in December 2019 to about sixty thousand in April 2020.
This April 2020 sample serves as the “anchor” for our analysis. These were the households who were interviewed during the lockdown. In order to construct a panel to analyze the impact of the lockdown and the subsequent recovery of households, we would like to follow the same household prior to the lockdown, during the lockdown, as well as after the lockdown. Choosing the April 2020 sample as the anchor allows us to do this. We select those pre-lockdown and post-lockdown months of the CMIE-CPHS panel in which the same sample of April 2020 households were interviewed. These months are
December 2019 (pre lockdown) August 2020 (post lockdown). Further, in order to do understand to what extent patterns observed during this period are anomalous vis-à-vis ‘normal’ times, we construct a
a baseline for these households. The baseline is comprised of these same sample of households but in the same period in the previous year, i.e. the months of December 2018, April 2019 and August 2019.
In order to make our analysis representative at the national level, we employ sampling weights. The CPHS data provides individual sampling weights at the wave level, and not at the month level. However, for the purposes of this study, we need to produce monthly estimates. So, in this analysis, we use the wave-level weight for our monthly analysis. This is justified for two reasons. First, we conducted several robustness checks using different weights, where we generate month level estimates using wave-level weights compare it with CMIE’s own month-level estimates (using its internally computed month-level weights). Appendix 1 details these checks and our justification for the weights we have used. Second, as we elaborate below, the sample composition (states, rural-urban, social groups) is comparable for each month with the entire wave. Hence for the purpose of this analysis, we have used the member weights for individuals above 15 years of age for all India-estimates with the corresponding correction for non- response.
To analyze impact of and recovery from the Covid-19 lockdown, we construct a panel that follows households in December 2019, through the lockdown month of April 2020, till post-lockdown in the month of August 2020. We call this the trajectory sample. Since we are specifically interested in what happened to the workforce during the lockdown, we restrict our sample to only those individuals who were in the workforce in December 2019. Our analysis seeks to answer the following questions: What was the overall loss of employment and recovery in this period? Did this aggregate effect change with demographic characteristics such as gender, religion, age, and caste? Does the effect depend on the nature of employment (self, casual, regular), level of education, or industry of employment? Whether individuals who recover employment in August, do not face a job loss in April, remain in the same employment arrangement or industry they were in case prior to the crisis or do they transition to some other employment arrangement or industry?
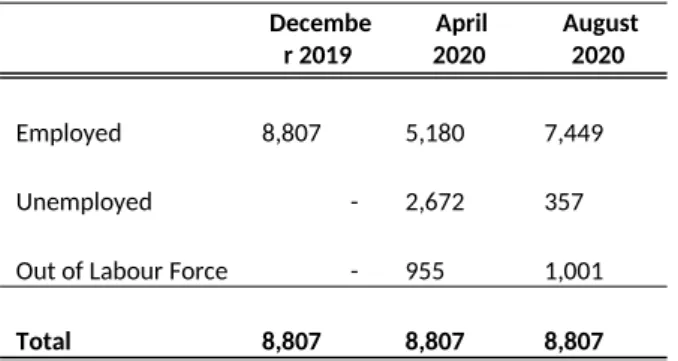
As mentioned earlier, here the sample is restricted to those who are in the workforce in December 2019 and for whom we continue to have information for in April 2020 and August 2020. The final sample consists of 8807 individuals. Table 1 shows the breakdown of this sample by broad employment category. The “unemployed” category combines the categories of “unemployed, willing and looking” as
well as “unemployed, willing, not looking.” Those individuals who report a status of unemployment, not willing, not looking” are classified as being “out of the labour force.”
Before we present the results, we consider the question of sample selection. There are two levels of selections operating on our sample. First, only those households from December 2019 become part of the sample, who are part of the April and August 2020 reduced samples. Second, we are only interested in those individuals who were part of the workforce before the crisis. The second selection is motivated by the research question; however, the first one can introduce unintended bias. The question that arises is, how does the phone-survey sub-sample compare to the entire sample? We investigate this by asking how the April and August-conditioned December workforce, i.e. the “trajectory sample”, compares to the entire December workforce as well as the entire workforce of that wave, i.e. wave 3 of 2019.
Table 2 shows the profile of the trajectory sample in terms of social identities and employment arrangements and compares it with the total workforce in December (irrespective of whether they are in the trajectory sample), as well as the workforce in the “wave” from which this sample is taken (Wave 3 of 2019). We see that the composition of individuals in our selected sample (in terms of social
identities and employment arrangements) is not different than the December workforce or from the overall workforce of that wave.6 The workforce in December 2019 largely comprised men (91 percent).
SC/STs and OBCs account for 33 percent and 40 percent of the workforce, respectively, while Upper Caste groups account for 20 percent. Approximately six percent of workers were Muslims. Nearly half the workforce was self-employed. This distribution is similar to what we observe in the trajectory sample.
3.2 Absolute workforce calculations
Absolute estimates of employment are generally derived from sample surveys (such as the PLFS or CPHS) by multiplying survey ratios such as the worker to population ratio by appropriate population projections. The accuracy of the projection determines the accuracy of the estimate (Nath and Basole 2020). Recently new population projections have become available from the National Commission on Population, which enable us to calculate reliable estimates of the absolute workforce for 2019 and 2020.
We use population estimates from the official projections (usually available for March 1st of a given
6 We tested for significance of difference between the mean estimates from each sample. Differences were found to be insignificant at the 1% level.
year) and extend them to the 1st of the month in question. The working age population is defined as everyone aged 15 years and older.
3.3 Regression analysis
We estimate two models. In the first regression, we estimate how the likelihood of loss of employment i.e., for those in employment in December 2019 (pre-lockdown) and losing employment in April 2020 (during-lockdown) or in August 2020 (post-lockdown), varies with the social, demographic, and economic characteristics. Next, we estimate how, upon having lost employment during the lockdown, the likelihood of regaining employment between April 2020 (during-lockdown) and August 2020 (post- lockdown) varies with these characteristics. We use a binomial logistic regression for this estimation, with state fixed effects. Standard errors clustered at the state level.
For estimating the likelihood of loss of employment, the categorical dependent variable takes the value 1 if an individual was in the workforce in December 2019 but lost work in April 2020 or in August, and zero otherwise. We report two specifications. The independent variables in first specification include gender, caste, religion and age (social and demographic characteristics). In the second specification, we also include economic characteristics, such as employment arrangement, education, household income, and industry, household income and location (rural or urban). Both models include state-level controls.
Using this approach, we address the question: how does the likelihood job loss change for an individual when only demographics are taken into account, and how does this change after we control for
employment arrangement, education and industry. All results are reported in terms of odds ratio, with any value greater than one indicating that the likelihood of job loss is higher for the non-base category relative to the base category. to suffer job loss.
For the regression analysis, keeping sample size restrictions in mind, we aggregate industries into seven broad categories. These are agriculture, manufacturing (including heavy machines, pharmaceuticals, and other smaller manufacturing industries such as handicrafts, food and textiles), construction, surplus services (trade, non-professional service, travel and tourism, hotels and restaurants), modern services (public administration, defence, media and publishing, financial services and professional services) , health and education (Appendix 2 provides further details of the industries under each category).
Next, we estimate the how likelihood of recovering employment post-lockdown (i.e., in August 2020) those who lost employment during the lockdown varies with these characteristics. Here, the categorical dependent variable takes the value 1 if an individual lost work in April and also reported being out of work in August, and takes the value 0 if an individual lost work in April returned to employment by August 2020. The covariates remain the same as in the first model.
We estimate similar regressions for the baseline cohort, i.e. the same households during the same period in the last year in order to estimate to what extent these relations between social identities, employment characteristics and the likelihood of job loss and recovery differ from what is observed during a baseline ‘normal’ period.
4. Absolute decline and recovery of employment during the lockdown and after
Since the CMIE-CPHS is the only nationally representative data on employment available for this period, it allows us to assess the overall absolute loss in employment and the recovery.
An important caveat here is that women’s labour force participation, which, in general, is low in India as measured by NSSO surveys, is even lower as measured in the CMIE data (see Appendix 3 for a discussion on the comparison of women workforce as measured by CMIE and by NSSO-PLFS). The pre-Covid workforce participation rate for women was a mere 9 per cent as opposed to 20 per cent in the NSS- PLFS data. The male WPR rates in the CMIE data are also lower than those measured in the PLFS, but only marginally so (67 per cent versus 70 per cent). An exploration of the causes of this divergence lies outside the scope of the present study. We refer the reader to Abraham and Shrivastava (2020) on this issue.
Another thing to note is that the work participation rate (WPR) is a more reliable indicator of labour market health in such a period, than the unemployment rate, since a significant proportion of workers (in particular women) are likely to report themselves as being out of the labour force and therefore will not be counted in the unemployment rate.7
7 See this CSE blog post for a detailed discussion.
We find that the male WPR fell from 66.6 per cent in December 2019 to 46.9 per cent in April 2020. The corresponding numbers for women are 9.15 percent to 5.2 per cent. We estimate the absolute loss of employment between December 2019 and April 2020 and recovery of jobs between April 2020 and August 2020. For calculating absolute levels of employment, we multiply CPHS-derived work
participation rates (WPRs) with projected working age population as of the 1st of the month in question (e.g. 1st April for the April WPR), as described in Section 3.
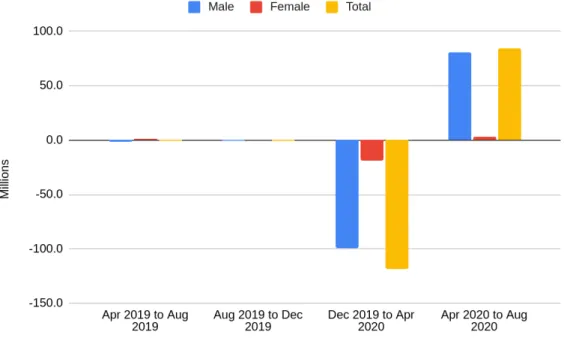
We find that the absolute employment loss of nearly 100 million for men and 19.3 million for women. In proportionate terms, male employment fell by 30 per cent of its pre-lockdown level while female employment fell by 43 per cent (Figure 1a and b). Thus, while the percentage point fall in male WPR and hence the absolute loss of male jobs is much larger than for women, in proportionate terms women were much more badly hurt during the lockdown.
By August, the male WPR was back to 62.5 per cent but the female WPR was still a low 5.8 per cent indicating a very tepid recovery for women. In absolute terms, while male employment recovered sharply, and 80 million of the 100 million jobs lost were back by August 2020, a mere 3 million of the 19 million jobs lost for women were back by August.
Examining the labour force transitions directly between December and August, conditional on the December employment status, we find similar results. Nine out of every ten men who were in the workforce in December were employed in August as well. In contrast, only four out of ten women who were in the December workforce were employed in August. More than half the women who were working in December had entirely withdrawn from the labour market. Additionally, 65 per cent of women who were seeking employment in December had also withdrawn from the labour market in August.
Finally, note that the changes between December 2019 and April 2020 as well as April 2020 and August 2020 stand out clearly relative to the transitions in and out of employment during the ‘normal’ period.
(i.e., from April 2019 to August 2019 and from August 2019 to December 2019).
Next, we look at the likelihood of employment loss and recovery conditional on the type of employment that an individual was engaged in, prior to the pandemic, i.e., in December 2019. Wage workers are categorised in salaried workers including permanent salaried workers and temporary salaried workers.
Another category of wage workers are daily wage workers or casual worker. Finally, individuals may be
self-employed running their own enterprises or businesses, with or without hired help. These correspond roughly to the National Sample Survey Organisation’s categories of own-account and unpaid workers (self-employed), casual wage workers (daily wage), and regular wage workers
(permanent and temporary salaried). According to the CMIE-CPHS, permanent salaried work is the most secure employment arrangement, followed by temporary salaried employment. Next in the hierarchy, in terms of secure employment, is self-employment. Finally, daily wage or casual wage work is the least secure employment category.
The WPR for April showed the sharpest drop for daily wage workers. Only 40.7 per cent of those employed in December 2019 reported being employed in April 2020. This was followed by temporary salaried (60.1 per cent), self-employed (70 per cent), and permanent salaried who were the least affected, as expected (71 per cent). The recovery however, follow a somewhat different pattern. Casual workers, who were worst affected, also showed a quick bounce back once the lockdown was lifted, and WPR for daily wage workers was back to 81.4 per cent of its pre-Covid level by August 2020. On the other hand, the recovery was slower for temporary salaried workers (78 per cent of pre-Covid levels by August). Recovery was the strongest for the self-employed (who are in control of their own work) and the permanent salaried, viz. 87 per cent for both.
To sum up, in proportionate terms, loss of work was the sharpest for women and for casual wage workers. Men, particularly those who had permanent salaried jobs or were self-employed were
relatively less affected. Further, the recovery was also much faster for men relative to women, at least in the restricted sense of finding work, as well as for casual wage, self-employed, and permanent salaried workers, as opposed to temporary salaried workers.
This difference between temporary salaried workers and the rest is worth exploring further since it points to a peculiar vulnerability on the part of workers who may be in the organised sector on informal work arrangements.
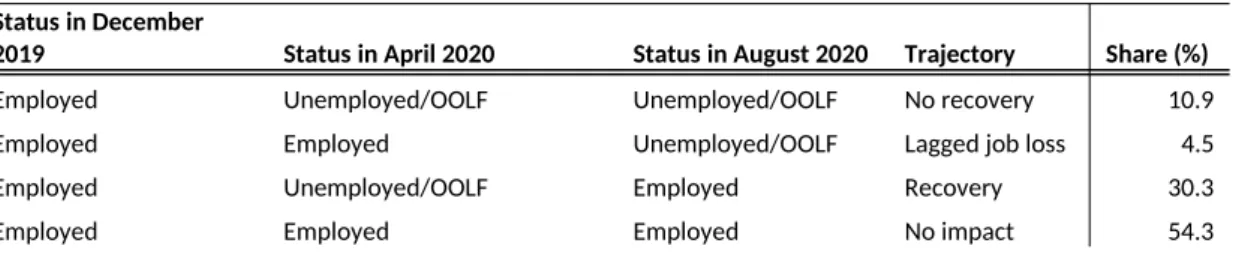
5. Trajectories of Employment
We now focus our “trajectory panel.” We examine the trajectory of employment for individuals who were employed in December 2019, i.e., prior to the economic lockdown. Based on their subsequent employment status during the month of the lockdown, and their employment status after the lockdown was lifted, an individual employed in December 2019 can show one of four possible trajectories:
(i) They remain employed during lockdown (April 2020) and post lockdown (August 2020). We refer to this as the ‘no effect’ trajectory;
(ii) They are unemployed during the lockdown and continue to be unemployed even after the lockdown is lifted (i.e., in August 2020). We refer to this as the ‘no recovery’ trajectory;
(iii) They are unemployed during the lockdown and are employed post the lockdown. We refer to this as the ‘recovery’ trajectory;
(iv) They are employed prior to the lockdown, continue to be employed during the lockdown, but are unemployed post the lockdown. We refer to this as the ‘delayed job loss’ trajectory.
5.1 Aggregate effects
We find that around 54 percent of workers followed the ’no effect’-quo trajectory, i.e. were employed prior to, during, and post the lockdown (Table 3). Around 30 percent of our sample followed the recovery trajectory, whereby while these individuals were unemployed during the lockdown, they were able to find employment post the lockdown. Notably, about 11 percent of the December workforce lost employment in April and continued to be unemployed post the lockdown in August 2020, i.e., followed the no-recovery trajectory. Finally, a small share of workers, 5 percent, followed a lagged job loss trajectory, such that although they continued to be employed during the lockdown, they were unemployed subsequently, by August.8
We compare how these trajectories panned out during the same period in the previous year for this sample of households. Out of this sample, we consider those who were in the workforce in December 2018 and follow their employment paths in April 2019 and August 2019 to construct these employment trajectories. During this baseline period, 96 percent of workers followed a ‘no effect’ trajectory, with their employment status remaining unchanged over the subsequent two periods. Less than one percent faced a job loss without any recovery, while 1.2 percent lost jobs in April but returned to work by August.
Therefore, the extent of displacement in the labour market between December 2019 to August 2020 is in fact unusual. Despite this, about 85 percent of the December workforce were able to return to their
8 In this analysis, to arrive at nationally representative distribution of individuals in each trajectory, we use weights pertaining to December 2019 (Wave 3 of 2019), i.e. the starting point of the trajectory sample. However, we have also estimated using weights from the terminal period of the trajectory, i.e. August 2020 (Wave 2 of 2020) as a robustness check and all results remain largely unchanged. For all subsequent analysis, the starting point weight has been used (i.e. weights for Wave 3 of 2019).
pre-lockdown status of being in employment. However, these overall averages hide substantial variation across key social, economic, and demographic characteristics such as gender, caste, religion, age and type of employment. In the next section, we examine how the likely pathways differ significantly when disaggregated by social identities and employment characteristics.
5.2 Differential impact by gender, caste, and religion 5.2.1 Gender
Disaggregating trajectories by gender, we find that men and women have very different experiences in terms of loss of employment during the lockdown as well as in terms of the subsequent recovery. First, while 59 percent of men who were employed in December were unaffected in terms of employment both during and post the lockdown, the corresponding percentage of women following this ‘no effect’
trajectory was merely 16 percent. Second, 29 percent of men employed prior to the lockdown, followed a recovery trajectory, i.e., gained employment post-lockdown after having lost it during the lockdown, in contrast to 24 percent women. Third, women were also more likely to follow a delayed job loss
trajectory, with 11 percent of those women who were employed prior and during the lockdown, losing jobs post the lockdown, relative to only 4 percent men (Figure 2). Finally, and most strikingly, while 8 percent of men who were employed prior to the lockdown remained unemployed during and after the lockdown period, i.e., they followed the no-recovery trajectory, the corresponding share for women was 50 percent.
Restricting the sample to only those who lost employment during the lockdown, i.e., in April 2020, we find that men were nearly four times more likely to recover than not recover (approximately 29 per cent versus 8 per cent), while women were nearly twice as likely to not recover as recover (approximately 50 per cent versus 24 per cent). That is, given employment loss during the lockdown, on average, men were almost eight times more likely than women to regain employment post the lockdown.
During the same time in the previous year, 97 percent of men experienced the ‘no effect’ trajectory, working in December 2018 and continuing in employment through April 2019 and August 2019. For women, the corresponding share was 87 percent. While there was greater flux among women
compared to men even during ‘normal’ times, this was not at the same scale seen during the pandemic.
Our results demonstrate, very starkly, the severely gendered effects of the lockdown. While the general understanding has been that the lifting of restrictions on mobility and economic activity across most parts of the country would enable those who had lost work to return to work, we find that this is true only for men. Most women who were employed prior to the lockdown were either unemployed or had withdrawn from the labour force in August.
Possible reasons for this gender disparity can be attributed both to the supply side as well as demand for women’s work. On the supply side, increased burden of household work, lack of childcare options and shutdown of schools have meant that most women are forced to stay at home, as well as spend more time in care and other unpaid activities. Deshpande (2020) confirms muted employment recovery for women with young children. Further, continued difficulties with mobility may also hinder women from returning to work. On the demand side, it is likely that employment arrangements as well as industries where women are overrepresented were more severely affected. In the face of an overall decline in labour demand, this, alongside gender norms that ensure that scarce economic opportunities flow to men in preference to women, thereby constraining women’s (re-)entry into the labour market.
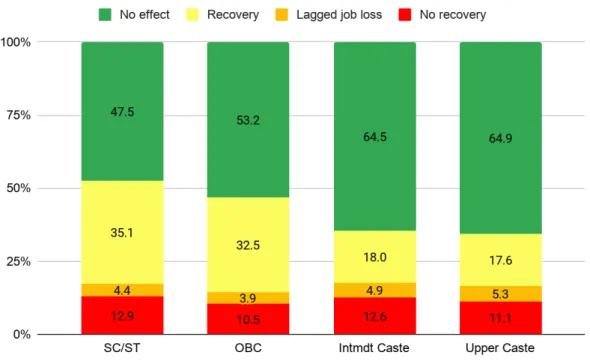
5.2.2 Caste
We also find prominent caste effects, albeit not as pronounced as those observed for gender (Figure 3).
Lower caste groups (SCs, STs, and OBCs) were more likely to be affected in terms of employment loss than upper and Intermediate castes. 67 and 62 per cent of individuals in the upper and intermediate groups respectively, and 54 and 49 percent of OBC and SCs/STs groups respectively, followed the no effect trajectory. However, conditional on losing jobs, SCs/STs and OBCs were also more likely to recover relative to the forward caste individuals. Having lost employment, SC/ST and OBC individuals were nearly three times more likely to recover than not recover, as compared to around 1.5 for upper castes.
This suggests a higher degree of volatility for these caste groups where higher volatility is reflected in high rates of exit from as well as entry into employment. This is might also suggest that these caste groups have a higher likelihood to be employed in employment arrangements characterised by a relative ease of entry but also higher precarity.
5.2.3 Religion
We explore the differential impact of religious identity on employment trajectories. Here the differences are least pronounced, but they do exist (data not shown). Among three caste groups (Hindu, Muslim, and others), Muslims were most likely to have lost employment either during or post the lockdown, following either the recovery, no recovery or the lagged job loss trajectory. We find that about 48 per cent of Muslims followed these trajectories, compared to 44 per cent Hindus (and 50 per cent for other religious minorities).
However, it should be noted that upon having lost employment in April, Muslims were more likely than Hindus (and other religious minorities) to regain employment post the lockdown in August, i.e., follow the recovery trajectory rather than continuing to be out of the workforce. As a result, while the proportion of Hindus and Muslims employed post the lockdown was similar (in fact slightly higher for Muslims), with 87 percent of Muslims and 84 percent of Hindus having employment, their experiences in the intervening period between December and August were distinct, with Muslims facing a higher volatility. As with lower caste individuals, this could partially be explained by Muslims having a higher likelihood to be employed in those employment arrangements that are more volatile and characterised by relative ease of entry. We are exploring these possibilities in ongoing work.
5.2.4 Age
We categorise the working population into four broad categories, the fresh entrants to the labour market, i.e., individuals between 15 to 24 years, the relatively more experienced between 25 to 34 years and those between 35 to 44 years, and finally, those 45 years and above (Figure 4). The older workers, particularly those in the 35 to 44 age group were least effected in terms of job loss, with 62 percent belonging in the ‘no effect’ trajectory. In comparison, only 30 percent of young workers (between 15 to 24 years) belonged to the ‘no effect’ group. In fact, the youngest workers were most likely to
experience a ‘permanent’ job loss, losing employment in April and not returning to work even in August.
34 percent of workers between 15 to 24 years experienced this trajectory compared to approximately ten percent in the 25 to 34 age category and seven percent in the 35-44 age group. Further, having lost employment during the lockdown, the older workers were four times more likely to return to
employment in August compared to the 15 to 24 year old workers. Therefore, the lockdown not only
had immediate job loss effects among the younger population, unlike the older workers, their job loss was not of a transitory nature.
5.3 Differential impacts by Employment Arrangement
CMIE-CPHS classifies workers into four broad types of employment arrangements: permanent salaried work, temporary salaried work, self-employment and daily wage work. Permanent salaried employment is the most secure, followed by the temporary salaried work and the self-employed. Daily wage
employment is the least secure of employment arrangements. Examining the types of occupations that fall under these different arrangements gives a better understanding of this categorisation. Permanent salaried workers include teachers, industrial workers, clerks, public administration personnel and white- collar professionals. Temporary salaried workers include factory floor workers, drivers, sales workers, domestic help and other support staff with the majority being employed in retail trade, personal non- professional services, and travel and tourism. Daily wage casual workers consist of agricultural labourers, mazdoors/helpers and manual workers like masons, bricklayers and construction workers, predominantly engaged in the agricultural and construction sectors. The self-employed included farmers, petty shop owners, owners of small businesses and vendors.
We find that permanent salaried workers, as expected, were most likely to not experience any change in employment with 68 percent following a “no effect” trajectory. This was followed by 64 percent of self- employed, 55 percent of temporary salaried and 36 percent of casual wage workers (Figure 5). The impact therefore is along the expected lines, with the most secure forms of employment being relatively least affected as a result of the lockdown. That said, it is important to highlight that more than a third (36 per cent) of permanent salaried workers (the most secure form of employment) were affected by the lockdown in some way.
In contrast, upon having lost employment, casual wage workers had the highest likelihood of regaining employment by August, with 73 percent returning to employment. As mentioned earlier, this volatility could be indicative of ease of firing as well as ease of hiring in the casual wage market.
5.4 Differential impact of industry of employment
As a result of the extreme mobility restrictions imposed during the economic lockdown and the nature of the pandemic, it was expected that certain industries that were unable to operate would witness
higher employment losses than others. Once mobility restrictions were lifted, some of these industries were able to return to pre-crisis employment levels depending on other factors, including supply chain restrictions, demand, and worker availability. At the same time, some industries like agriculture or small-scale trade activities are expected to become ‘sink’ sectors absorbing those seeking to reenter the labour market but not finding employment in their preferred industries.
In this section, comparing the trajectories across broad industrial categories, we look at how industries were affected in terms of job loss and their subsequent recovery. One main finding is that, as with employment arrangements, a ‘recovery’ is significantly characterised by an increased importance of
‘sink’ or fallback sectors.
We broadly classify industries into agriculture, heavy manufacturing (machinery, metals,
pharmaceuticals, utilities, mines, chemicals, automobiles), food, craft, and cosmetics (food, handicrafts, soaps, detergents, cosmetics and toiletries manufacture), leather and textiles (including footwear), construction, public administration, trade (including wholesale and retail trade, hotels and restaurants), health , education, personal professional services-IT-ITES, and personal non-professional services. The industries that form a part of each sector are given in the Appendix 2.
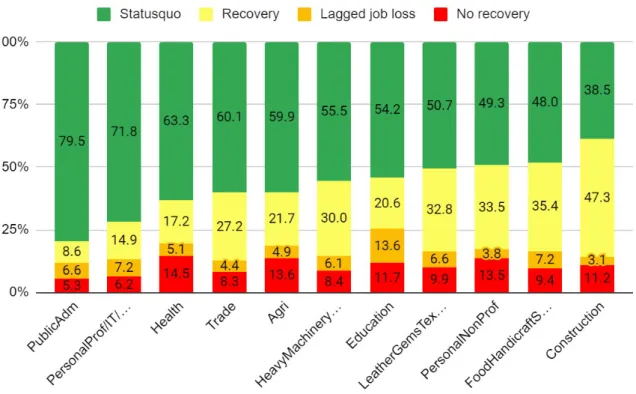
Individuals in public administration faced the least volatility in employment with nearly 80 percent of workers in this sector following a “no effect” trajectory. The sector also witnessed a relatively better recovery, with only 5 percent of those employed in this sector prior to the lockdown witnessing a relatively permanent job loss and being unemployed post the lockdown (Figure 6).
The construction sector witnessed the highest volatility in employment status. Only 39 percent of construction workers were able to retain employment through the entirety of the period. However, it was also the industry that experienced the highest recovery, with 47 percent of construction workers having lost their jobs in April, returning to work by August. A part of this might be explained by the predominance of casual wage employment in the construction sector, an employment arrangement that followed a similar trajectory (high impact and high recovery) over this period.
Personal and non-professional services, mainly comprising operators of small-scale enterprises such as tailors, dressmakers, petty shopkeepers, barbers and beauty-parlour owners, as well as domestic helps
and part-time workers also witnessed relatively high volatility compared to other sectors. About 49 percent of those employed in this sector were unaffected by employment loss. About 34 percent followed a recovery trajectory, and 14 percent witnessed a relatively permanent job loss, i.e., being unemployed post the lockdown.
While 63 percent of those in the health sector were not affected by employment loss, this was also a sector where having lost employment, the likelihood of recovering from the job loss was amongst the least compared to other sectors. So for those in this sector who lost jobs, the job loss was relatively more permanent in nature relative to other sectors.
6. Correlates of job loss and recovery
We use a binomial logistic regression to estimate how the job loss and the recovery varies with the social, economic, and demographic characteristics.
6.1 Employment loss
The categorical dependent variable takes the value 1 if an individual was in the workforce in December 2019 (pre-lockdown) but lost work in April 2020 or in August 2020 (post-lockdown), and 0 otherwise.
The set of independent variables in the first specification includes social and demographic characteristics - gender, caste, religion, age, and state-level controls. The second specification additionally controls for the economic characteristics – employment arrangement, education, industry, household income and location (rural / urban) – to assess how the variation across social identities changes upon controlling for these characteristics.
The results are shown in Figure 7 (left panels). Figures 7a and 7b show the effects of demographic variables without (blue) and with (red) employment and other controls. FIgure 7c shows the odds ratios for the employment variables. The base categories for the categorical variables are shown in
parenthesis. Detailed regression results are in Appendix 4.
The main results are as follows. First, as found in the descriptive statistics, the differential impact for men and women remains significant even after controlling for other factors. On average, after
controlling for other characteristics, women were nine times more likely to lose employment during the
lockdown as compared to men (Figure 7a) (Specification 1). However, this effect diminishes only marginally (to eight times) when we control for their economic characteristics, such as nature and industry of employment (Specification 2). Thus, within each employment arrangement, education level and industry, women were far more likely to lose work as compared to men. We speculate on some reasons for this in the Discussion section.
There is also a strong age effect visible in the data. Younger workers were 6.5 times more likely to lose work compared to workers in the age group 35-44. As with gender, this effect is more-or-less unaltered after including economic characteristics.
Unlike the gender and age effects, the caste effect is contingent on employment variables. The effect is also much weaker. Controlling only for demographic factors, lower castes (SC/STs) are 1.7 times more likely to lose employment compared to upper castes (Figure 7b) (Specification 1). However, on controlling for the employment variables this effect is no longer significant (Specification 2) . This suggests that the relatively greater likelihood of these caste groups losing work during the lockdown, vis- a-vis upper castes, is explained by the differences between these caste groups in their employment arrangement, levels of education or industry (We explore this further in an on-going work). The effects for OBCs, although in the same direction, are not statistically significant.
As with SC/ST individuals, Muslims are around 1.7 times more likely to lose work than Hindus (Specification 1). However, this effect is no longer significant after including employment variables (Specification 2).
To sum up the findings on social identities and job loss, the dominant effects are seen for women and younger workers, who are far more likely to have lost employment in April compared to men and older workers, even after controlling for the nature and industry of employment. The caste and religion effects seem to be explained by the differences between social identities in terms of the type of work they do (permanent salaried versus daily wage, for example) or the industry they work in (which may have been more or less affected by the lockdown).
The level of education is also a significant factor in determining likelihood of job loss. Compared to graduates, as expected, less educated workers were 1.4 to 1.6 times more likely to lose work (Figure 7c).
Next, in terms of economic characteristics, we find that the individual’s employment arrangement appears to be an important variable to explain the likelihood of employment loss. After controlling for industry and other attributes, daily wage workers, temporary salaried workers and the self-employed were all significantly more likely to lose work than the permanent salaried. The worst affected were daily wage workers (3 times more likely to lose work compared to permanent salaried), followed by the self-employed (1.6 times) and the temporary salaried (1.4 times) (Figure 7c).
Further, all industries were more likely to suffer job loss compared to the baseline category of public administration and professional services. However, on controlling for employment arrangements, only health and education still remain significant at 1.7 times more likely to suffer job loss.
Finally, workers in rural areas were less likely to suffer employment loss compared to their urban counterparts resonating with similar findings from other surveys that we mentioned in Section 2. As household incomes increased, individuals from such households were less likely to face employment loss.
6.2 Employment recovery
We next examine how the recovery post-lockdown varies with these characteristics. Here our sample is conditioned on an individual having lost work in April. The categorical dependent variable takes the value 1 if an individual lost work in April and also reported being out of work in August 2020. It takes the value 0 if an individual lost work in April and had recovered by August. As before, we estimate two specification; one with only social and demographic characteristics with state-level controls
(specification 1)and another with all these variables plus employment arrangement, education, and industry (specification 2), income and as well as a sector (rural / urban) control. Here the question is:
how does the likelihood of recovery vary with the social and demographic characteristics, and how does this change when we additionally control for their employment arrangement, education and industry.
The results are shown in FIgureFigure 7 (right panel). We report odds ratio whereby any value greater than one indicates that that the non-base category is more likely to not recover from employment loss in April, compared to the base category Gender remains highly significant for explaining the recovery,
with women seventeen times less likely to recover than men. Moreover, this effect is unchanged with the inclusion of economic characteristics. =
As with job loss, age also remains another significant factor, with youth (15 to 24 years) 16 times more likely to not recover than older workers (35-44 years).
Socially disadvantaged caste groups (SC/ST) are more likely to recover as compared to upper caste groups and this effect remains significant even with the inclusion of employment arrangement, industry, and education level (Figure 7b). This suggests that the higher likelihood of recovery for the socially disadvantaged group cannot only be explained on the basis of being employed in more precarious forms of employment). Rather, some other factors may be at work, including greater distress and, higher loss of income with households facing higher loss more likely to return to work sooner.
Interestingly, we find that the initial income level of the household in December did not have a significant impact on the likelihood of recovery.
The only other significant variable is the level of education. Less educated workers show a greater likelihood of recovery compared to graduates controlling for demographic and employment variables.
This may also indicate an income effect of the kind indicated above for caste (Figure 7c).
Unlike what was seen in the case of job loss, employment arrangements do not significantly determine the likelihood of recovery/no recovery. Rather, permanent salaried workers (who previously had an advantage of less likelihood of job loss) were now just as likely as other workers to not recover their jobs.
We also estimate these regressions for the same cohort of individuals in pre-pandemic period, i.e., the baseline sample. Regression results are presented in Appendix 5. While gender remains an important factor mediating the likelihood of job loss and recovery, the relative probability of job loss and non- recovery for women vis-à-vis men are far lower in the baseline period. Caste does not have a significant impact on the probability of job loss. Although non-recovery is significantly related to the caste, the direction of relation is the opposite of what was observed in the current period, i.e., marginalised caste groups were less likely to recover from employment loss compared to dominant castes. This indicates that the nature of recovery is different in the current period compared to the baseline. Age remains an
important factor determining the likelihood of job loss and recovery with young workers more
vulnerable to job loss compared to older workers. However, the scale of vulnerability of young workers to not recovering from employment loss is much higher in the current period than in the baseline.
Employment arrangements did not have a significant effect on recovery in the baseline, unlike in the current period. Finally, the industry of employment was unrelated to the likelihood of job loss and recovery in the baseline, whereas in the current period we observed that individuals in Modern Services were more likely to recover in comparison with other industries.
7. Nature of the recovery
We have seen above that a large share of workers were able to return to work in August, although the likelihood varied widely with social identity, type of employment, and industry. To characterize the nature of this recovery further, it is worth exploring, whether this recovery entailed a recovery into the same employment arrangements where these workers were employed pre-lockdown. For example, although 22 per cent of permanent salaried workers were able to return to employment by August having lost employment in April, they may or may not have returned as permanent salaried workers. To do this, we examine the changes in employment arrangements between December 2019 and August 2020.
To ensure that we capture the lockdown-driven variation in transitions, we first examine the baseline transitions across employment arrangements. We find that, unlike the aggregate WPR numbers, which do not change much from wave to wave, the employment arrangements, there exist substantial transition of workers across employment arrangements even before the pandemic. For example, between December 2018 and August 2019 (i.e. the comparable period last year), only 56 per cent of temporary salaried workers remained as temporary salaried in August. Nearly half of temporary salaried workers had moved into some other arrangement by August 2019. The corresponding proportion for daily wage workers is 75 per cent, 84 percent for self-employed workers, and 80.5 percent for
permanent salaried workers (Figure 7a). There is thus, a great deal of flux specially between temporary salaried work, daily wage work and self-employment even in the pre-Covid period (see Kesar, 2020 for an analysis of transitions across employment arrangements for 2005-2012 using the IHDS data).
However, the proportion of workers who report a transitions across employment arrangement during the period of our analysis (December 2019 to August 2020) is significantly higher for all categories, relative to the baseline (Figure 7b). The most striking aspect during this period are the large increases in the share of self-employment across all other employment arrangements. 40 per cent of individuals who were permanent salaried workers in December reported being self-employed in August 2020. The comparable number in the baseline period is 13 per cent. The corresponding numbers for daily wage workers are 42 per cent as opposed to 20 per cent in baseline. It seems likely that the higher proportion of workers reporting self-employment is a result of lack of work in their regular arrangements. Thus, self-employment emerges as the predominant fallback option in this period (Figure 7) followed by daily wage work (particularly for temporary salaried workers). Besides permanent salaried workers,
temporary salaried also experienced changes in their employment arrangements with 34 per cent moving to self-employment and 18 per cent moving to daily wage work by August.
These results clearly indicate that despite the recovery of employment between April and August, there is a shift in structure of the labour market towards informal work or fallback options.
8. Conclusion
The nature of the impact of the Covid-19 pandemic on the Indian labour market continues to be intensively studied by researchers and policymakers. Understanding the nature of the impact is critical to the introduction of policies that can mitigate the negative effects of employment loss and income loss. This paper contributes to this ongoing effort.
We have shown in the analysis above that an estimated 120 million workers lost work with the imposition of the lockdown in April. While the majority of men had recovered employment by August, this recovery was far muted for women. Of the 19 million jobs that women lost, only 3 million were recovered. Furthermore, younger workers as well as workers from SC/ST groups experienced higher likelihood of job loss compared to older and upper caste workers.
Although employment recovered by August, and most workers, particularly men, who had lost employment in April were back at work by August, there was considerable change in the nature of employment that these workers were now engaged in. Informal employment, in the form of self- employment and daily wage casual worker increased, presumably as a fallback option. Workers, who
were previously engaged in salaried work, were now employed in more precarious employment arrangements, increasing the levels of informality in the labour market.
The employment loss as well as transition to informal work indicate that households have potentially suffered income losses during this period. Our results strengthen the case for continued additional fiscal support in the form of MGNREGA and PDS, as well as additional cash transfers and a possible urban jobs scheme, to mitigate the effects of continued dis-employment and income loss.
References
Abraham, Rosa and Anand Shrivastava. 2019. “How Comparable are India’s Labour Market Surveys?: A comparison of NSS, Labour Bureau and CMIE Estimates.”, Centre for Sustainable Employment Working Paper #21, Azim Premji University, Bangalore.
Bertrand, M., Rebecca Dizon-Dross, Kaushik Krishnan, Heather Schofield. 2020. “Employment, Income and Consumption in India during and after the lockdown: A V-shape recovery?” Chicago-Booth Rustandy Centre for Social Sector Innovation.
Bhalotia, Shania, Swati Dhingra and Fjolla Kondirolli. 2020. City of Dreams no More: The Impact of Covid- 19 on Urban Workers in India, Centre for Economic Performance Paper No.008,
https://cep.lse.ac.uk/pubs/download/cepcovid-19-008.pdf
Bottan N., Hoffmann B. and Vera-Cossio, D.A. 2020. “Evidence from Seventeen Developing Countries”.
IDB Working Paper Series No. IDB-WP-1150.
Che L., Du H. and Chan K. W. 2020 Unequal pain: a sketch of the impact of the Covid-19 pandemic on migrants’ employment in China, Eurasian Geography and Economics, DOI:
10.1080/15387216.2020.1791726
Couch, Kenneth A. and Fairlie, Robert W. and Xu, Huanan. 2020. “The Impacts of COVID-19 on Minority Unemployment: First Evidence from April 2020 CPS Microdata“. Available at SSRN:
https://ssrn.com/abstract=3604814 or http://dx.doi.org/10.2139/ssrn.3604814
Desphande, A. 2020. The Covid-19 “Pandemic and Gendered Division of Paid and Unpaid Work:
Evidence from India”. IZA Discussion Paper No. 13815
Estupinan, Xavier and Mohit Sharma. 2020 Job and Wage Losses in Informal Sector due to the COVID-19 Lockdown Measures in India. Available at SSRN: https://ssrn.com/abstract=3680379 or
http://dx.doi.org/10.2139/ssrn.3680379
Fairlie R. 2020. “The impact of COVID 19 on small business owners: Evidence from the first three months‐ after widespread social distancing restrictions”. Journal of Economics and Management ‐
Strategy. Wiley Press.
Jain R., Budlender J., Zizzamia R., and Bassier I. 2020. “The labor market and poverty impacts of COVID- 19 in South Africa.”. Working Paper.
Kesar, Surbhi, Abraham R, Lahoti R, Nath P, and Basole A.. 2020. “Pandemic, informality, and
vulnerability: Impact of COVID-19 on livelihoods in India.” Centre for Sustainable Employment Working Paper #27, Azim Premji University, Bangalore.
Nath, Paaritosh and Amit Basole. 2020. “Did Employment Rise or Fall in India between 2011 and 2017?
Estimating Absolute Changes in the Workforce.” Centre for Sustainable Employment Working Paper #29, Azim Premji University, Bangalore.
State of Working India 2018. Centre for Sustainable Employment. Azim Premji University. Available at:
https://cse.azimpremjiuniversity.edu.in/state-of-working-india/swi-2018/
Subramanian A. and Felman J. 2019. “India’s Great Slowdown: What Happened? What’s the way out?”.
CID Faculty Working Paper No. 370. Centre for International Development, Harvard University.
World Bank. 2020. “Beaten or Broken? Informality and COVID-19.” South Asia Economic Focus (October), World Bank, Washington, DC. Doi: 10.1596/978-1-4648-1640-6. License: Creative Commons Attribution CC BY 3.0 IGO
Tables
Table 1: Changes in Employment Status of ‘trajectory’ sample
Decembe r 2019
April 2020
August 2020
Employed
8,807
5,180
7,449 Unemployed -
2,672
357 Out of Labour Force -
955
1,001 Total
8,807
8,807
8,807
Source: Authors’ calculations based on CMIE-CPHS unit level data.
Table 2: Comparing Trajectory Sample Characteristics with 2019 (Wave 3) and December Workforce
Sept-Dec 2019 Workforce
December 2019 Workforce
December 2019 Trajectory
sample
Sample Size 1,85,107 46,291 8,807
Women (%) 11 11 9
Rural (%) 68 65 64
SC/ST (%) 31 35 33
OBC (%) 40 39 40
Intermediate Caste (%) 9 8 7
Upper Caste (%) 18 17 20
Hindus (%) 86 88 90
Muslim (%) 9 7 6
Permanent Salaried (%) 11 11 11
Temporary Salaried (%) 10 10 10
Daily Wage Workers (%) 29 31 28
Self Employed (%) 50 48 51
Source: Authors’ calculations based on CMIE-CPHS unit level data.