2 1.2 Schematic diagram of an anaerobic-aerobic MBBR system used for oil refinery wastewater treatment (Lu et al., 2013). 3 1.3 Schematic diagram of activated sludge process and immobilized biological air filter for heavy oil wastewater treatment (Tong et al., 2013). 4 1.4 Schematic diagram of UASB reactor and PBBR reactor for oil refinery wastewater treatment (Nasirpour et al., 2015).
7 1.7 Schematic diagram of the anaerobic biofilm reactor and the aerobic biofilm reactor for the treatment of oil refinery wastewater (Li et al., 2017). 16 2.4 (a) Image of the white precipitated solid, (b) FESEM image of the white solid, (c) EDX spectra of the white solid, (d) image of the yellow precipitated solid, (e ) FESEM image of the yellow solid, (f) EDX spectra of the yellow solid. 46 5.1 (a) streaked culture, (b) gram stain results and (c) FESEM image of the hypoxic orange culture, (d) streaked culture, (e) gram stain results and (c) FESEM image of the hypoxic white culture .
50 5.5 (a) streaked culture, (b) gram stain results, (c) FESEM image of the aerobic red culture; (d) streaked culture, (e) gram staining results, (f) FESEM image of the aerobic yellow culture. Therefore, study of the two-step sequential systems for the treatment of petroleum refinery industrial effluent was considered. These hydrocarbons (mainly oil and grease type compounds) contribute to the COD of the effluent.
The total HRT of the system was kept at 108 h (72 h for anaerobic and 36 h for aerobic reactors). Most reported systems used for the treatment of petroleum refinery wastewater are of the aerobic type and less information is available on anaerobic and anoxic conditions.
Abiotic removals of the pollutants 107
Immobilized biomass (total, attached and suspended) per gram of the biomass support material (PUF) with respect to different influent hydrocarbons is summarized in Table 4.3. Similar trend of biomass distribution was observed and attached biomass in A1 was the least when crude oil was used as hydrocarbon. Sahariah and Chakraborty (2013) reported total biomass per gram of biomass support material (total 100g biomass support material) material as 1.1 to 1.2 during the treatment of phenol, thiocyanate and ammonia in anaerobic-anoxic-aerobic fed group sequential moving bed reactors.
Higher biomass concentration was observed in this study shows better growth of biomass inside the support material, while phenol, hydrocarbons, S2- and ammonia are degraded at high alkaline pH. Total biomass to packing material (alginate beads totaling 70 g) ratio of 0.24 to 0.26 was reported by Banerjee and Ghoshal (2016) during the biodegradation of real oil refinery wastewater.
Removal of organics 108
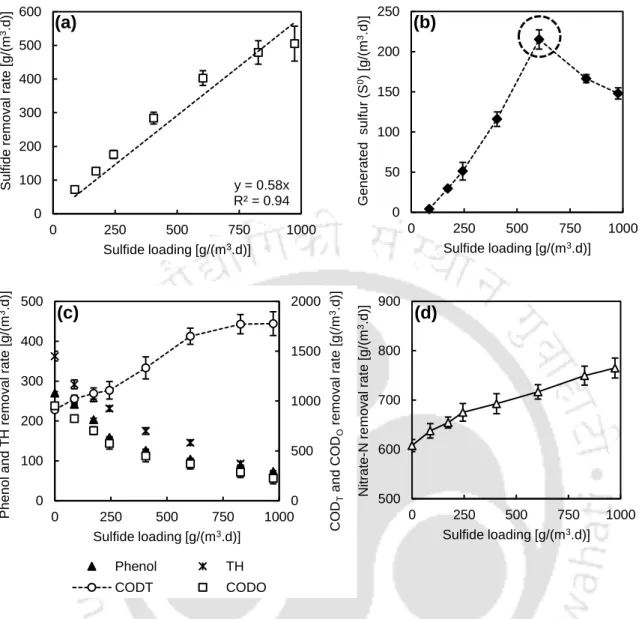
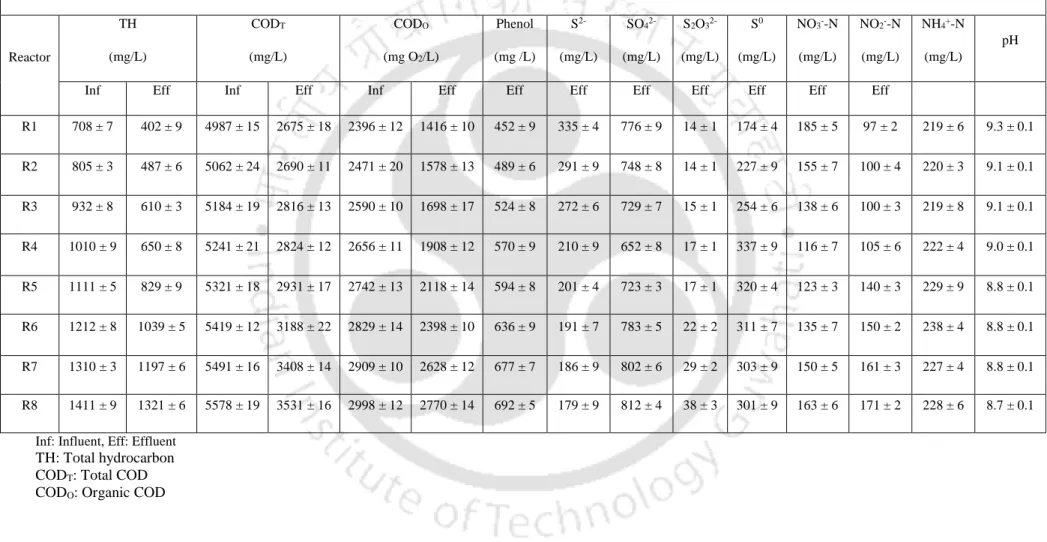
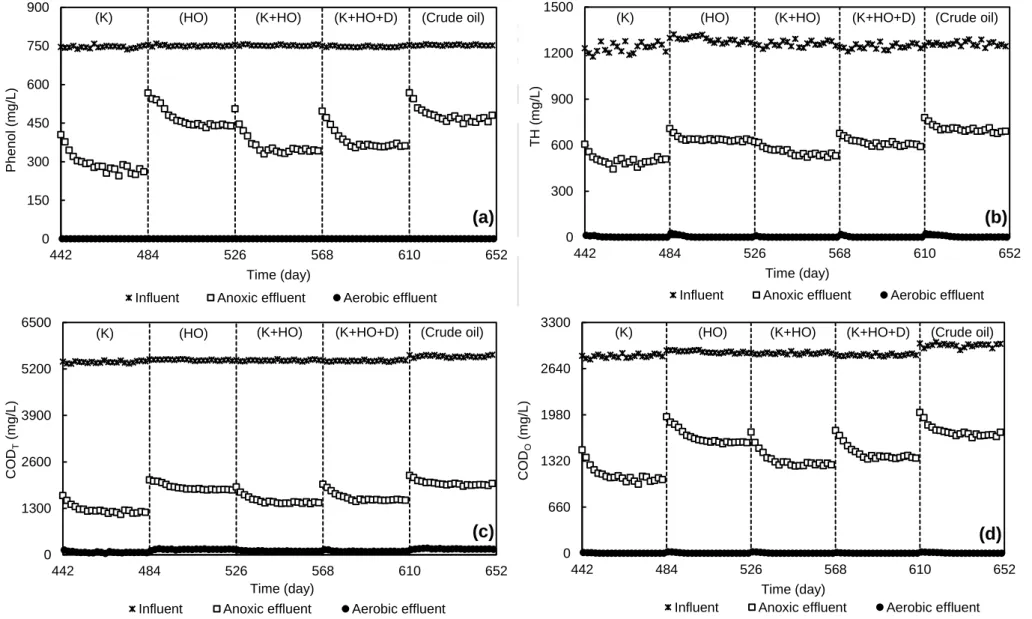
Similarly, the specific removals of CODT and CODO were lower in the presence of HO and crude oil (Figure 4.6b). The much lower utilization in this study was due to the high alkaline pH and the presence of phenol and S2- as a competing energy source available to the mixed microbial consortia. The biomass activity of a biological system shows the greatest capacity for organic degradation (McHugh et al., 2004; Hussain and Dubey, 2017).
Biomass activity of anoxic biomass decreased and aerobic biomass activity increased when HO and crude oil were used (Figure 4.6b). Aerobic biomass showed greater activity than anoxic biomass due to greater free energy change (Schink, 2006; Metcalf and Eddy, 2011). The specific CODO removal rate in the reactors was higher when the biomass activity was on the higher side.
Consequently, a direct correlation of biomass activity with organic degradation efficiency was confirmed and biomass activity can be used as a potential tool for predicting organic removal efficiency in bioreactors. Specific CODO removal from both anoxic and aerobic reactors was quite less compared to their respective biomass activity (Fig. 4.6b). Low specific removal rates in the present study were due to many toxic pollutants, high alkaline pH and presence of high biomass in the reactors.
Dextrose, being relatively benign, was used more efficiently by anoxic and aerobic biomass. The effluent of A2 contained only extracellular polymeric substances (EPS) and no other peaks corresponding to organic matter were detected confirming the complete removal of intermediates generated in A1. 4.6: (a) specific removal rate of phenol and TH, (b) specific removal rate of CODT, CODO and heterotrophic activity during hydrocarbon variation.
Removal of sulfide 112
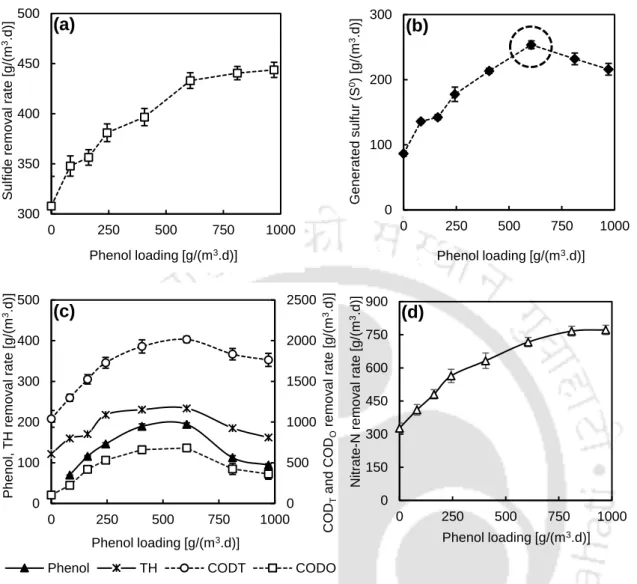
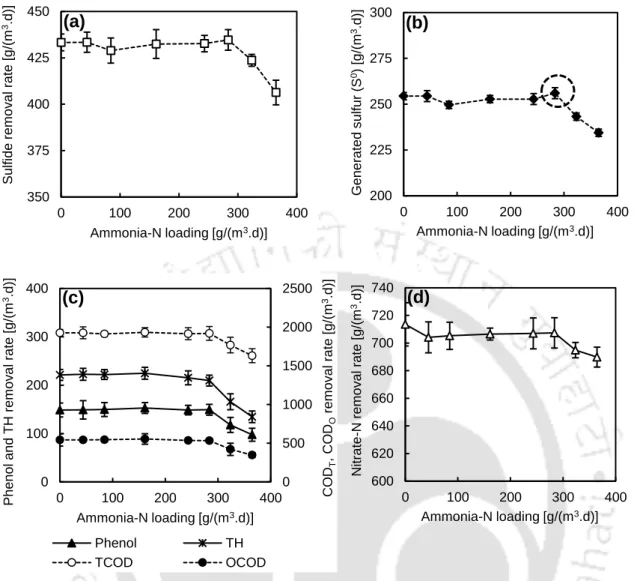
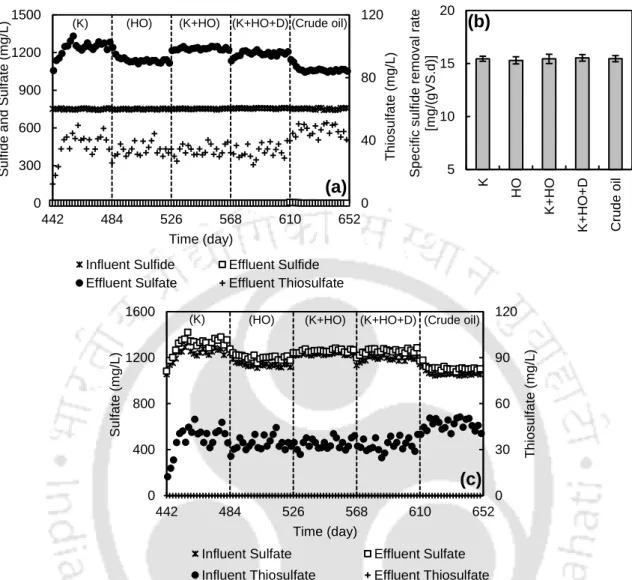
4.7: (a) influent and effluent sulfate, sulfate, and thiosulfate in A1, (b) specific sulfide removal rate in A1, (c) influent and effluent sulfate and thiosulfate in generating A2 S2O32- was less than 5% of S2 removed in the presence of any of the hydrocarbon sources and no significant change was observed (Fig. 4.7c). CA was higher in the presence of HO and crude oil compared to other types of hydrocarbons. Therefore, the anoxic biomass was able to degrade S2- with NO3--N as an electron acceptor in the absence of organics.
Heterotrophic degradation was greatly affected in the presence of HO or crude oil with an increase in density and viscosity.
Removal of nitrogen 114
A smaller number of electrons were released due to the decrease in the removal of organic substances in the presence of H202 and crude oil, which led to an increase in the partial reduction of NO3--N to NO2--N. The maximum gas was produced in the presence of kerosene and decreased as hydrocarbon density and viscosity increased (Table 4.4). Nitrogen (N2) comprised 97% of the gas generated when kerosene was used as a hydrocarbon source, decreasing in the presence of other hydrocarbons and remaining within 90-94% of the total gas generated (Fig. 4.9b).
The decrease of N2 in the presence of HO or crude oil confirms the decrease of denitrification. Carbon dioxide (CO2) and (H2S) were 1-2% of the total gas generated and CH4 was never observed. The rest of the gaseous species was named as unaccounted for and may be the mixture of intermediate nitrogen species such as N2O, NO and NO2 and NH3 unstable at high alkaline pH.
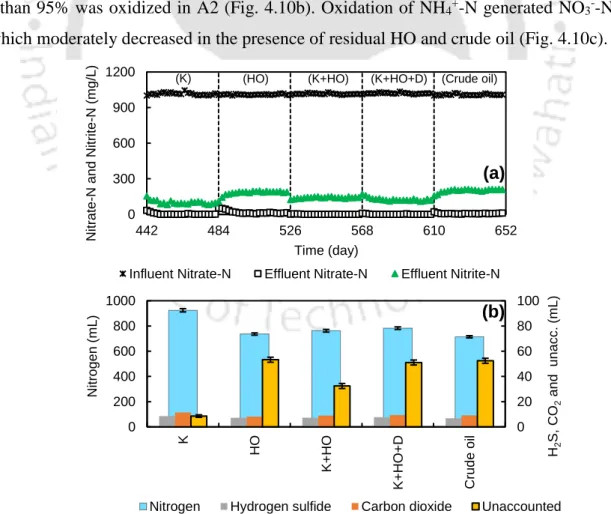
Oxidation of NH4+-N generated NO3--N in A2, which decreased moderately in the presence of residual HO and crude oil (Fig. 4.10c). The total nitrification rate in A2 was calculated from the formation of NO3--N, consumption of NO2--N and reactor HRT. Slow growth of nitrifying bacteria compared to heterotrophic bacteria (Rittman et al., 1999; Dolinsek et al., 2013) in A2 resulted in the decrease in nitrification rate when either HO or crude oil was used.
This suggests that nitrifiers remained active even in the presence of more toxic colloidal matter, but the rate decreased. In the present study, all NH4+-N was degraded by an aerobic reactor, but NO2--N degradation remained incomplete.
Mechanism of pollutants removal in anoxic reactor (A1) 117
Aerobic microorganisms 126
The amplicon was sequenced by capillary electrophoresis using the Sanger Big Dye Termination Chemistry (BDT v3.1 Cycle Sequencing Kit), with the forward and reverse sequences generated on the ABI 3500 Genetic Analyzer. A consensus sequence of the 16S region was generated from forward and reverse sequence data using aligner software. The evolutionary history was inferred using the Maximum Likelihood method, based on the Tamura-Nei model ( Tamura and Nei, 1993 ).
Reactor operation for real wastewater treatment 127
Analysis of sludge generated from reactors 129
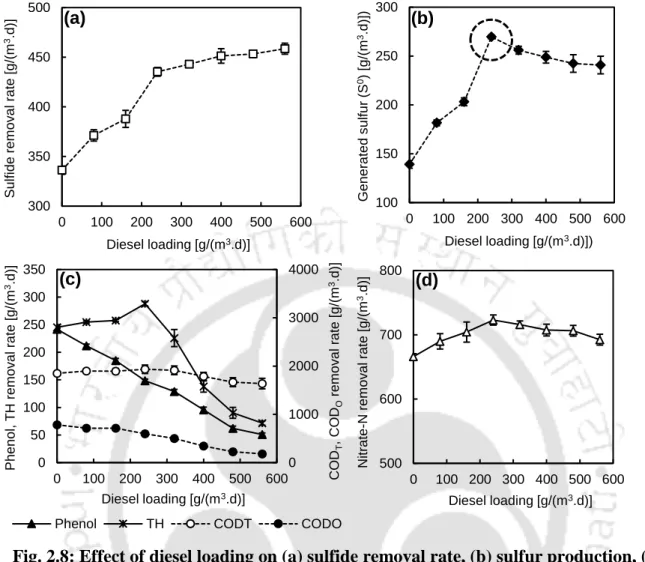
Removal of sulfide (d) without organic matter, (e) in the presence of phenol, (f) in the presence of diesel. Decrease in the removal (%) of NO2--N was observed due to increase in its concentration and increase in the removals of phenol (initial 450 ± 5 mg/L) and TH (initial 650 ± 8 mg/L) observed due to to more availability of the electron acceptor (Fig. 5.7d). Consequently, yellow culture showed better nitrogen removal in the presence of organic matter as it happened for red culture.
However, there was a decrease in phenol and TH removal due to an increase in phenol. A similar observation was made when TH varied in the presence of an aerobic white culture (Figure 5.10c). 2014) observed a higher denitrification rate [300 g/(m3.d)] in an anoxic reactor in the presence of acetate as a carbon source.
In the present study, the sequential anoxic-aerobic biological system was able to produce reusable quality water from car wash wastewater treatment. NH4+-N removal by aerobic-white culture (Pseudomonas aeruginosa strain LW-34) was quite low in the absence of organics (Fig. 5.17b). It was previously observed that aerobic white culture did not remove NH4+-N in the presence of organic matter.
In the present study, different strains of Pseudomonas aeruginosa were isolated from both anoxic and aerobic reactors, confirming their wide range of survival. In the present study, the effect of feed salt (NaCl) concentration on the performance of anoxic-aerobic sequential moving bed reactors was investigated. There was a decrease of 8% in the total anoxic biomass and 2% in the total aerobic biomass with increase in NaCl from 0 g/L to 45 g/L.
Similarly, the decrease in COD removal in A1 started with the introduction of 10 g/L NaCl in the present study. In this study, 30 g/L NaCl caused problems in aerobic biomass, probably due to the presence of hydrocarbons with higher density and viscosity and high pH. The HA of anoxic biomass was maximal in the absence of NaCl and decreased with increasing NaCl (Fig. 6.4a).