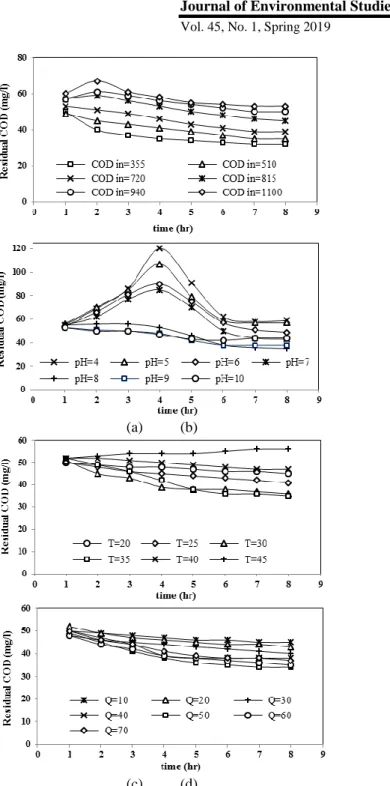
As can be seen, increasing the influent COD concentration caused the residual COD concentration in the wastewater to increase. The maximum influent COD concentration of the power plant was 1100 mg/l and minimum 300 mg/l.
Performance evaluation and biokinetic coefficients determination of oxidation-ditch process using pollutant elimination models on Tehran south
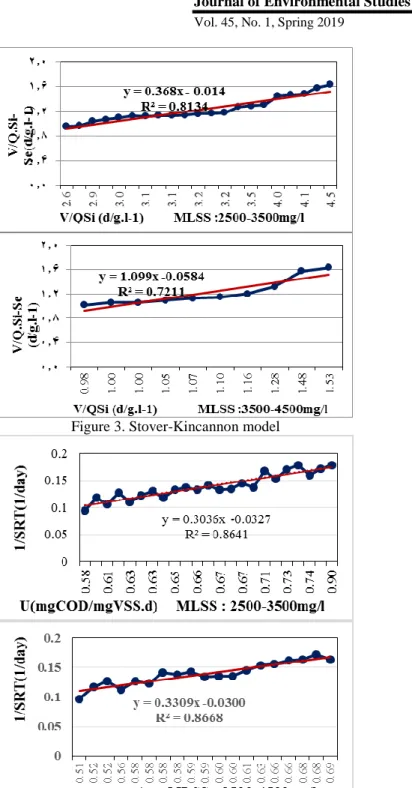
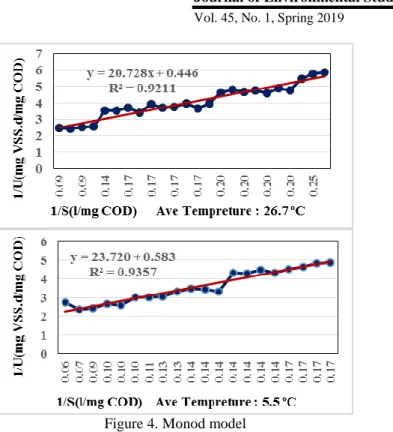
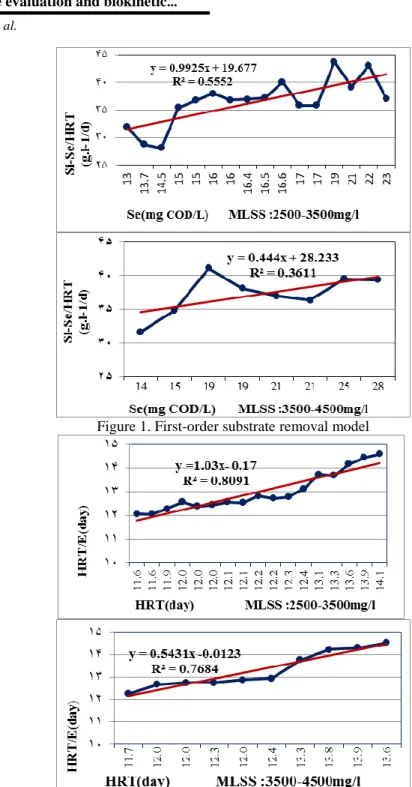
Performance evaluation and determination of biokinetic coefficients of the oxidation ditch process using pollutant elimination models in southern Tehran. 3) where Q is the influent velocity (L/d), V is the effective reactor volume (L), S0 is the substrate concentration in the influent (g/L), and ƟH is the HRT (d). The value of k1 is obtained from the slope of the approximate curve by plotting (S0 _ S) / ƟH against S. While (S0 _ S) /S0 can be expressed as substrate removal efficiency and S0/kSX is a constant, Eq. 6) where m is S0/kSX and n is a constant, E is the substrate removal efficiency.
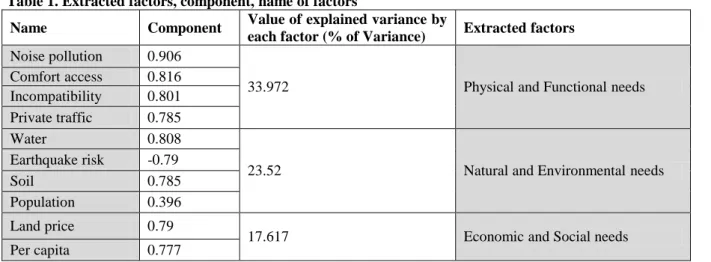
The Stover-Kincannon model considers the substrate removal rate as a function of steady-state substrate loading rate. The values of Umax and KB are obtained from the slope of the approximate curve by plotting V/Q (S0 _ S) against V/QS0. The value of the yield coefficient (Y), the value of the decay coefficient (Kd), the kinetic constant (K) and the saturation constant value (Ks) can be obtained according to the Monod model.
The Monod model provided predictions that had the most significant correlation with the actual data obtained from the study.
Biological removal assessment of sequencing batch reactor with suspended and attached growth in saline environment
Biological removal assessment of sequencing batch reactor with suspended and attached growth in saline environment. The detrimental effect of salinity resulted in poor performance in organic matter removal. This is caused by the effect of a small amount of salt (below 10 gNaCl/L) on the activity of microorganisms.
Nevertheless, the system showed good organic matter removal efficiency compared to conventional SBR at 30 g NaCl/L (82.36%). The results of this study show that the SBR removal efficiency was less hindered compared to other studies using a conventional SBR system with the same amount of salinity as this study. In addition, it could be related to the unique structure of the biofilm and the ability to provide a suitable environment for the growth and reproduction of many types of bacteria.
As a result of the salty environment, the growth and reproduction of many species are suppressed, causing the number of dead cells to increasingly dominate.
Factors affecting air pollution created in the transportation sector of Iranian provinces
Studying the classical estimation assumption of the regression model showed that the model has a variance mismatch and the low camera-Watson statistic also indicates auto-correlation in the model. The value of the t-factor estimator indicates that all coefficients are statistically significant at the highest level. Regarding the use of logarithmic data in the estimation phase of the model, the estimation coefficients are interpreted as the attraction of pollution in the transport sector in relation to each of the explanatory variables.
According to the research results, a 1% increase in the number of numbered vehicles also resulted in a 0.49% increase in carbon dioxide emissions in the transport sector of the provinces. Comparison of the estimated elasticities indicates that the pull of the pollution per capita value-added service is more than its elasticity across other sectors. Regarding the use of logarithmic data at the model's estimation stage, estimation coefficients are interpreted as the elasticity of pollution in the transport sector relative to each of the explanatory variables.
Comparison of the estimated elasticity points indicates that the attraction of the pollution per capita value added service is more than its elasticity across other sectors.
Analysis the role of psychological factors on intention to apply environmental and meteorological information by farmers of Dehloran Town (The
To the best of our knowledge, no study has been conducted to date to investigate the purpose of using meteorological information in Iran. Therefore, the aim of this study is to investigate the intention of Iranian farmers on the use of meteorological information. A structural equation model was developed to investigate the relationships between factors influencing intention to use climate information and forecasts.
In fact, the results suggest that respondents' self-efficacy and outcome expectancy help predict an individual's intention to use weather and climate information. The model accounted for 59% of the variance in intention to use climate information and forecasting. Also, the structural equation modeling revealed that the perceived usefulness (P< 0.001, β= 0.72) can explain 52% of the variation in the perception of the behavior of others. First, the results revealed that self-efficacy and outcome expectancy are directly significant predictors of intention to use climate meteorological.
In other words, as self-efficacy and outcome expectations increase, farmers will have a greater intention to use meteorological information.
Evaluation of trend in vegetation variations using time series images and Mann-Kendall test over Gavkhuni basin
The study area is the Gavkhuni basin, one of the most important basins in the country, which also includes the Zayandehrud basin. In addition, the highest density of vegetation is observed in the western and central regions of the Gavkhuni basin. The trend of long-term vegetation changes in the Gavkhuni basin based on 144 monthly MODIS-NDVI images (12 months 12 years) was implemented in Idrisi Tersset software.
Accordingly, the trend of increasing vegetation is more diffuse in the northeastern and central to western parts of the basin and slightly south of the Gavkhuni basin. In addition, the greatest reduction in vegetation occurs in the central regions of the eastern and southern parts of the Gavkhuni basin. This trend is evident in the northern and western basins and in the southern basin.
Accordingly, a strong decreasing trend was observed in the northern and western regions and in the southern part of the basin, as related to the land use/land cover and type/vegetation maps.
Prioritizing urban districts according to their needs green spaces; (Case study: 15 selected districts of Isfahan)
At the end of the study, a composite index of the need for green space development is calculated. A lower score actually indicates the more critical the existing green space in the region is. That region should therefore be given a higher priority in the development of green space.
Green areas in the city are one of the most important indicators affecting the quality of life. Therefore, nowadays choosing the right priority for the development of green areas and the right place for creating green areas is more important than in the past. 34;economic and social needs" explain the priority of the need to develop green areas in Isfahan.
The results of this research have been checked with reports on the need to develop green areas, which has been done in Isfahan municipality, and the results confirm the priority of this model.

An analysis of the thermal effects of built-up and non-built-up lands on each other using reflective and thermal remote sensing data
Analysis of thermal impacts of built and unbuilt land on each other using reflectance and thermal remote sensing data. The growth in the use of green areas is lower than the growth rate of buildings. The main reason could be the change of agricultural land and green areas to built-up land in this area.
Although the immediate area of the city is covered by the medium temperature class, the cold temperature class is located far from the built-up urban area. Due to the increased use of built-up land, an increase has occurred in the area of hot temperature classes and a decrease in the area of cold temperature classes. Built-up lands, which are located in the urban environment and adjacent to green space, also have an average surface temperature lower than green space, and are sometimes located in the average temperature class. built-up lands from green surface lands.
Built-up lands on adjacent agricultural and green lands have lower surface temperature compared to other built-up lands.
Investigation and comparison of aerosol optical indices over two urban areas in Iran
Previous studies show that the increasing emission of aerosols during the last decades in these two areas has affected their local climate. Results regarding the seasonal frequency distribution of aerosol optical depth (AOD) at 500 nm revealed that values of this index in Tehran are higher than Mashhad in all seasons. Based on the results, AE over Tehran varies between 0.06 and 0.16, which shows that the dominant mode of aerosols over Tehran is a mixture of fine and coarse particles.
It can be seen that the sources of the aerosols over Tehran are from both local emissions and long-range dust transport, while the aerosols over Mashhad are more likely from local sources. An investigation of aerosol optical properties was conducted in two urban areas in Iran, Tehran and Mashhad, from 2010 to 2013, using satellite data from the Ozone Monitoring Instrument (OMI). The dominant mode of aerosols over Tehran is a mixture of fine and coarse particles, however, fine particles are dominant over Mashhad.
The case studies show that the source of the aerosols over Tehran are from both local emissions and long-range dust transport, while the aerosols over Mashhad are more likely from local sources.
Explaining the components and indices of environmental sustainability in Iran’s educational spaces, with an emphasis on Green Educational Building
Evaluation Systems
Explaining Components and Indices of Environmental Sustainability in Iran's Education Space with Emphasis on Green Education Building. Therefore, the issue of identifying the components and criteria for architectural design of sustainable schools in Iran is one of those topics that although the necessity to address it is clear to everyone, but no serious action has been taken so far. Finally, it is recommended to adapt the components and indicators to local and regional conditions.
Accordingly, the purpose of this study is to propose components and indicators of environmentally sustainable planning in schools in Iran in order to answer the questions of what are the global standards of designing sustainable educational spaces. In order to determine the convergence and difference between the LEED and BREEAM evaluation systems, we compared their components and indicators. The results of the comparison of the components and indicators of the two selected systems led to 7 components and 46 indices.
Considering their importance, they can be used as components and indicators affecting environmental sustainability of educational spaces in Iran.