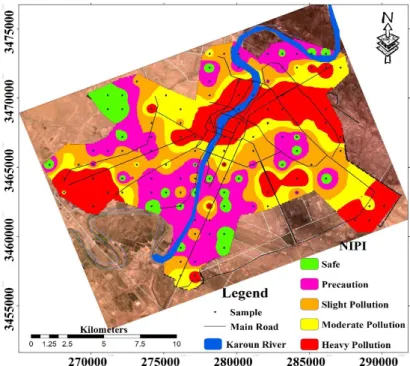
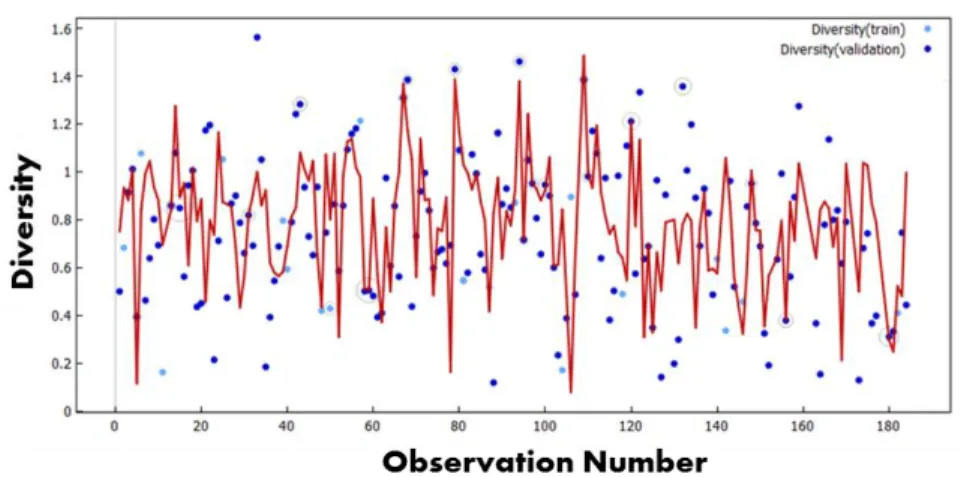
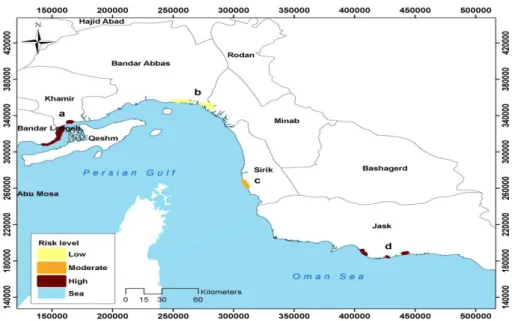
Plot-level estimates of the Shannon-Weiner index (blue circles) compared to modeled values (red line). The time series of the changes in surface runoff values were used to create a map of the reduction of catchment areas using four classes of low (code 1), moderate (code 2), high (code 3) and very high (code 4) to assess the threat to mangroves.
Calculation of Threat Index (TI) and its classification in Mangrove habitats At this stage, classified ha zard maps were co mbined using Arc GIS and Equation 4
These were used to create a map of mangroves' regression rates, classified as no regression (code 1), low regression rate (code 2), moderate regression rate (code 3) and high regression rate (code 4). natural fracture command in Arc GIS, to assess the threat to the mangroves.
Results and Discussion
Conclusion
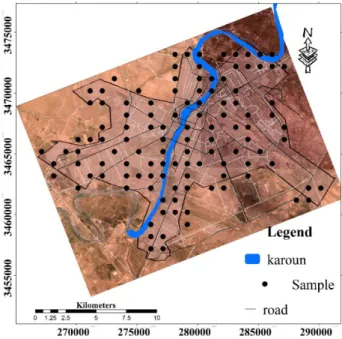
Application of CPLEX solver to land use optimization in Gorgan township
Materials and Methods
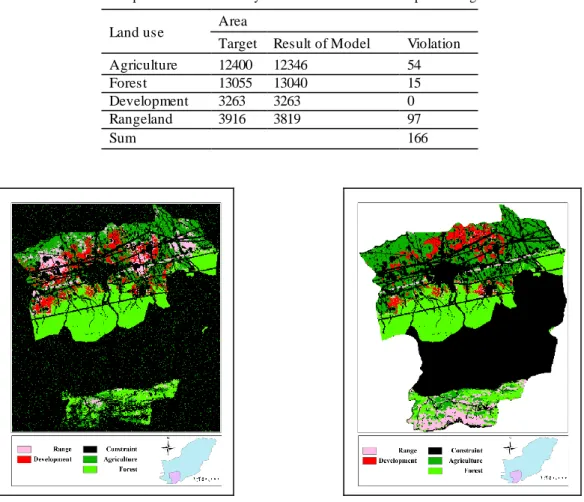
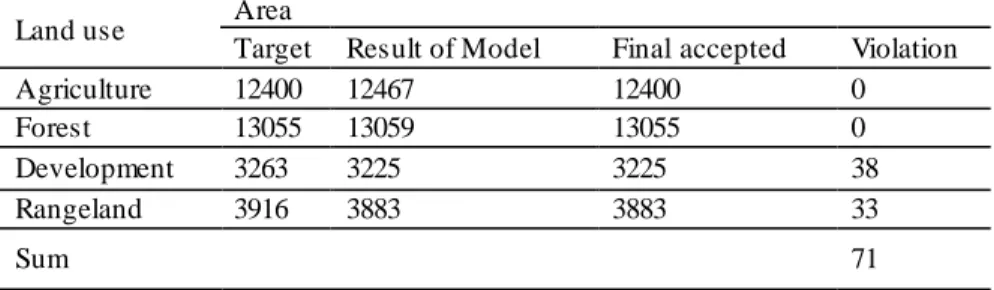
Although this result could not guarantee optimality, it was very close to the responses of the exact linear programming method. In order to have an equivalent basis for comparison, we implemented the problem with the same target area in the MOLA algorithm in IDRISI. We chose MOLA because it works by ranking cell values related to the distance to the ideal point, which is the highest possible value after standardizing the fitness values.
It is necessary to state that the objectives of compactness and conversion cost are not taken into account in MOLA. Comparison of the area of each land use before and after the implementation of the suggested model area.
Conclusions
Assessing the accuracy of MLR, PCR, ARIMA, and MLP in predicting the aerosols optical depth
Expended Abstract 1. Introduction
Material and Methods
- Multiple linear regression model
- Principal Component Regression Model
- Autoregressive integrated moving average model
- Artificial Neural Networks Model
Grades and scores for the components are based on the original version of the OLS method as follows. In this case, L2 is a mount of slice of the matrix, which is based on the K'th parameter, indicating the release of the parameter k⅄. Both the two components have zero correlation coefficient, finally these are used as primary variables.
Autoregressive integrated moving average model is one of the important methods in anticipation time series which was presented by Box and Jenkins in 1970. The ARIMA model is thus able to present forecasts related to the time series.
Discussion of Results & Conclusions
Principal Component Regression Model is a combination of Principal Component Analysis (PCA) and Multiple Linear Regression (MLR). This model had the best performance for estimating AOD in the station without Pyranometer. The number of optimized neurons determined for Sanandaj city we are 24 and 33 neurons to estimate the AOD in the long time (one year) in the station without Pyrano meter.
It can be concluded that it is better to use the autoregressive stage for the estimation of AOD in the area with Pyranometer instrument, rather than following the training and testing phases of the different models. Because, as shown, the data required for the autoregressive stage is only the data from the AOD at the station.
Improving municipal solid waste landfill liners using synthetic fibers and di- calcium phosphate
Assistant Professor, Soil and Water Research Institute, Agricultural Research Education and Extension Organization (AREEO), Karaj, Iran
Expanded Abstract 1. Introduction
In the samples with 0.1% fiber plus DCP, the hydraulic conductivity of the clay layer increased about 4 to 6 times that of the plain one. It appears that, by adding 0.5% of fiber to the soil, the φ of the sample increased, but subsequently, as the fiber content increased, i.e. 0.75 and 0.1% of fiber, φ decreased. The results showed that the addition of fibers and DCP can increase the maximum soil shear strength.
In addition, observing the effect of fibers on the reduction of surface and internal cracks of clay linings is also a very important factor. Because these cracks have a strong negative impact on the mechanical condition and permeability of the lining.
Estimating the value of quality of drinking water using contingent valuation method (Case study: Kermanshah City)
Extended abstract 1. Introduction
Matherials and Methods
Estimating the value of drinking water quality using the contingent valuation method (Case study: Kermanshah City). The right proportion ratio statistic compares the statistic of the right exponential function in the bounded (all zero coefficients) and unbounded state, and shows the simultaneous meaning of all coefficients. If this statistic is meaningful in relation to the probability of stating the correct ratio, it indicates that the explanatory variables in the model were able to describe the dependent variables well.
Discussion of Results
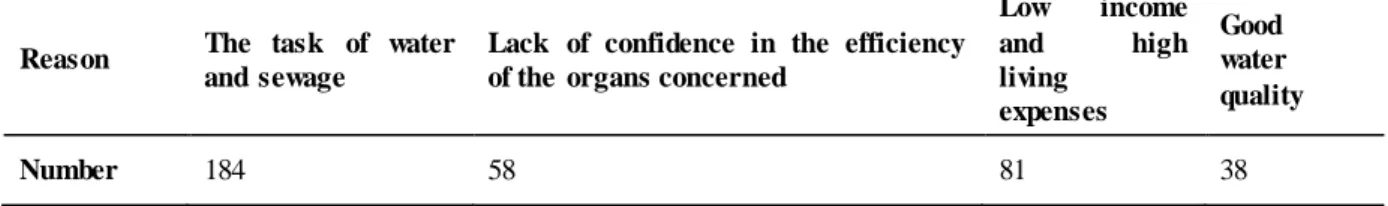
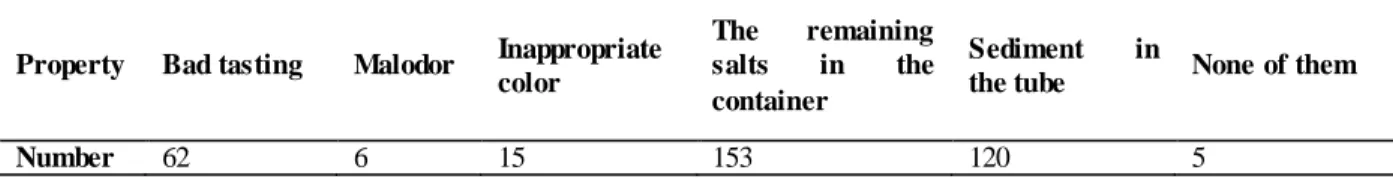
After fitting the model, the numerical integration was evaluated in the range from zero to the maximum suggested mean of willingness to pay for the value of drinking water quality improvement. The Mc Faden coefficient value is also 0.87%, which is desirable for the logit model, based on the number of observations of the dependent variable. A total of 83.4% of respondents tend to pay for improving the quality of drinking water (drinking water).
The average willingness to pay of each person to improve the quality of drinking water was 4553.353 rials per month. Variables such as level of supply, education, age, concern for water quality, ensuring safe water quality and quality of drinking water quality were also the most important factors affecting willingness to pay.
Conclusions
According to the results of Table 4, the fit of the model with a maximum accuracy of 25 degrees is 257.69 degrees of freedom. Considering the probability that stochastic proportions are significant at the 1% level and suggests that independent variables describe the dependent variable well. Given that the acceptable value for the logit model is 70%, this pattern is believed to be reliable.
Probabilistic long-term prediction of drinking water demand (Case study: Neyshabur City)
MPPO
Discussion of Results and Conclusions
As can be seen in Figure 1, the annual amount of predicted mathematical expectation for water demand per capita in the year 2031 is calculated to be 80.36 m3, which shows an increase of 50% compared to 2011. The average annual increase in water demand is around 2%, which is consistent with the results of the spot prediction model. Keywords: long-term prediction, Monte Carlo simulation, probabilistic prediction, Stone-Geary function, water demand.
Determining total allowable pollution and waste load allocation in rivers regarding seasonal variations, a framework for local multi-parameter
Results
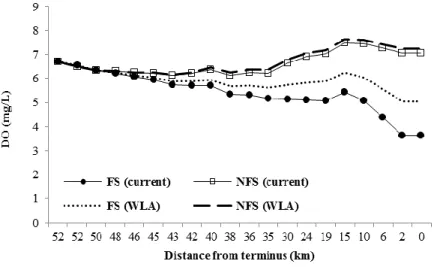
It is obvious that in FS, DO deficiency exceeds 2.5 mg/L (for a DO saturation of 8.5 mg/L), endangering aquatic life in the last 15 km of the river to the terminus, but this is quite normal in NFS. Therefore, DO is assumed as the key factor in multi-parameter WLA and decision making. At these limits, the local concentrations of pollutants can be set as standard levels for better monitoring.
The simulated DO profile of the river in flow and after WLA in two scenarios of FS and NFS. In the case of the Tajan River, it is recognized that the estuary is very sensitive to seasonal variations in water quality and quantity.
Assessment of campus landscape quality experience in higher education institutions from aspect of students (Case study: Campus of Ferdowsi
Assessment of campus landscape quality experience in higher education institutions from the perspective of students (Case study: Campus of Ferdowsi.
University of Mashhad, Iran)
Matherial and Methods
An analysis of the reliability of the questionnaires is necessary to prove how real they reflect the facts. We use Cronbach's Alpha coefficient to test the questionnaire items by means of internal reliability consistency. The higher the coefficient, the more stable and reliable the tested factors will be. Cronbach's Alpha coefficient above 0.7 indicates a fairly high reliability; coefficient less than 0.35 indicates a low reliability; and 0.5, the minimum of an acceptable reliability.
The statistics show that the reliability of the questionnaires completed by 30 out of the population of 0.67 was approved by Cranach's alpha coefficient. Factor analysis to obtain the effect of each variable was used sub-parts to evaluate the quality of the campus landscape environment.
Results
For university campuses, it is easy to identify the majority of end users of campus landscape spaces who are students.
Discussion
The results show that the quality of the campus landscape environment is directly related to the perception elements. The important note is physical and environmental variables that indicate a lack of attention to the combination of green open spaces and architectural elements. Also, due to the lack of differentiation and function of sex and use of existing spaces, the quality of the environment for the female students to male students is a significant difference in health.
Although with this approach, professional designers can create good designs, however, the solution of the community and project needs can be limited and incomplete, faced with a set of complex and sometimes conflicting individual and community issues. Universities must be modeled as centers that can improve teaching and learning and accommodate the needs of all learners and to serve as the center of the community to promote sustainability.
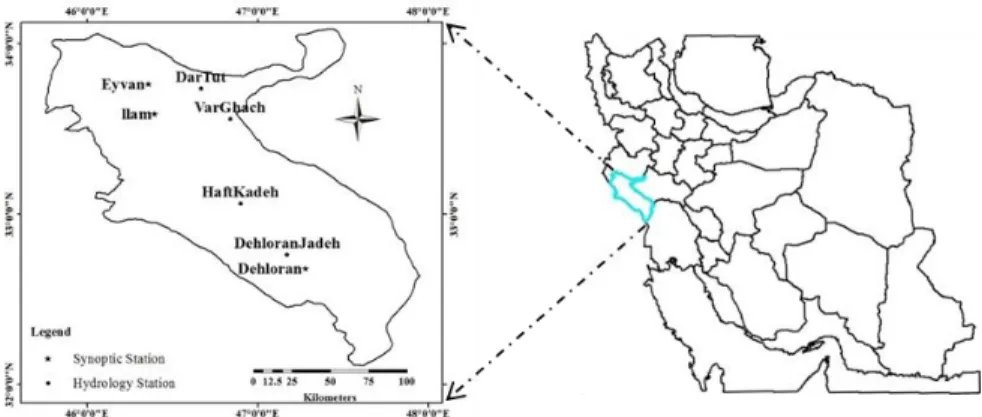
The effect of dust on the feedback of some climatic factors from Ilam province
Materials & Methods
A regression model is used to predict the target precipitation, controlling for rainfall as a function of dust impact. The effect of aerosols and dust on precipitation was performed using a statistical relationship for historical regression (Rosenfeld & Nirel, 1996). SR: The ratio of the observed rainfall to the observed average for the target rainfall over the historical period. AVERAGE: The ratio of predicted precipitation to the predicted average for the target precipitation over the historical period. A Monte Carlo permutation test was performed to assess dust impact on precipitation.
Statistical ratios obtained are less than one, which shows negative effect of dust on precipitation. However, the negative effects of dust were differences in incidence for studied stations.
Conclusion
A framework for assessing governance and enhancing public participation in environmental management plans: application to.
A framework for governance assessment and enhancement of public participation in environmental management plans: Application in the
Discussion of Results & Conclusions
In the next step, according to the analysis and evaluation of the identified interested parties, the level of participation was determined. This weakness has been identified especially in the level of knowledge and awareness of the interested parties. Based on the above work, the roadmap for the implementation of public participation regarding the different levels of stakeholders will be developed in two basic steps.
In this step, in the capacity building matrix, the titles and courses that improve the knowledge and awareness of these stakeholders are prioritized. In the second step, after obtaining the results of the capacity building process, the implementation of ICZM at different levels of commitment from each of the stakeholders will be carried out.