On more strictly trade-related aspects, value-added trade estimates show that services play a larger role in international trade than conventional trade statistics suggest. In recent years we have seen a growing demand for data on the world economy and in particular on international trade.
SAPTA South Asian Preferential Trade Agreement SITC Standard International Trade Classification WAEMU West African Economic and Monetary Union UNECE United Nations Economic Commission for Europe. UNECLAC United Nations Economic Commission for Latin America and the Caribbean UNCTAD United Nations Conference on Trade and Development.
World trade developments
- Overview
- Trade by region
- Leading traders
- Bilateral trade of leading traders
- Regional trade agreements
- Least-developed countries
- Foreign affiliates trade in services
On the other hand, exports from developed economies to least developed countries increased by 3 percent in 2013 after stagnation the previous year. In the Middle East, exports increased by 4 percent compared to almost 9 percent a year earlier.
Growth in the volume of world merchandise exports and production, 2005-2013
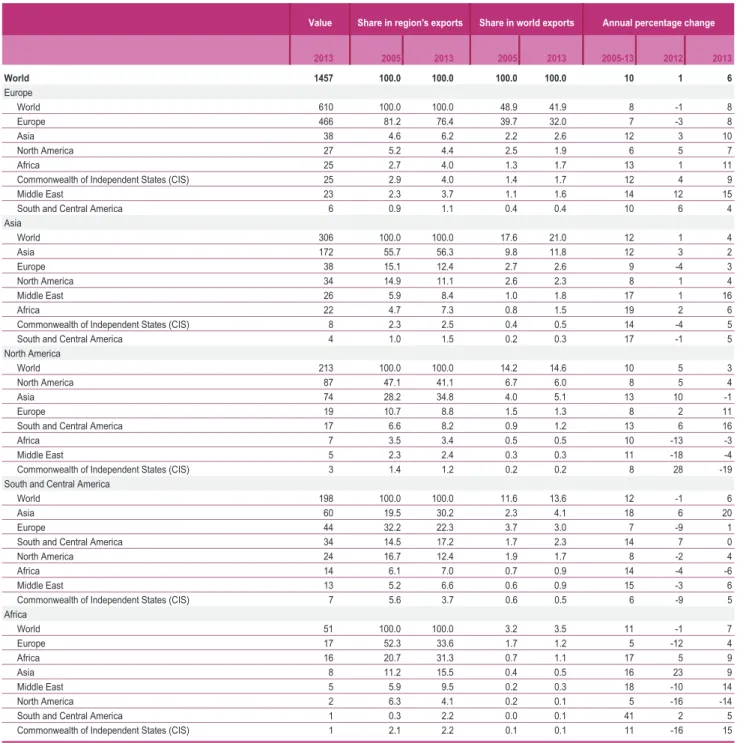
World merchandise trade and trade in commercial services by region and selected economy, 2005-2013Table I.3
Intra- and inter-regional merchandise trade, 2013
1RWH Between 1973 and 1983 and between 1993 and 2003, export shares were strongly influenced by movements in oil prices.
Leading exporters and importers in world merchandise trade (excluding intra-EU (28) trade), 2013
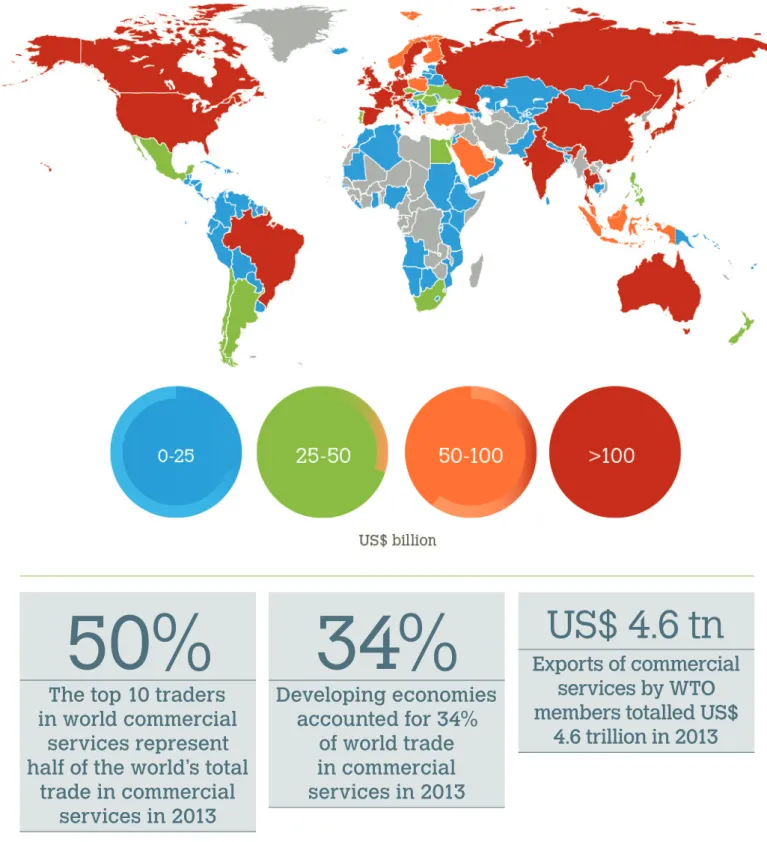
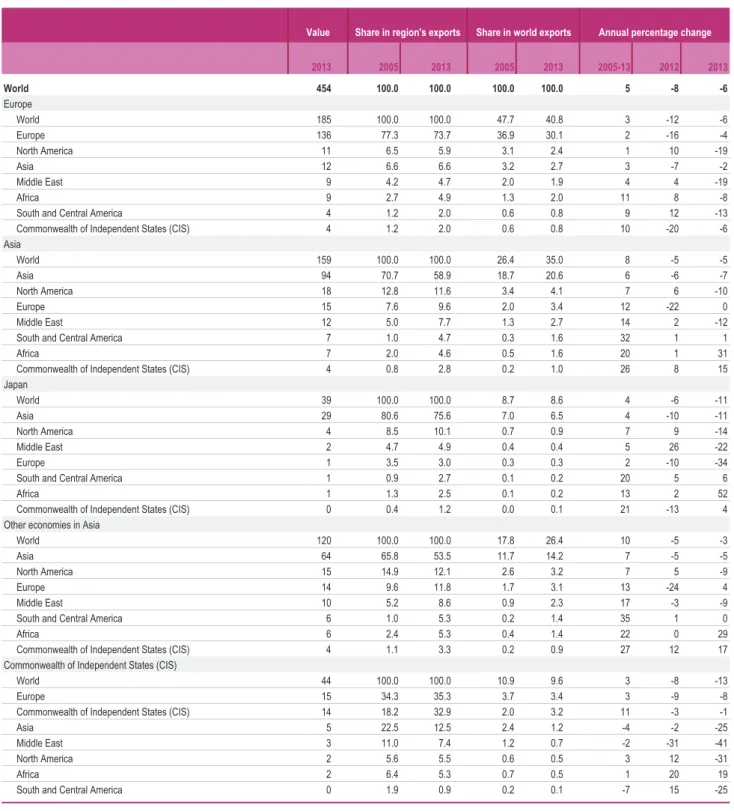
Leading exporters and importers in world trade in commercial services, 2013
Leading exporters and importers in world trade in commercial services (excluding intra-EU (28) trade), 2013
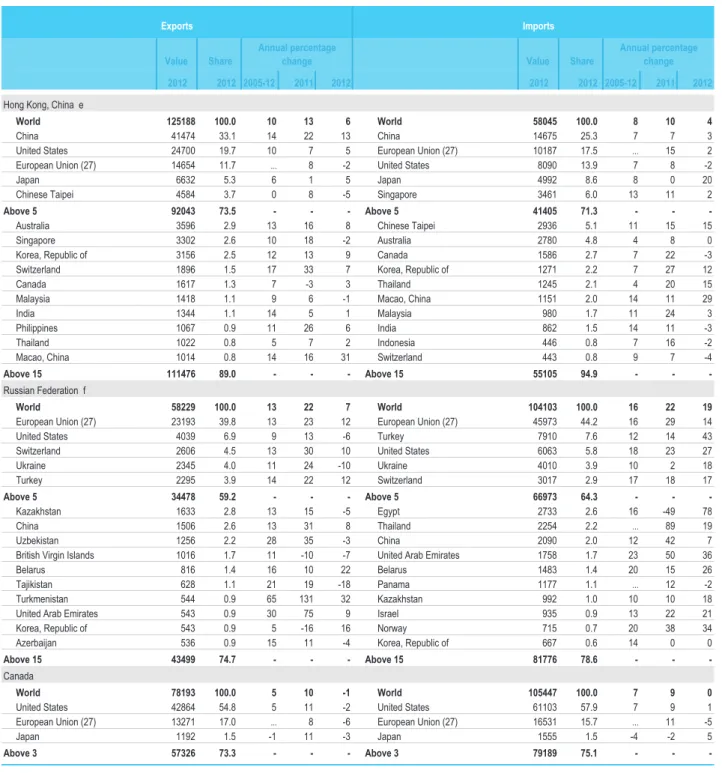
Merchandise trade of Canada by origin and destination, 2013
Merchandise trade of the United States by origin and destination, 2013
To compensate for this under-recording, intra-EU exports were used to obtain total (world) imports (28).
Merchandise trade of the European Union (28) by origin and destination, 2013
Merchandise trade of Japan by origin and destination, 2013
Trade in commercial services of selected economies by origin and destination, 2012
The following transactions are not allocated geographically: travel exports and imports; financial services exports related to foreign exchange trading; imports of freight transport services and, insurance on goods imports.
Merchandise trade of NAFTA countries by major product group and by origin/destination, 2013
Merchandise trade of MERCOSUR countries by major product group and by origin/destination, 2013
Merchandise trade of Andean Community countries by major product group and by origin/destination, 2013
1RWH Trade in goods is derived from balance of payments statistics and does not correspond to trade in goods statistics given elsewhere in this report. Imports of agricultural products, fuels and products from the European Union (28), Asia and North America from least developed countries, 2013.
Imports of agricultural products, fuels and manufactures of the European Union (28), Asia and North America from the least- developed countries, 2013
1RWH Improvements in data quality in recent years may have resulted in changes regarding the breakdown of trade services exports by service category.
Exports of commercial services of the least-developed countries by category, 2013
Sale of branches of foreign companies - resident branches that are mainly engaged in service activities (internal FATS. Sale of foreign branches of resident companies - branches abroad that are mainly engaged in service activities (external FATS.
Sales by foreign affiliates of resident companies - affiliates located abroad primarily engaged in services activities (outward FATS), 2008-2011
This differs from the FATS data presented for the United States in Tables I.24 and I.25, which relate to sales of foreign affiliates operating in the service sector. Services provided by United States branches located abroad (external FATS) and foreign branches in the United States (internal FATS) by branch economy, 2011.
Services supplied by United States affiliates established abroad (outward FATS) and by foreign affiliates in the United States (inward FATS) by economy of affiliate, 2011
Merchandise trade
Its share of world exports of manufactured goods now stands at 39 percent, compared with Europe's share of 41 percent.
Merchandise trade by product
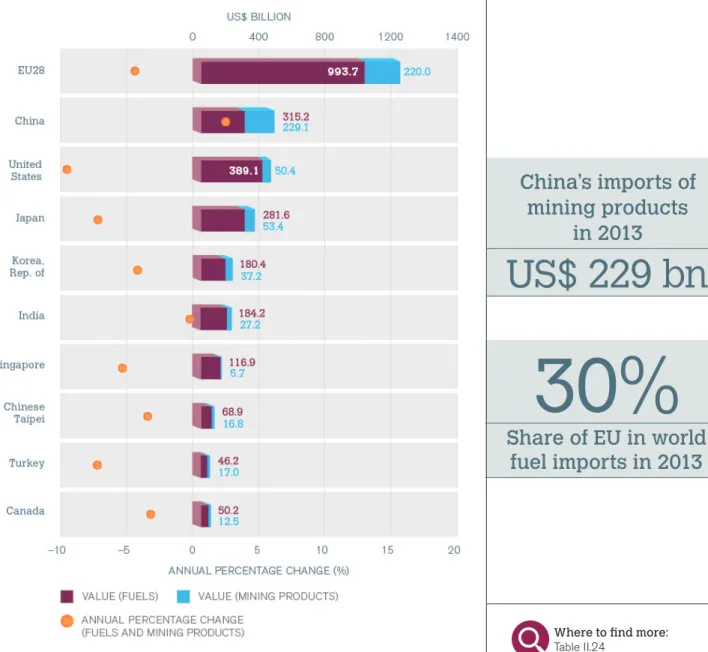
- Fuels and mining products
- Manufactures
- Iron and steel
- Chemicals
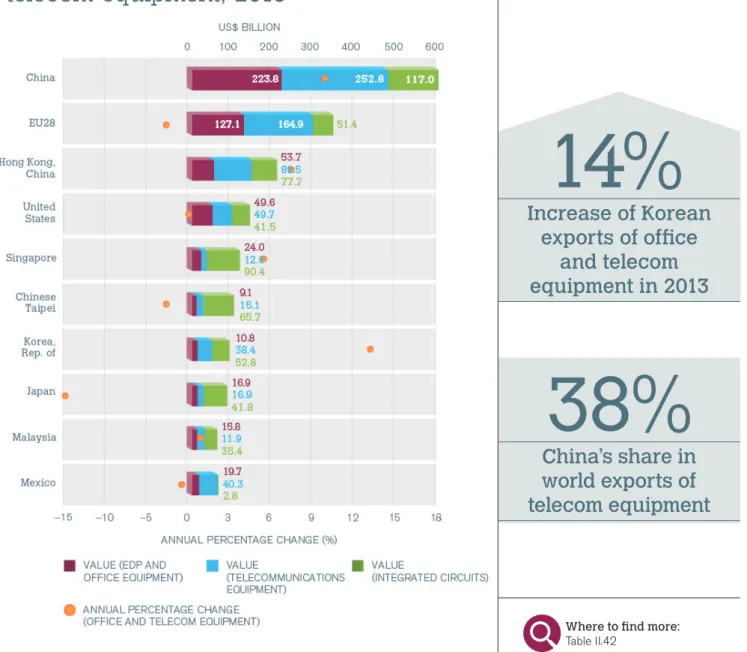
- Office and telecom equipment
- Automotive products
- Textiles
- Clothing
World merchandise exports by major product group, 2013
World merchandise exports by major product group and region, 2013
Share of fuel and mining products in trade in total merchandise and in primary products by region, 2013.
Share of fuels and mining products in trade in total merchandise and in primary products by region, 2013
Share of fuels in trade in total merchandise and in primary products by region, 2013
Share of manufactures in total merchandise trade by region, 2013
Share of agricultural products in trade in total merchandise and in primary products by region, 2013
Share of iron and steel in trade in total merchandise and in manufactures by region, 2013.
Share of iron and steel in trade in total merchandise and in manufactures by region, 2013
Share of chemicals in trade in total merchandise and in manufactures by region, 2013
Share of office and telecom equipment in trade in total merchandise and in manufactures by region, 2013
Share of automotive products in trade in total merchandise and in manufactures by region, 2013
Share of textiles in trade in total merchandise and in manufactures by region, 2013
Share of clothing in trade in total merchandise and in manufactures by region, 2013
Exports of agricultural products of regions by destination, 2013
Agricultural products
Leading exporters and importers of agricultural products, 2013
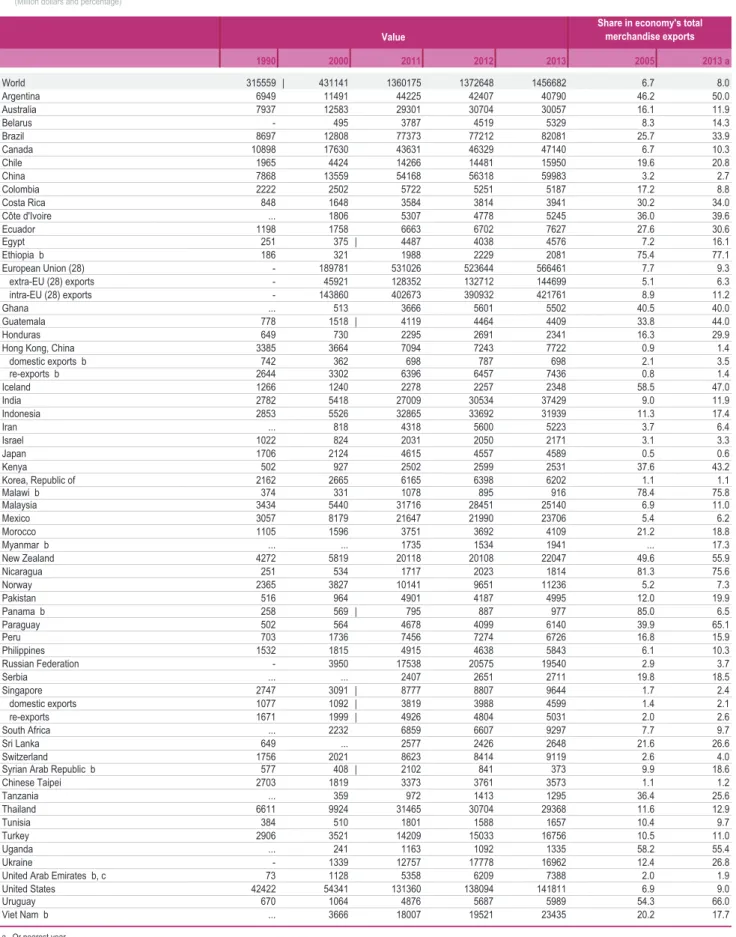
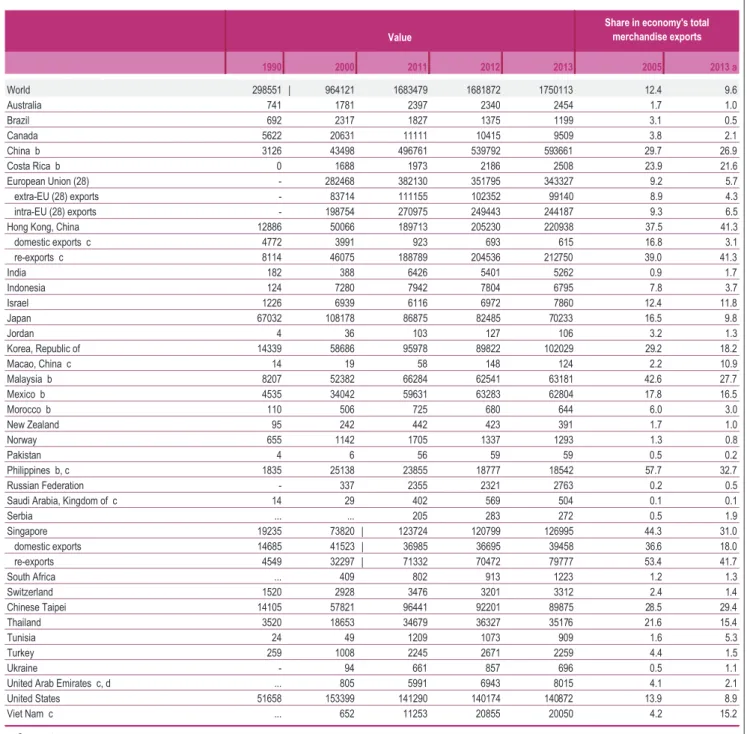
Exports of agricultural products of selected economies, 1990-2013
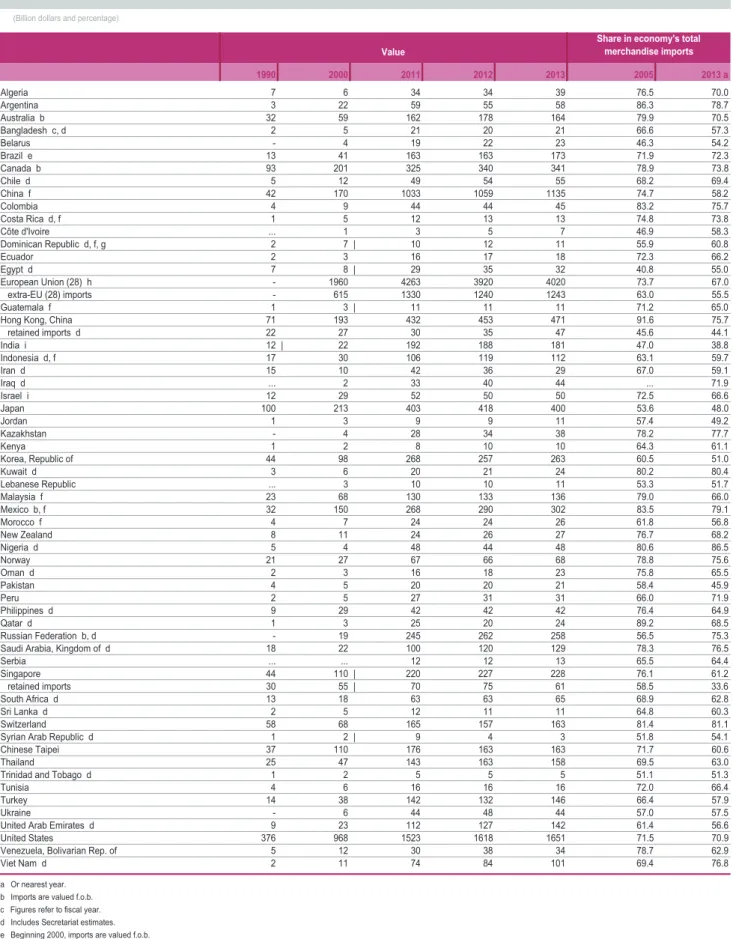
Imports of agricultural products of selected economies, 1990-2013
Food
Leading exporters and importers of food, 2013
Exports of food of selected economies, 1990-2013
Imports of food of selected economies, 1990-2013
Imports of fuels of selected regions and economies from the Middle East, 2005 and 2013
Imports of fuels of selected economies, 1990-2013
Exports of manufactures of regions by destination, 2013
Trade in manufactures of the United States, the European Union (28) and China by origin and destination, 2013
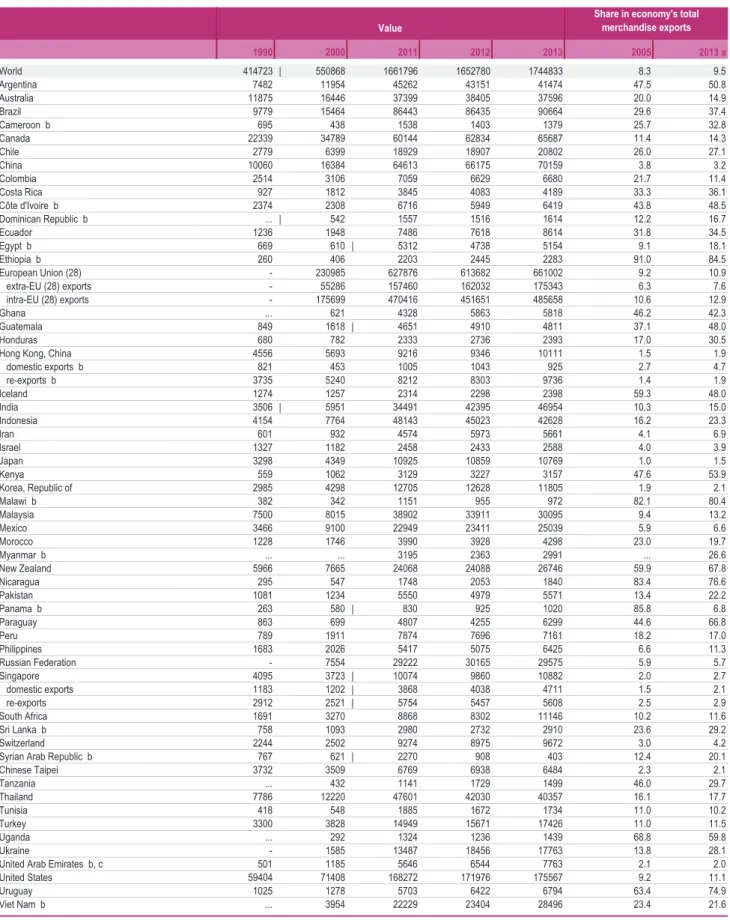
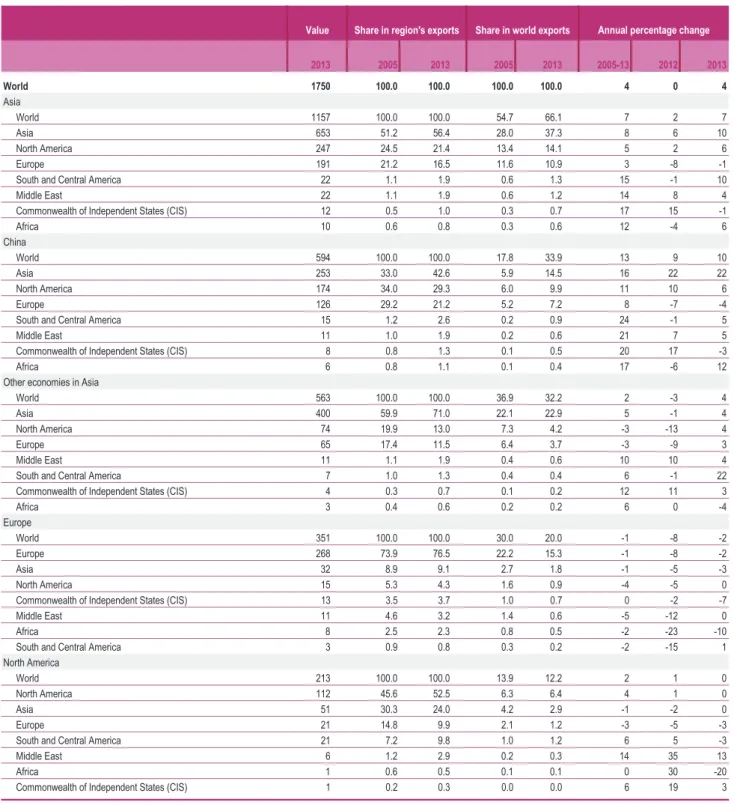
Leading exporters and importers of manufactures, 2013
Last year, the share of diamonds in the export of industrial products was 14.3 percent for India, 30.8 percent for Israel and 5.2 percent for South Africa.
Exports of manufactures of selected economies, 1990-2013
For the most recent year, the share of diamonds in total manufactured imports was 12.5 percent for India and 18.1 percent for Israel.
Exports of iron and steel of selected regions and economies by destination, 2013
Leading exporters and importers of iron and steel, 2013
Exports of chemicals of selected regions and economies by destination, 2013
Leading exporters and importers of chemicals, 2013
Leading exporters and importers of pharmaceuticals, 2013
Exports of office and telecom equipment of selected regions and economies by destination, 2013
Leading exporters and importers of office and telecom equipment, 2013
Exports of office and telecom equipment of selected economies, 1990-2013
Imports of office and telecom equipment of selected economies, 1990-2013
Leading exporters and importers of EDP and office equipment, 2013
Exports of EDP and office equipment of selected economies, 1990-2013
Imports of EDP and office equipment of selected economies, 1990-2013
Leading exporters and importers of telecommunications equipment, 2013
Exports of telecommunications equipment of selected economies, 1990-2013
Imports of telecommunications equipment of selected economies , 1990-2013
Leading exporters and importers of integrated circuits and electronic components, 2013
Intergrated circuits and electronic components
Exports of integrated circuits and electronic components of selected economies, 1990-2013
Imports of integrated circuits and electronic components of selected economies, 1990-2013
Exports of automotive products of selected regions and economies by destination, 2013
Leading exporters and importers of automotive products, 2013
Exports of automotive products of selected economies, 1990-2013
Imports of automotive products of selected economies, 1990-2013
Textile exports of selected regions and economies by destination, 2013
Leading exporters and importers of textiles, 2013
Textile imports of selected economies, 1990-2013
Clothing exports of selected regions and economies by destination, 2013
Leading exporters and importers of clothing, 2013
Clothing exports of selected economies, 1990-2013
Clothing imports of selected economies, 1990-2013
Trade in commercial services
Financial services, which had contracted the most in 2012, recovered with a 9 percent increase in exports. However, global exports of transport services are lagging, with an increase of only 2 percent in 2013, mirroring the trend in goods trade. China and India registered a 3 percent drop, while Hong Kong, China saw a 2 percent drop.
The rate of IJOBCFDBNFUIFUIJSEMBSHFTUUSBWFMFYQPSUFSBGUFSUIF&VSPQFBO6OJPOBOEUIF 6OJUFE4UBUFT"VTUSBMJBXBTUIFPOMZMFBEJOHUSBWFMFYQPSUFSUPSFDPSEBOFHBUJWF in 2013 (-3 percent) despite the increase in the number of foreign tourists.
BDDPSEJOHUPUIF6/8PSME5PVSJTN0SHBOJ[BUJPOXJUIQFBLHSPXUIJO"TJB (5 to 6 per cent) and Africa (4 to 6 per cent)
Trade in commercial services by category
- Other commercial services
- Communications services
- Insurance services
- Computer and information services
- Personal, cultural and recreational services
5BCMF*** 8PSMEFYQPSUTPGDPNQVUFSBOEJOGPSNBUJPOTFSWJDFTCZSFHJPOBOE Table III.19 Large exporters and importers of computer and information services, 2012 and 2013 134 Table III.19 Large exporters and importers of computer and information services and Computer Services 2012. 5BCMF*** .BKPSFYQPSUFSTBOEJNQPSUFSTPGPUIFSCVTJOFTTTFSWJ DFTBOE Table III.25 Trade in other business services by category in selected economies, 2012 138 Table III.25 Trade in other business services by category in selected economies, 2012 138.

World trade in commercial services by category, 2013
Growth of commercial services exports by category and by region, 1990-2013
World trade in transportation services by region, 2013
Transportation services
Leading exporters and importers of transportation services, 2013
World trade in travel by region, 2013
Travel
Leading exporters and importers of travel, 2013
World trade in other commercial services by region, 2013
Leading exporters and importers of other commercial services, 2013
World exports of communications services by region, 2012 and 2013
Major exporters and importers of communications services, 2012 and 2013
Since some major communications service providers do not report the telecommunications services item separately, they may not appear on the list.
Major exporters and importers of telecommunications services, 2012 and 2013
Telecommunications services
Since some economies do not report this item separately, they may not appear in the list (eg, Switzerland, United Arab Emirates).
Major exporters and importers of construction, 2012 and 2013
World exports of construction by region, 2012 and 2013
Major exporters and importers of insurance services, 2012 and 2013
World exports of insurance services by region, 2012 and 2013
World exports of financial services by region, 2012 and 2013
Major exporters and importers of financial services, 2012 and 2013
World exports of computer and information services by region, 2012 and 2013
Major exporters and importers of computer and information services, 2012 and 2013
Major exporters and importers of computer services, 2012 and 2013
World receipts of royalties and licence fees by region, 2012 and 2013
Major economies for receipts and payments of royalties and licence fees, 2012 and 2013
Royalties and licence fees
World exports of other business services by region, 2012 and 2013
Major exporters and importers of other business services, 2012 and 2013
Trade in other business services by category in selected economies, 2012
World exports of personal, cultural and recreational services by region, 2012 and 2013
Major exporters and importers of personal, cultural and recreational services, 2012 and 2013
Audiovisual services
Since certain major traders in personal, cultural and recreational services do not report audiovisual and related services separately, they may not appear in the list. Bureau of Economic Analysis moved film and television tape distribution from audiovisual and related services to royalties and licensing fees.
Major exporters and importers of audio-visual and related services, 2012 and 2013
Trade in global value chains
Leading exporters and importers of intermediate goods, 2012
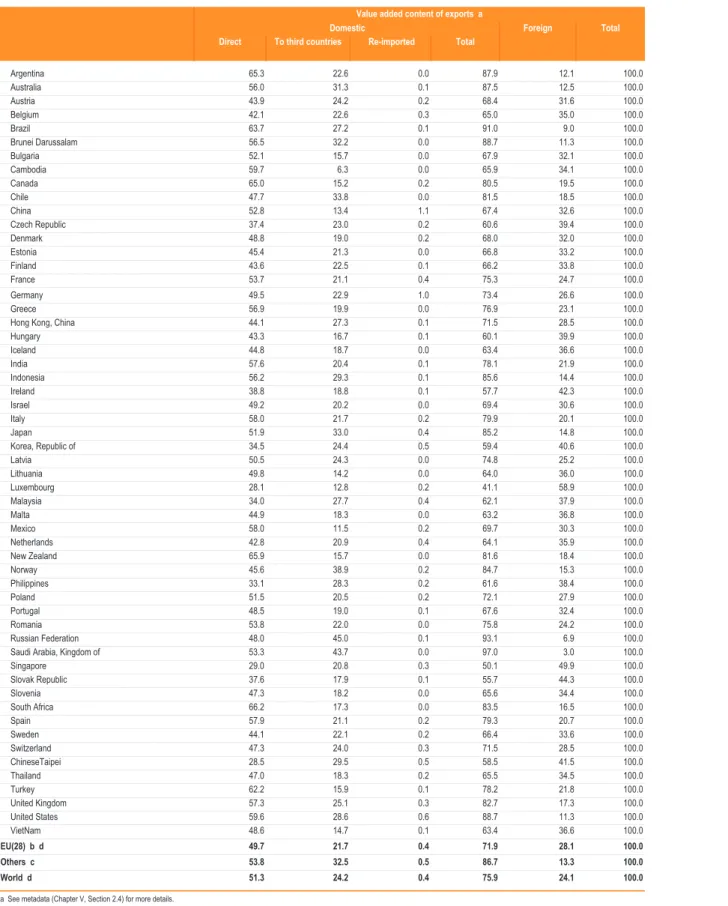
IV TRADE IN GLOBAL VALUE CHAINS Shares of domestic and foreign sectoral contributions in gross exports, selected economies, 2009.
Supplies of goods and services by United States affiliates established abroad, 2011
Composition of geographical and economic groupings 150
WTO members are often referred to as "countries", although some members are not countries in the usual sense of the word, but officially are. The definition of geographical and other groups in this report does not imply an expression of opinion by the Secretariat concerning the status of any country or territory, the delimitation of its boundaries, nor the rights and obligations of any member of the WTO with respect to WTO agreements. The colors, boundaries, designations and classifications on the maps in this publication do not imply, on the part of the WTO, any judgment on the legal or other status of any territory, or any approval or acceptance of any boundary.
Throughout this report, South and Central America and the Caribbean are referred to as South and Central America; Aruba, Bolivarian Republic of Venezuela, Hong Kong Special Administrative Region of China, Macau Special Administrative Region of China, Republic of Korea and special customs territory.
Composition of geographical and economic groupings
- Merchandise trade
- Exports and imports Two systems of recording merchandise
Unless otherwise indicated, exports are valued at transaction value, including the cost of transportation and insurance to bring the goods to the border of the exporting country or territory (“free on board” valuation). Imports are valued at transaction value plus the cost of transport and insurance to the border of the importing country or territory ("cost, insurance and freight" valuation).
Definitions and methodology
They are called general trade and special trade and differ mainly in the way goods are handled in warehouses and re-exports. To the extent possible, total trade in goods is defined in this report according to the general trade definition. It covers all types of inbound and outbound movement of goods through a country or territory, including movements through bonded warehouses and free zones.
Goods include all goods that add to or subtract from the stock of material resources of a country or territory by entering (importing) or leaving (exporting) the country's economic territory.
Products
- Products All product groups are defined
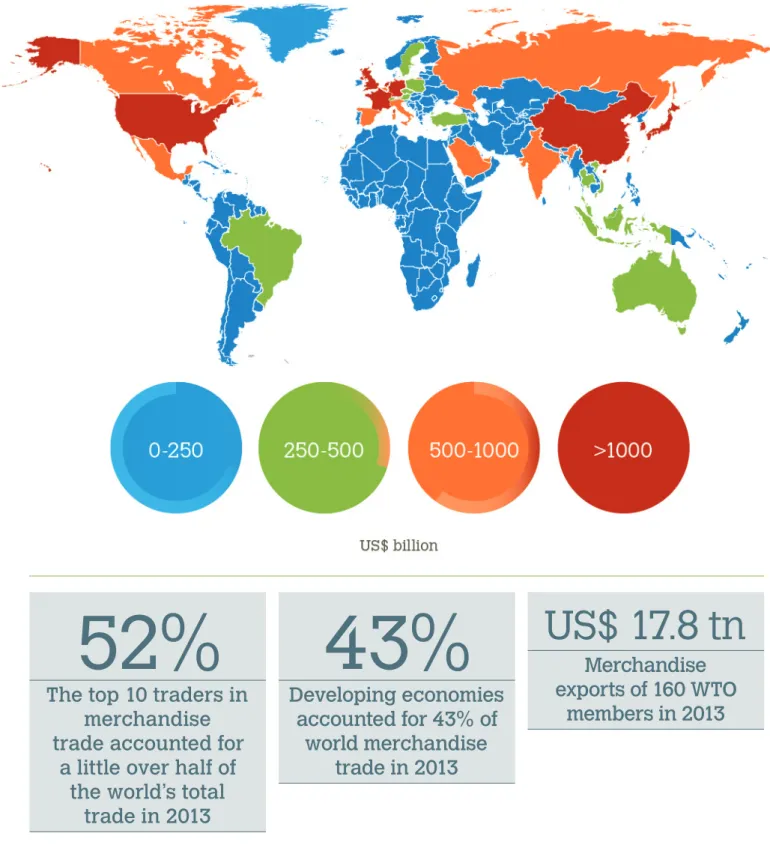
- World trade network The world merchandise trade network
- Merchandise trade by product, region and major
- Trade in
- Trade in commercial services between residents and
After adjustment, trade in goods is recorded in the goods category of the current account, along with services, income and current transfers. It should be noted that some economies still apply the concepts of the fourth edition of the Balance of Payments Manual, and therefore do not include goods for processing and goods procured at port carriers in the goods account. Exports (credits or receipts) and imports (debits or payments) of commercial services derived from statistics on international services transactions are included in balance of payments statistics, in accordance with the concepts, definitions and classification of the fifth edition (1993) of the Manual of the IMF's Balance of Payments.
In the fifth edition of the Balance of Payments Manual, the current account is subdivided into goods, services (including government services, not included elsewhere), income (investment income and compensation of employees) and current transfers.
Number of economies reporting Balance of Payments services components for 2012
- Foreign Affiliates Statistics
- Trade in global value chains
- The decomposition of gross exports into their
- The sectoral value added contributions to gross exports
- Other definitions and methods
- Annual changes Throughout this report, average annual
- Prices
- World merchandise trade indices
- World production Production of agriculture (including
- World gross domestic product
- Re-exports and re-imports
- Specific notes for selected economies
- Major breaks in data continuity of
- Trade in services of the United States
- Travel exports and transportation
- Trade in other commercial services
- Trade in
- Trade in commercial services of Nigeria
- Trade in
- Trade in other commercial services
- Trade in other commercial services
- Trade in
- Trade in
- Trade in
- Trade in financial services
- Statistical sources
The measurement of trade in value added terms tracks the source of the value added, by country and industry contained in the products (goods and services) traded around the world. The world index is derived by aggregating the three sectors using value added shares in 2005 as weights. For example, before the adoption of the Intrastat system, reported intra-EU imports (c.i.f.) closely matched reported intra-EU exports (f.o.b.).
This breakdown is based on the information published in the annual RBI.
EUROSTAT, Comext and on-line databases
In 2006, the Central Bank of South Africa improved its estimates of commercial services and revised its data back to 2001 (resulting in a break in the series for that year). New data collected since 2004 for items of other commercial services cause the series to be interrupted for that year. New data were collected in 2008 (new national data from the new 2007 Enterprise Survey) for items of other commercial services, resulting in a break in the series for 2005 for exports and 2003 for imports.
Starting in 2009, trade figures in Singapore's commercial services have been converted from BPM6 to BPM5 presentation.
FAO, FAOSTAT Agriculture database FAO, Production Yearbook
Since the figures for net trade transport exports are not reported separately, the exports of total commercial services and of other commercial services are approximately 20% and 35% lower, respectively, than previously reported. The figures released in 2012 reflect a new Supplementary Survey on International Trade in Services (ECEIS) submitted by resident non-financial corporations exporting or importing services that are not subject to the general direct reporting obligation. In 2009, the expansion of the sample of companies surveyed led to a break in the series and to a substantial upward revision of receipts and payments for services, excluding travel costs.
A new reporting system for financial intermediaries was introduced in 2011, which also resulted in the discontinuation of the series for financial services, both credits and debits.
GTIS, Global Trade Atlas database IMF, Balance of Payments Statistics
New data from 2005 compiled on the basis of BPM5 recommendations was released by the Bank of Nigeria in 2007. Before 2008, a number of items (e.g. financial services, other business services) were still not all classified according to the BPM5 definitions and some items were received net. For Australia and Hong Kong (China), data includes FISIM from 2009 due to the countries' transition to BPM6.
OECD, Monthly Statistics of International Trade
OECD, National Accounts
OECD, Statistics on International Trade in Services
OECD/IEA, Energy Prices & Taxes UNECE, Economic Survey of Europe
UNSD, Comtrade database
UNSD, International Trade Statistics Yearbook
UNSD, Monthly Bulletin of Statistics UNSD, Servicetrade database
This can be attributed to the use of different trade recording systems, the way, for example, the IMF and UNSD converted data expressed in national currencies into dollars, and corrections that are easier to incorporate into the IMF data. Statistics on trade in commercial services are mainly drawn from IMF balance of payments statistics. Statistical data on the exchange of commercial services by origin and destination are also derived from national statistics.
Thanks to the Food and Agriculture Organization, the International Monetary Fund, the Organization for Economic Co-operation and Development, the Statistical Office of the European Communities, the United Nations.
About the WTO
About this publication
International Trade Statistics 2014 provides a comprehensive overview of the latest developments in world trade, covering trade in merchandise and commercial services as well as trade in global value chains. International Trade Statistics 2014 serves as a valuable reference tool for researchers, policy makers and anyone interested.
TOTAL COMMERCIAL
SERVICES
TOTAL
MERCHANDISE
MANUFACTURES