This paper will address these features and propose a common multi-system recovery model to support assessment of interdependent systems. Based on the above resilience metrics, this paper will take the electricity and gas system in Harris County, Texas [ 33 ] as an example to illustrate a network-based framework for interdependent systems resilience assessment. The above descriptions have established the interdependence from the electricity system to the gas system.
Therefore, this paper will optimize the restoration sequence to minimize the impact area under each damage scenario. The procedures for searching for an optimal recovery sequence can be determined according to the following steps. For each genotype corresponding to a restoration sequence, the restoration process is simulated according to the power and gas system performance models, and then the impact area is calculated.
The genotype in the final generation with the minimum surface area corresponds to the optimal restoration sequence.
Simulation Results
Restoration processes for typical hurricane scenarios
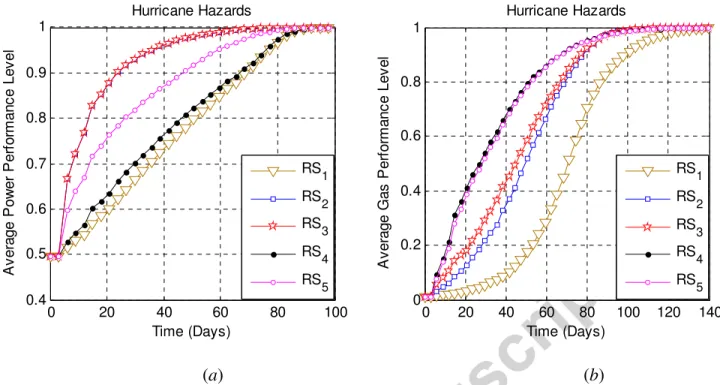
3, when the amount of restoration resources is rp=10 units for the power system and rg=1 unit for the gas system, the average power and gas restoration curves over 200 damage scenarios are shown in Fig. The number of damage scenarios set in the simulation is chosen to make the average impact areas converge to a deviation of less than 0.1% under all restoration strategies. From the figures, according to different strategies, the time for full restoration is 82 days for the electric power system and 140 days for the gas system.
For the independent strategy RS2 and the power-first and gas-second strategy RS3, their power system curves overlap because this paper only considers non-directional power-to-gas interdependencies, so these two strategies are effectively the same for the energy system. ;. Also, the random strategy RS1 is the worst for both systems, and the gas-oriented strategy RS4 makes the gas recovery curve the best, but note that the power recovery curve under this strategy is still better than the random strategy RS1, indicating that the power system also benefits when the recovery sequence is optimized to minimize the gas impact area. Moreover, compared with the gas-oriented strategy RS4, the energy and gas compromised strategy RS5 effectively improves the power restoration process, with the IAP reduced from 19.1 to 12.0, but for the gas system, the improvement is not much, with the IAG has been reduced from 31.2. to 30.0.
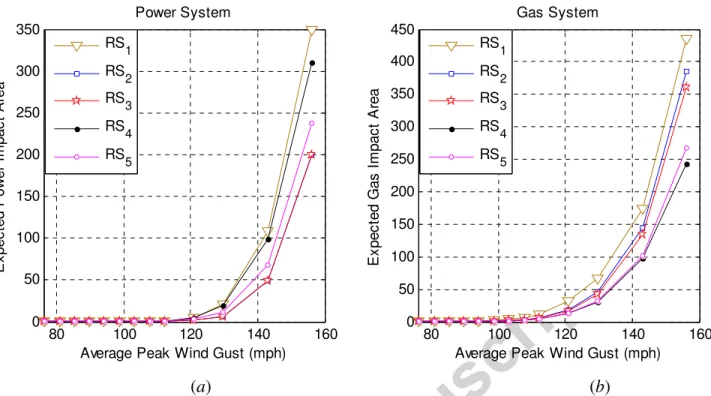
This is mainly because the current settings of the recovery resources make the throttle area of influence much larger than the power area of influence, and then an equally weighted sum of the power and throttle areas of influence as an objective function for the RS5 will return the smallest throttle area of influence close to that of the RS4. To investigate this question, this article selects some other hurricanes with different average peak wind gusts ranging from 76 to 156 mph, and simulates their expected power and gas impact areas under different recovery strategies, with the results shown in Fig. The simulation times for different hurricanes vary from 200 to 1000, so that the mean areas of influence for all strategies converge with a deviation of less than 0.1%.
Note that for various hurricanes the recovery resources are still specified as rp=10 units for the electric system and rg=1 unit for the gas system. The figures show that for different hurricane intensities, the random strategy RS1 always produces the largest impact areas for both systems, while the independent strategy RS2 and the gas-first strategy RS3 always produce the least IAP, and the gas-oriented strategy RS4. always yields the minimum IAG. Furthermore, for low-intensity hurricanes with few damaged components, different restoration strategies result in nearly identical areas of impact; for hurricanes of high intensity with extensive damaged components, the expected power or
Hurricane resilience assessment
In addition, if the total resilience of both power and gas systems is quantified as the equally weighted (weighting coefficients are both 0.5) sum of individual system resilience, the results are also shown in Table 1. It can be found that the power and gas compromised strategy RS5 produces the greatest total resilience, while the randomized strategy RS1 is still the weakest one. Note that depending on the resilience weight coefficients assigned to each system, the total resilience value as well as the best recovery strategy can be varied.
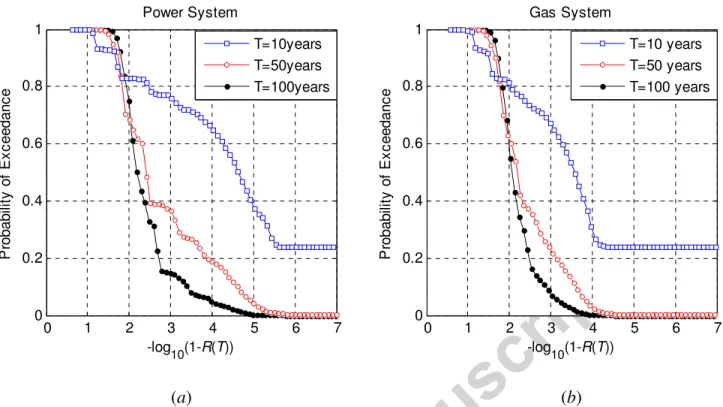
When the resilience weight coefficient of the power system is greater than 0.72, the RS3 energy first and gas second strategy is the best; when the resilience weight coefficient of the energy system is greater than 0.18 but less than 0.72, the RS5 energy and gas strategy is the best; when the resilience weight coefficient of the power system is less than 0.18, the gas-oriented strategy RS4 is the best. Note that all of these best recovery strategies have taken interdependencies into account, meaning that considering infrastructure interdependencies during recovery decision-making is critical to increasing the resilience of interdependent systems. To display these curves clearly on the same graph, the spring force R(T) is represented in a logarithmic form –log10(1-R(T)).
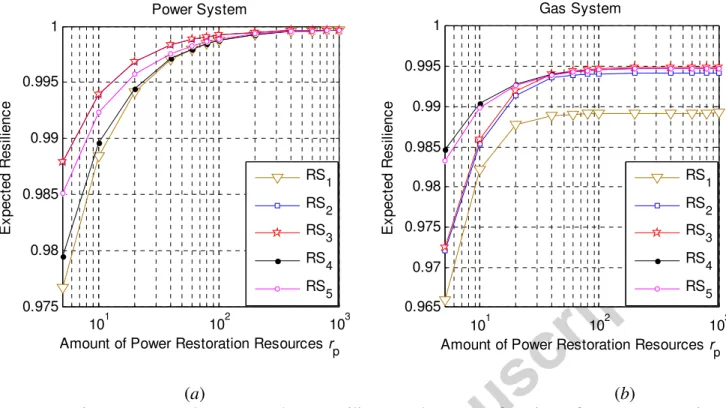
From the figures, the larger the T value, the greater the probability that a high power or gas resistance value can be reached. To investigate their relationships, this paper sets several other values of rp while rg is fixed as 1 unit, and then estimates the expected force and gas resistance as a function of rp, with the results shown in Fig. From the figures, it can be found that under limited restoration resources (small rp), different restoration strategies lead to largely different resilience values, with the random strategy RS1 producing the least resilience for both systems, the independent strategy RS2 and power first and gas second strategy RS3 both generates the greatest resilience for the electrical system, while the gas-directed strategy RS4 is the best for the gas system, with the power- and gas-compromised strategy RS5 only slightly worse than RS4.
In addition, as rp increases, the five recovery strategies produce an ever-closer value of resilience for the power system; and for the gas system, strategies RS3, RS4, and RS5, all of which consider interdependencies, finally produce almost identical resistance values at large rp. This is because at high RPM, different power recovery strategies will produce the same power influence area and the same power recovery time for gas nodes, then strategies RS3, RS4 and RS5 actually have the same optimization goal, which is to minimize gas possible measure. area of influence, so for sufficient resources to restore electricity, the areas of gas influence under these three strategies are the same. As the amount of gas recovery resources rg increases, similar results are found and all recovery strategies, including the random strategy RS1, produce closer and closer to the expected gas resistance until it is exactly the same.
Discussions and Conclusions
Note that this article only considers technical resilience for illustrative purposes, but the framework can easily be extended to also consider organizational, social and economic resilience when other metrics are used to measure system performance levels [ 23 ]. Moreover, when applying the proposed framework to other systems, it requires changing a number of system parameter values, such as hazard type and return periods, component fragility curves for the specific hazard type, system property data, flow-related data, interdependent relationships, quantity of the resources and their mobilization degree, among others, but the main procedures and methods for assessing resilience are similar. Also, this article only considers unidirectional interdependencies between systems, where addressing bi-interdependencies and analyzing their impact on multi-system recovery processes and resilience assessment are more interesting and will be our future research directions.
Finally, collecting more sufficient data for overall validation of the framework, identifying possible resilience-based improvement strategies, such as the installation of backup power generators, and analyzing their effectiveness from a life-cycle cost-benefit perspective are also interesting topics in the field of resilience engineering.
Acknowledgements
10] Infrastructure Security Partnership (TISP) - Regional Disaster Resilience: A Guide to Developing an Action Plan (2011 Edition). 12] NIAC, National Infrastructure Advisory Council - Critical Infrastructure Resilience Targeting Framework, Final Report and Recommendations; 2009. A framework for assessing the resilience of infrastructure and economic systems, in Sustainable and Resilient Critical Infrastructure Systems: Simulation, Modeling, and Intelligent Engineering, Kasthurirangan Gopalakrishnan and Srinivas Peeta, eds., Springer-Verlag, Inc.
Managing the risk of terrorism to interdependent infrastructure systems through the dynamic input-output model of inoperability. Dealing with outages of critical interdependent infrastructures related to the 2001 World Trade Center attack. Comparisons of pure topological model, betweenness based model and direct current flow model to analyze power grid vulnerability.
Comparisons of complex network-based models and DC current models to analyze the vulnerability of the power grid to intentional attacks. Prepared for the Florida Electric Utilities and submitted to the Florida Public Service Commission by order PSC-06-0351-PAA-EI, May 2008. A Monte Carlo approach to assessing the suitability of the European gas transmission system under conditions of a supply crisis.
Proceedings of the 6th US-Japan Workshop on Earthquake Disaster Prevention for Line Line Systems, Osaka City, Japan, 1995.
Research Highlights
Figure 1: Typical performance process of an infrastructure system over a time period T with several disruptive events (adapted from reference [22]). Figure 2: A geographic representation of power and gas systems in Harris County, Texas (adapted from reference [34]). Fig.3: A hurricane scenario in Harris County grouped into category 3 (excerpt from reference [23], note that the wind speeds on the map are peak gusts, while the hurricane category is grouped by sustained wind speed, the former is assumed to be equal the latter multiplied by 1.08 to group hurricane scenarios into a given category).
The restoration resources are 10 units for the electrical system and 1 unit for the gas system. The restoration resources are set at 10 units for the electrical system and 1 unit for the gas system.