Each discipline has its own methods and tools, and since modeling is (often tacitly) central to research, a comprehensive understanding of the subject is required if interdisciplinary work is to be successful. Since modeling covers all areas of science, it is impractical to provide a comprehensive description of the topic.
Introduction
To achieve this, we will provide an overview of the history of models and modeling in various disciplines. To connect with the actual use of models in modern science, we will present the results of a qualitative interview study examining the views of models and modeling among a range of researchers.
Models as Illustrations and Illustrations as Models
What the above examples show is that simple models can be seen as illustrations of a system or process, and that there are a number of ways to illustrate a given system. The answer naturally depends on context and purpose, as in the case of bacterial growth discussed on p.

Three Routes to Modelling
The figure highlights an important feature of scientific models; they are never an exact replica of the system we seek to understand. Nevertheless, one can easily recognize the person in the drawing, which reveals the skill of the artist.

Why Do We Use Models?
In the process of isolating subsystems, we create distinct boundaries that provide a basis for further investigation of the system. It provides a compact description that has the ability to explain the structure of the phenomenon in a pedagogical way.
History
It Started as an Analogy
3This famous move was made by René Descartes, who in his book Les passions de l'âme (1649) argued that man was made of two distinct substances res cogitans (mental substance) andres extensa (corporeal or extended substance), and that the communication between two occur in the pineal gland in the brain. Based on this analogy, Maxwell was able to deduce the properties of the magnetic field using the laws of classical mechanics.
Abstraction
Followers
An explanation that is based on a model is asimplication, which, despite neglecting many aspects of reality, gives a satisfactory answer, while a simple explanation assumes that the world itself is simple. Humourism postulated that the human body consisted of only four distinct elements, not that the body acted as if it were so simple.
Mechanisms
To a certain extent, these explanations can be considered as models in themselves, since The dynamics of a system can be described verbally (as above), graphically as a flowchart, or quantitatively with one or more mathematical equations.
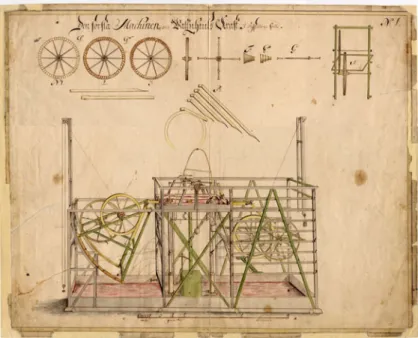
Christopher Polhem—A Modelling Pioneer
1 A drawing of Christopher Polhem's "Hydrodynamic Experimental Machine". Source The library of the Royal Institute of Technology, KTH, Stockholm. Polhem was also the first engineer to suggest that experiments with scale models of ships in a gutter could be used to investigate how the shape of the hull affects a ship's watertightness.
The Concept of a Model
Models are] physical or mental systems that reflect the essential properties of the phenomenon being studied.2. 1 The model house is built on top of the Conceptual Basement, which forms the basis for quantitative modeling. For more information about the model house we would recommend a visit to the Iconic Playground where a detailed scale model of the house itself can be studied.

Phenomena, Theories and Models
The degree of specificity is obviously a sliding scale and depends on a number of factors, such as the complexity of the system and the desired accuracy of the model. Finally, there are no set rules when it comes to the complexity of the model itself, i.e., this implies that different parts of the model must correspond to distinct parts of reality that are relevant to the phenomenon.

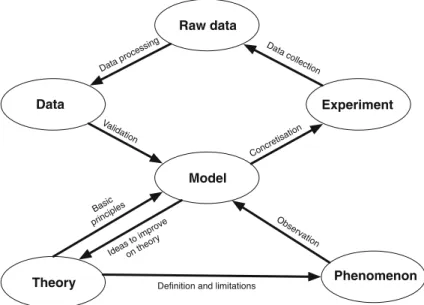
Creating and Using Models
We are now able to compare the model predictions with experimental data. Therefore, there is an obvious trade-off between the complexity of the model and the experiment required to validate it. Parameters take numerical values and correspond to certain properties of entities or the strength of interactions between entities in the model.
All Models Are False, but Is Anything at Fault?
An important aspect of using models is therefore to examine how sensitive the model is to perturbations of the parameter values, a procedure known as robustness or sensitivity analysis. Not only are the interactions incorrect, but also a significant number of the entities and/or their properties do not exist. 28Here Wimsatt presents the spectrum of models as one-dimensional, which is an idealization of the true space of possible models.
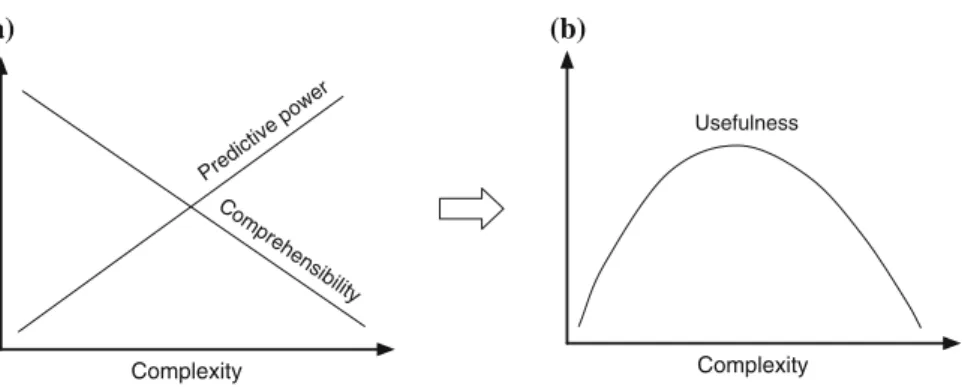
The Right Thing or a Right Mess?
We have assumed that usability is a product of predictive power and understandability. Starting with a simple model in field I, it is possible to envision different trajectories: (A) the understandability and predictive power of the model both initially increase, but as complexity increases, understanding of the mechanisms operating within the model and hence comprehensibility suffers; (B) mathematicians and physicists often strive for simple models and care less about predictive power; and finally (C) a model could also evolve towards greater predictive power without giving any understanding of the phenomenon. Consistent with the above discussion, we conclude that models in field III, which exhibit both high predictive power and comprehensibility, are superior.
Generality and Diversity
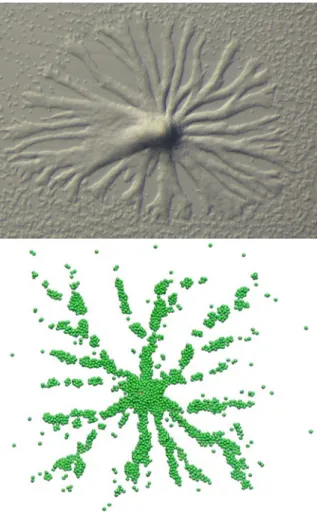
An example of pluralism between models are two different models that both describe the spawning of the slime mold Dictyostelium discoideum. The substance also triggers other cells to produce it and simultaneously move in the direction of the signal. The upper panel shows the accumulation of true slime mold where the fruiting body begins to form in the center of the colony (© Rupert Mutzel, Freie Universität Berlin).
The Dangers of Modelling
A concrete example of this is the laminar fluid flow models, which are only valid if the fluid velocity is small (or when the system is characterized by a low Reynolds number). If the velocity increases, the flow characteristics change from laminar to turbulent, and this type of flow requires a different type of model to describe it properly. An example of this is the model of the atom designed by Niels Bohr in 1913.
What Is a Model?
Climatologist: A model is a description of a system that one wants to study, which can be used to understand the system. In the case of bacterial growth in the introduction (p. 2), the carrying capacity Land is the initial populations(0) preconditions. The purpose of a model is (by being a simplified description) to create understanding of a phenomenon, but it is also used to make predictions.
How Do You Use Models in Your Research?
There is a specific purpose to the model, and it describes/represents/reflects a limited part of reality. In teaching I mainly use models in the third sense, while in my research I use models in the second sense, that is, this is the key to translational research, that the model actually reflects the dynamics of the real thing.2.
What Makes One Model Better Than Another?
Neurologist: If the model reflects the true state of the system to a high degree, and in addition is manipulable. Since the long-term goal is to develop new drugs, it is important that one can manipulate the model. The question of the value of a model is obviously difficult to answer, and many scientists consider it a trade-off between the comprehensibility of a model and its ability to make accurate predictions.
Have You Ever Met People with Ideas Different from Yours When It Comes to Models and Modelling?
Climatologist: I was once talking to a colleague who works in a different field and told him that I work on models based on physical principles, and in return I got a sharp reply: "Models are not physical!" The person worked on statistical models or models based on statistical relationships. In my opinion, it is important to start with a top-down approach that gives a rough picture of the system. The mathematician's view is based more on the different ambitions that scientists might have when it comes to models.
What Is the Difference Between Theory and a Model?
A similar issue is raised by the climatologist, who focuses on the difference between mechanistic and statistical models. The astronomer describes a common view of models as "simple models" and also emphasizes the importance of false models. The economist has encountered a similar skepticism about models in the social sciences, believing that certain phenomena, such as human behavior, are too complex to capture in simple mathematical models.
Concluding Remarks
At the same time, it appears that the concept of a model differs between the disciplines: partly in the vision of what can be achieved with a model, partly in the range of models that are applied. And it is in the sense of a tool by which the scientists can approach and examine reality that the different meanings converge and the similarities become clearest. The aim is to cover all types of models presented in the model taxonomy (p. 28) and also to review models belonging to the fields represented by the scientists in the previous chapter.
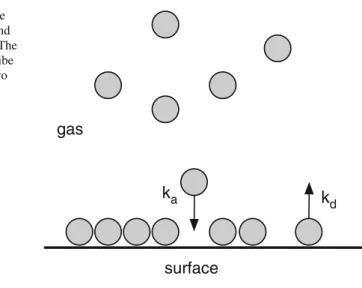
Langmuir Adsorption
Gas It is absorbed on the surface at a rate that is proportional to the partial pressure of the gas (this is because the number of collisions that occur per unit time is proportional to the pressure). 2 The Langmuir isotherm describes how much of a surface is covered by adsorbed molecules as a function of gas pressure. This relationship is usually called the Langmuir isotherm and describes the fraction of the surface that is covered θ (when the temperature is constant) as a function of K and pressure p.
Rainfall-Runoff Models
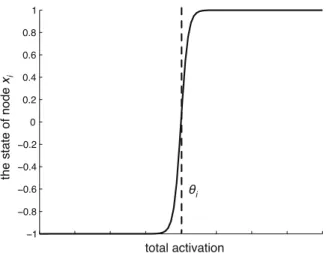
The network functions in the following way: First, data is presented to the in-layer, i.e. the node values are set to the values of the known variables. With the help of Eq. 5) the values of the nodes in the hidden layer(s) are then calculated, and finally the state of the nodes in the outer layer is calculated. 3 The activity of a neuron in a neural network as a function of the input provided by the other neurons in the network.
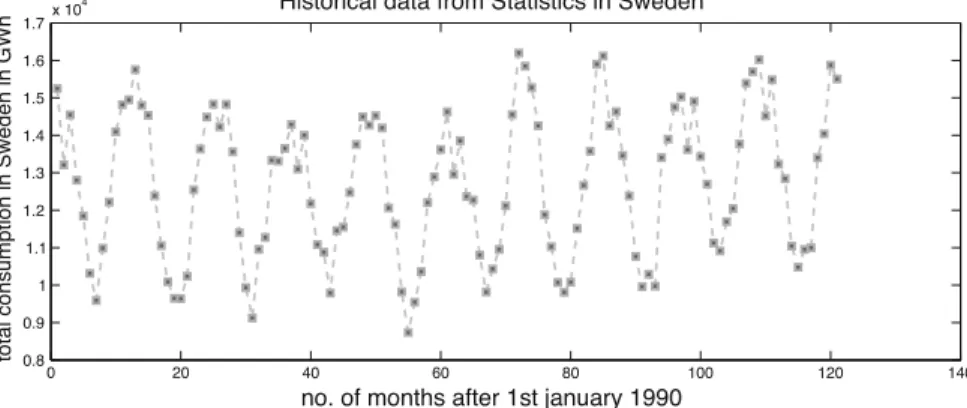
A Statistical Model for Time Series
If we let yh(x) denote the historical consumption in the month xandym(x) the prediction made simultaneously by the model, then we seek the function ym that minimizes the sum over all time points. We answer this by plotting the difference between the actual result and the model prediction. If the difference is centered around zero and random, then the model is doing a good job.
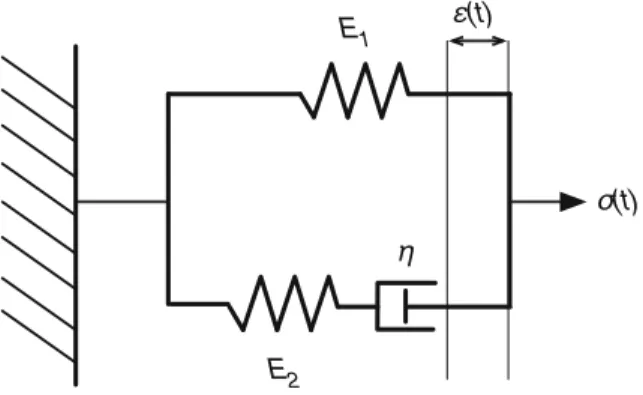
The Standard Linear Solid Model of Cell Biomechanics
78 Worked examples What happens to the shape of the cell when it is subjected to a force. The membrane, the fluid and the interactions between the two are essentially what determine the mechanical properties of the cell. This equation states that the voltage in the dashpot is proportional to the rate of change of the load, i.e.
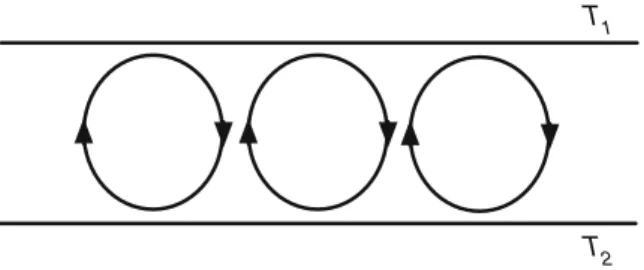
From Weather to Chaos
This system, at least superficially, resembles the dynamics in the atmosphere, where air is being heated near the Earth's surface, rises, cools, and falls to the ground. The constants σ,r and deb depend only on the physical properties of the fluid, such as viscosity and thermal conductivity. The model does not have any predictive power, but instead makes it possible to explain a specific property of the weather, its sometimes unpredictable behavior.
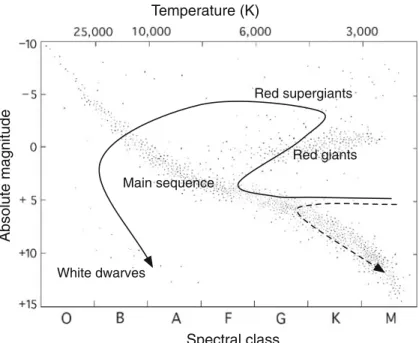
The Hertzsprung–Russell Diagram
This pattern was an important discovery in itself, but the main consequence of the HR diagram was that it gave astronomers a powerful tool to investigate the evolution of stars. At this stage, the star is running out of nuclear fuel and the stellar wind reduces the star's mass. The outer parts are thrown off and at the same time the core contracts to form a small, high-density, high-surface-temperature white dwarf star that resides in the lower left corner of the HR diagram.
Mouse Models of Neurofibromatosis
In the first step of the process, a mutated copy of the gene in question is made and inserted into embryonic stem cells, where it is incorporated into the DNA of cells by homologous recombination. This suggests that NF1 plays a central role in the development of the mice and in the formation of internal organs. When a germ cell containing the mutated gene fuses with a normal germ cell, a mouse is created with a single mutated copy of the gene, i.e.
Scale Models in Ship Engineering
The purpose of this study was to estimate the wetted area of the hull at different speeds. Such a setup can be seen in Fig.14, where it was used to estimate the area of the hull submerged in water at different speeds.23 It is also possible to add small particles to the liquid and in such a way follow the liquid's movements along the hull. It is clear that the speed of the water relative to the hull is highest at the bow (front) and very low in the turbulent flow behind the stern.

Further Reading