This report was prepared as a statement of work sponsored by an agency of the United States Government. The views and opinions of authors expressed herein do not necessarily indicate or reflect those of the United States Government or any of its agencies. To determine how realistic the model performance is, the performance of one of the models (double-fed induction generator model) has been validated using real-world wind farm data.
Introduction
- Background and Motivation
- The changing power system
- Wind power integration and wind turbine modeling
- Research Objectives
- Wind Turbine Technologies
- Modern utility-scale wind turbines
- Classification of wind turbines
- Contributions
- Brief Summary
The need for robust generic models of wind turbines and wind farms motivated the research described here. The AC/DC/AC converter is the only path of power flow from the wind turbine to the grid. In this report, Chapter 2 deals with the modeling of fixed speed wind turbines (Type 1) and Chapter 3 with the modeling of variable slip wind turbines (Type 2).

Modeling of Fixed-Speed (Type 1) Wind Turbine Generators
- Introduction to Wind Turbine Modeling
- Aerodynamics
- A brief introduction to the aerodynamics of wind turbines
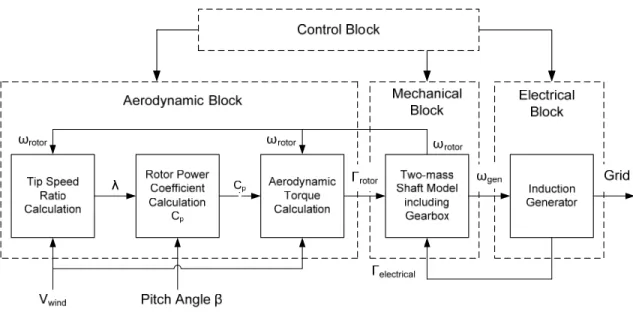
- Aerodynamic Block
- Tip-speed ratio calculations
- Rotor power coefficient (C P ) calculation
- Aerodynamic torque calculation
- Mechanical Drivetrain
- Induction Generator
- Control Block
- Complete Model Implemented in PSCAD/EMTDC
- Power Curve for Fixed-Speed Model
- Dynamic Response
- Summary
The quantities on the wind turbine rotor side of the gearbox can be reflected to the generator side. This eliminates the gear ratio and results in a two-mass representation of the wind turbine (Figure 2.5b). A stress pocket on the grid was simulated, and the real and reactive power response of the wind turbine was observed.
Modeling of Variable-Slip (Type 2) Wind Turbine Generators
- Rotor Resistance Control Concept
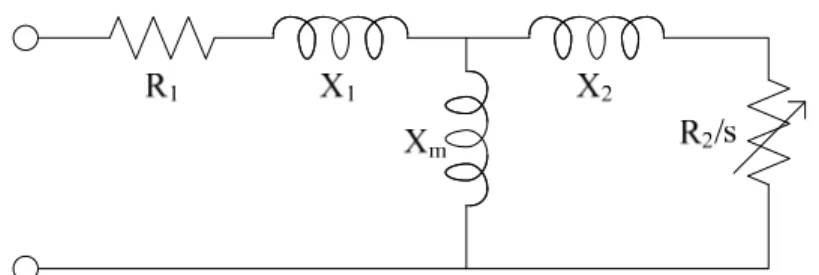
- Induction machine equivalent circuit
- Effect of rotor resistance change on equivalent circuit and torque and power equations
- Methods for Rotor Resistance Control
- Model implementation
- Two-loop PI controller based on output power and rotor current
- Dynamic Response
- Summary
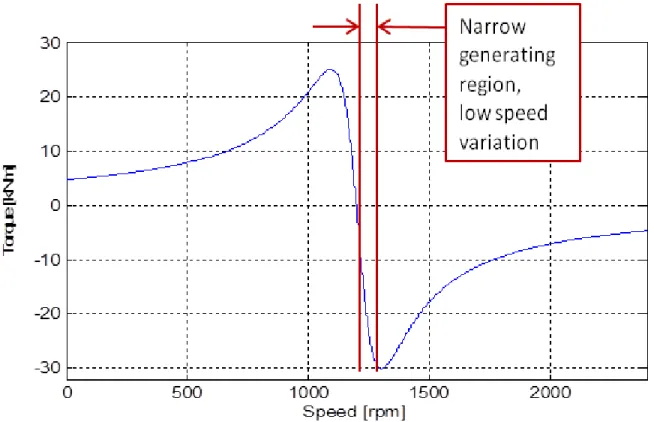
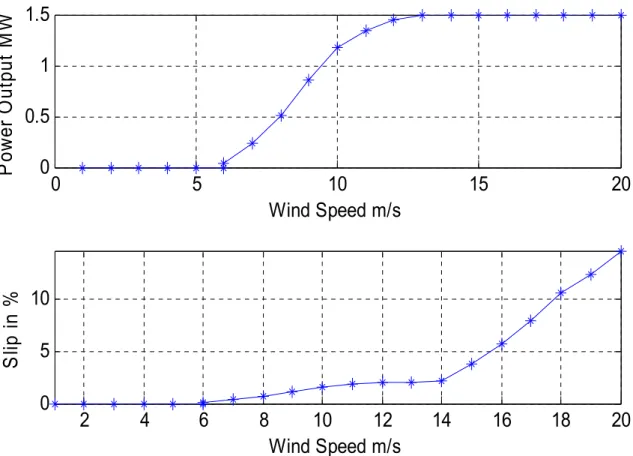
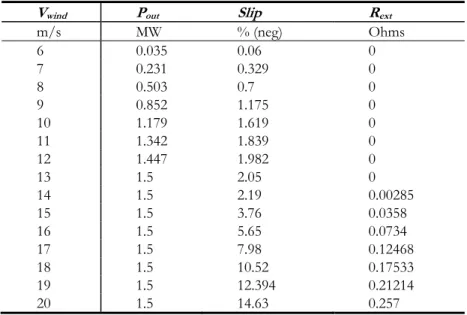
Because of the turns ratio of the transformer, the value of Rext in Figure 3.4 will not necessarily equal the actual resistance. For motor operation, it can be seen from Figure 3.5 that higher rotor resistance gives high starting torque, but also causes increased losses during normal operation, due to the power dissipated in the rotor resistance. By comparison, the curve for the fixed-speed wind turbine shown in Figure 2.9 drops off at higher than rated wind speeds.
Modeling of DFIG (Type 3) Wind Power Plants: Current Source Representation
Introduction to DFIG Technology
Prior Work on DFIG Dynamic Modeling
- Work done under IEA Wind Annex 21
Establishment and operation of a common database for comparative testing of wind turbine and wind farm models to help ensure quality models. The models built as part of this task had a lot of detail, and although the framework was general, the models themselves depended on the manufacturer. Part of the research described in this chapter, namely the development of a general model for VE DFIG, can be seen as an extension of the work done in this thesis.
Three-Phase Model: Development and Implementation
- Doubly-Fed Induction Generators: Basic Concepts
- Modeling Approach: Use of Regulated Current Source instead of Detailed Device Models
- Implementation of DFIG WPP Model in PSCAD/EMTDC
- Model Development Summary
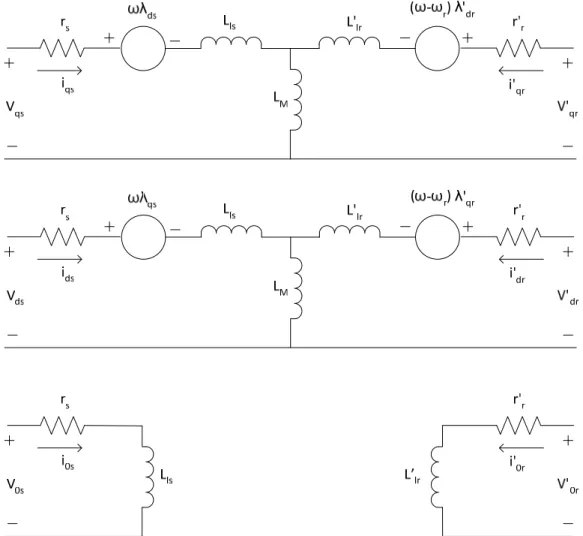
The electrical dynamic performance of the DFIG at the base frequency is dominated by the converter. Time-varying quantities can be made time-invariant by transforming them into a suitable rotational reference frame, i.e. Because they are angular velocities. the stator magnetic field and the rotating frame qd0 are the same, the stator magnetic field vector is fixed with respect to the q and d axes of the rotating frame qd0.
Let the d-axis of the reference frame be oriented so that it aligns with the stator magnetic field vector. Converter Control Subsystem: This subsystem consists of Reactive Power Control and Real Power Control subsystems. To relate the d-axis of a synchronous rotating frame of reference to the stator magnetic flux, the instantaneous angular position of the stator magnetic flux must be known precisely.
The magnitude of the stator current for this particular case is time-invariant at 74.7 Wb. With the position of the stator magnetic field precisely known, the d-axis of the synchronous rotating reference can be oriented as desired. Parameters and power signals for active and reactive power regulation are per unit of WPP specified MW power (specified on MBASE hardware basis).
Therefore, the step depends on both the instantaneous speed of the wind turbine generator and the actual output power of the wind turbine.

Three-Phase Model: Steady-State Performance
- Method of Computing Real and Reactive Power in the qd0 Frame with Validation
- Wind Power Curve
- Reactive Power Control and Less-Than-Maximum Power Output
- Changes in Wind Speed
- Model Performance Summary
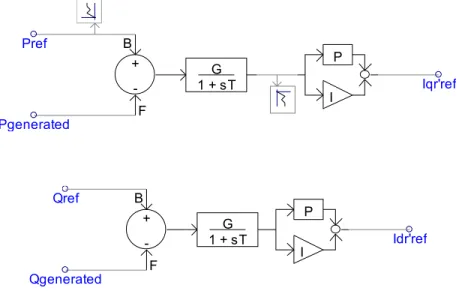
First, the calculation in the qd0 domain was validated, used to calculate real and reactive power. QgenRef is the reactive power requested from the WPP (the reactive power that the WPP is supposed to supply to the infinite bus). Phasor domain calculations and qd0 domain calculations for real and reactive power are discussed in the following subsections.
The total three-phase power is the sum of individual phase real and reactive power. The reactive power is kept practically constant, which verifies that a change in the real power does not cause a change in the reactive power. In this section, the power change in reactive power demand on the performance of the time domain model is observed while keeping the wind speed at the nominal value of 13 m/s.
Figure 4.27 shows the real and reactive power variation during a change in reactive power demand. The active power output remains unchanged during the change in reactive power, indicating that the real and reactive power controllers are decoupled. In this section, the reactive power demand is kept constant, Pset is set to unity and the wind speed is varied.
The claim made in the previous section that real and reactive power can be
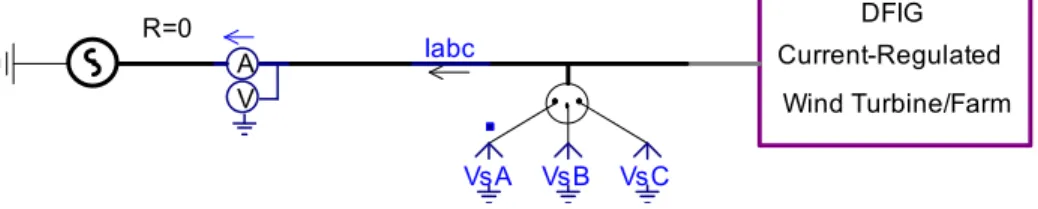
Three-Phase Model: Validation Using Field Data
- Introduction to the Validation Process
- Collector System
- Steady-State Validation: Pre-Fault
- Dynamic Performance
To accurately model the behavior of the DFIG WPP during fault conditions, the collector system was included in the time domain model. Before evaluating the performance of the time-domain model during fault conditions, the steady-state performance of the model must be evaluated. Comparison of actual prefault data with prefault data from time domain simulation can thus be used to validate the steady state performance of the time domain model.
In each case, the results of the time-domain model matched the results calculated from the actual data, and the model was validated. The results in Figures 4.34 and 4.35 show that the results from the actual data and the time domain model are in close agreement with each other, as well as with the estimate from the phasor. The results in Figures 4.37 and 4.38 show that the results from the actual data and the time domain model are in close agreement with each other, and they are also in agreement with the phasor domain estimate.
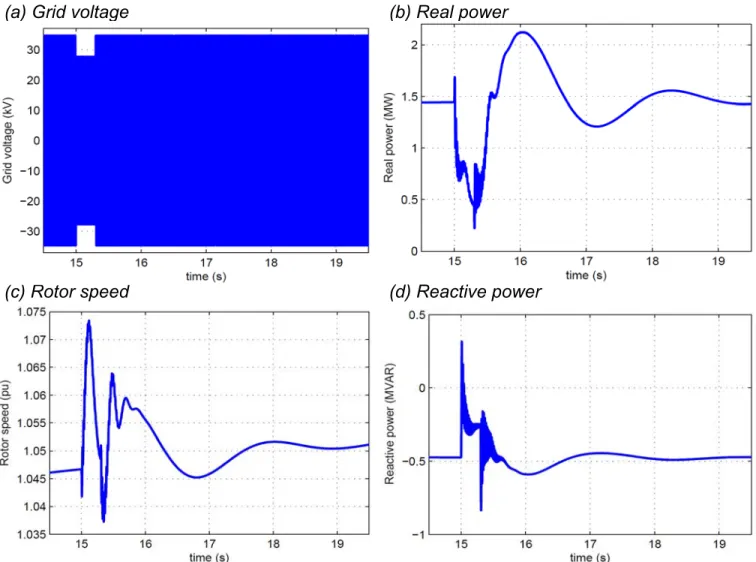
For each of the three cases, the real power and reactive power values generated from the actual data and the data obtained from the time domain model are in close agreement. To evaluate the dynamic performance of the time-domain model under fault conditions, the validation procedure shown in the flowchart in Figure 4.31 is used. We can see that the voltages from the actual data and the time domain model are the same; this indicates that the voltage data is entered correctly.
The value of the proportional gain setting on the q-axis power PI controller had a pronounced impact on the actual power output of the time-domain model.

Summary
DFIG (Type 3) Wind Turbine Generators: Single-Machine Detailed Model
- Introduction
- Model Development
- Aerodynamic and Mechanical drivetrain models
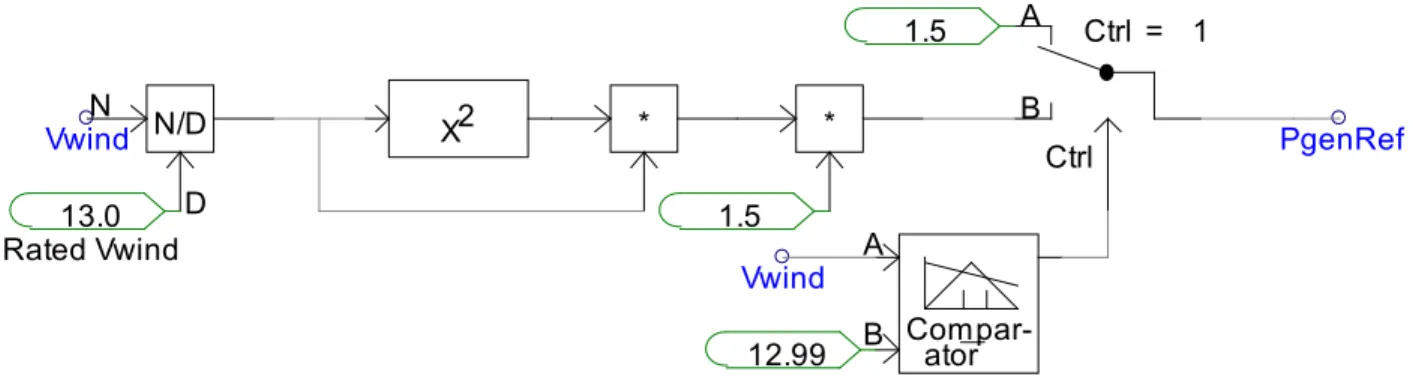
- Reference power calculation
- Pitch control block
- Induction generator
- Rotor and grid side converter control for DFIG
- Unit transformer and grid representation
- Complete model implemented in PSCAD/EMTDC
- Model Testing
- Power curve
- Independent real and reactive power control
- Pitch control
- Dynamic Response
- Summary
Assuming that the grid-side converter maintains a constant DC link voltage, the role of the rotor-side converter is to inject rotor-frequency (alternating) currents into the rotor circuit in such a way that decoupled active and reactive power control is achieved. To test whether independent real and reactive power control was achieved, four tests were performed: real power drop, reactive power drop, real power gain, and reactive power gain. Each of these is modeled as a step change, i.e. at a specific moment the simulation was interrupted and a step change was made to either the wind speed or reactive power demand.
In the second test, a drop in reactive power was simulated. remains at 14 m/s throughout the flow, but the reactive power requirement has changed from 0.4 MVAR to 0.0 MVAR at t=17s. In the fourth test, we simulated an increase in reactive power. remains at 13 m/s throughout the flow, but the reactive power requirement has been changed from 0.0 MVAR to 0.4 MVAR at t=11 s. The real power output again shows a slight disturbance, but returns to its original value. a) Real power drop (b) Reactive power drop.
The d-axis current does not change as the reactive power setpoint is not changed. The results show conclusively that a change in either real power or reactive power demand does not affect the other quantity except momentarily. Based on the results of the testing, we can claim that the goal of independent real and reactive power control has been achieved.
The power curve requirements have been met, the decoupled real and reactive power control requirements have been met, and the pitch controller is operating as expected.
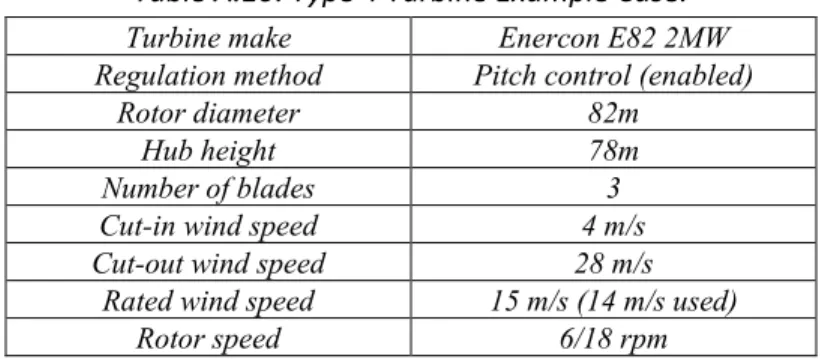
Modeling of Full-Converter (Type 4) Wind Turbine Generators Employing Permanent Magnet
- Introduction
- Model Development
- Aerodynamic and mechanical drivetrain models
- Reference power calculation from wind speed
- Pitch control block
- Permanent magnet alternator
- Rectifier and buck/boost converter for DC-link voltage control
- Inverter
- Unit transformer and grid representation
- Complete model implemented in PSCAD/EMTDC
- Model Testing
- Power curve
- Independent real and reactive power control
- Pitch control
- Dynamic Response
- Summary
The pitch control block (Figure 6.2) changes the pitch angle of the blade at speeds higher than the rated wind speed to shed excess energy. It is capable of decoupling real and reactive power control, as the controller design for this inverter is based on flux vector theory. The real and reactive power reference signals are compared to the actual values and the error is used to drive two independent PI controllers, as shown in Figure 6.8.
The real power error drives the Iq signal, while reactive power error drives the Id signal. The wind strength remains at 13 m/s throughout the run, but the reactive power requirement was changed from 0.5 MVAR to 0.2 MVAR at t=12s. The wind strength remains at 13 m/s throughout the run, but the reactive power requirement was changed from 0.5 MVAR to 0.7 MVAR at t=12s.
The results here conclusively show that a change in real power or reactive power demand does not affect the other quantity. Based on the test results, we can claim that the objective of independent control of real and reactive power has been achieved. a) Real power drop (b) Reactive power drop. From the results shown in Figure 6.17, it can be seen that the pitch controller becomes active when the wind speed change occurs.
6.18, it can be seen that the real and reactive power increase sharply when the event starts.
Conclusion and Future Work
Conclusion
Future Work
Fixed-Speed (Type 1) Single Turbine Estimated Ratings and Parameters (note: parameters modified for
Variable-Slip (Type 2) Single Turbine Estimated Ratings and Parameters (note: parameters modified for
Doubly-Fed Induction Generator (Type 3) Single Turbine Estimated Ratings and Parameters (note
Stator winding resistance 0.017 pu Stator leakage reactance 0.064 pu d-axis unsaturated reactance 0.55 pu q-axis unsaturated reactance 1.11 pu.
Fifth-Order Model
Third-Order Model
Wrede, “Wind Turbine Modeling Based on Doubly Fed Induction Generators for Power System Stability Studies,” IEEE Transactions on Power Systems, vol. P¨oller, “Dual-Feed Induction Machine Models for Sustainability Evaluation of Wind Farms,” in IEEE Power Tech. Nolan, "Dynamics and stability of wind turbine generators," IEEE Transactions on Power Apparatus and Systems, p.
Bose, "Stability simulation of wind turbine systems," IEEE Transactions on Power Apparatus and Systems, pp. Kling, "Dynamic modeling of a wind turbine with doubly fed induction generator," in IEEE Power Engineering Society Summer Meeting, vol. Santoso, "Electromechanical and Time Domain Modeling of Wind Generators," in IEEE Power Engineering Society General Meeting, (Tampa, FL), June 2007.
Muljadi, "Validation and analysis of wind farm models using short-circuit field measurement data," in IEEE Power and Energy Society General Meeting, (Calgary, AB), July 2009. Santoso, "Using generic wind turbine models to compare inertial response of wind turbine technologies," in IEEE Power and Energy Society General Meeting, (Minneapolis, MN), July 2010. Kling, "Aggregated modeling of wind farms in power system dynamics simulations," in IEEE Power Tech.
Muljadi, “Rotor variable resistance control of wind turbine generators,” in IEEE Power & Energy Society General Meeting, (Calgary, AB), p.