This finding is consistent with the view that abnormal trading volume is a proxy for unobserved attention-grabbing events. More recent studies focus on whether there is a relationship between trading volume and expected returns. This finding results in a high return premium, meaning that abnormal trading volume contains information about future price movements.
Thus, abnormal trading volume is more likely to be attributable to the result of differences in opinion or overconfidence (Glaser and Weber. The difference then increases with the volatility of trading volume in the previous n-month period.2 Advantage of using this measure Second, we want to examine the longevity of the high-volume effect, and the monthly trading volume is also consistent with the frequency of data on the number of outstanding shares available in this market.
6 we further discuss how institutional trading affects the relationship between return on equity and trading volume. An important methodological concern is the extent to which trading volume correlates with stock visibility.5 If a high-volume strike attracts investors' attention and then. 5 Empirically, abnormal trading volume has been used as an indicator for an unobserved attention-grabbing event.
ACCEPTED MANUSCRIPT
Empirical results 1 Portfolio sorts
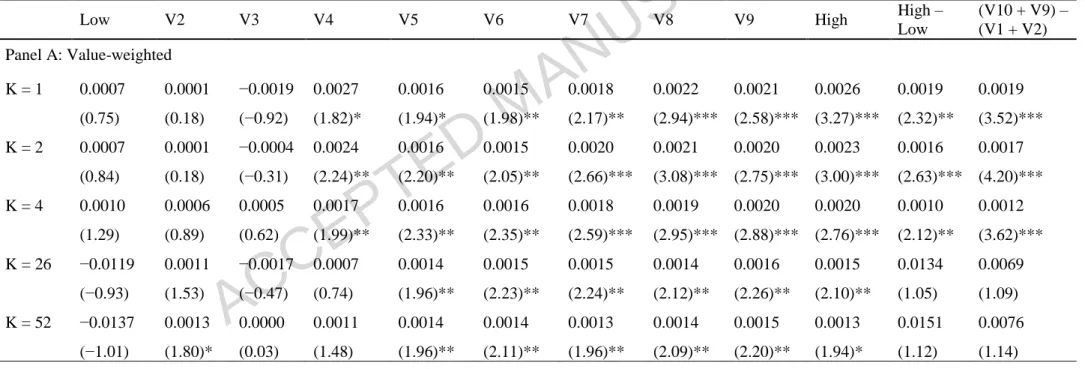
13 Panels A and B of Table 2 present the average monthly portfolio returns for each of the decilar portfolios over different holding periods for the value-weighted and equity-weighted methods, respectively. There is evidence of a volume shock return premium, as the strategy of buying the high VOSHOCK portfolio(s) and selling the low VOSHOCK portfolio(s) is statistically significant for most of the holding periods analyzed. For example, among smaller firms, Huang and Heian (2010) show that the average weekly volume shock returns are 0.25% and 0.03% per week when holding periods are 4 and 52 weeks, respectively.
Overall, the results from this section indicate that investors can earn significantly positive abnormal returns from a volume shock trading strategy. It is important to note that the magnitude of the coefficients decreases for holding periods longer from the volume shock month. One of the possible explanations for this empirical finding is that stock turnover (or trading volume) acts as a proxy for liquidity, where less liquid stocks (low trading volume) generate higher expected returns (Amihud and Mendelson, 1986).
More importantly, the relationship between VOSHOCK and stock returns remains strong in the presence of stock turnover, suggesting that the volume shock premium is not a result of trading volume levels. The explanatory power of VOSHOCK remains strong and its impact on returns is only marginally smaller compared to the base case. The signs of the size, book-to-market and momentum variables are consistent with empirical results.
The magnitude of the coefficients also remains fairly consistent across different regression specifications across the three panels. The volume shock effect remains robust in the presence of other variables, including stock turnover, that are known to affect stock returns. We also check the robustness of the results in the first and second half of the sample period.
In our case, since the degree of overconfidence should increase after market gains, the volume shock effect should be weaker in bullish markets. Therefore, we investigate how market conditions affect the volume shock returns. 2004), the up and down markets are defined based on 36-month value-weighted market returns prior to the event month.
Volume shocks and investor attention
Since attention is a necessary condition for a stock to receive more public recognition, the effect of a large volume shock due to attention should be stronger for stocks that previously received less recognition from investors. According to this view, changes in trading volume before and after a volume shock could indicate a change in a stock's visibility. Our unreported testing shows that the volume shock effect is stronger in companies without analyst coverage.
A high relative turnover ratio for the holding period indicates an increase in trading volume after the volume shock. The results indicate that the relative turnover ratio is significantly higher after a high volume shock than after a low volume shock for the holding periods analyzed. More importantly, the relative turnover rate is significantly higher after a high volume shock for low profile stocks, that is, those priced below 50 cents, with small market capitalization, and with a low level of institutional ownership and share turnover.
This result is consistent with the view that a high volume shock attracts investor attention and stocks experience increased visibility (high trading volume) following such an attention-generating event. In this section, we examine the effect of volume shocks in stocks with different levels of visibility. We expect the volume shock return premium to be stronger for stocks that were previously less visible to investors.
In addition, we are interested in how changes in institutional ownership at the time of a high volume shock affect volume shock returns. Intuitively, a high volume shock coexisting with a large (positive) change in institutional ownership suggests that institutional investors buy more than individual investors. If a high volume shock does increase a stock's attention and makes the stock more recognizable later, higher returns should be logical regardless of which group of investors buys.
This result is expected, as the effect of a volume shock due to increased attention should be marginal only for stocks that were already visible to investors. We expect the difference between the VOSHOCK coefficients for the low and high visibility groups to be statistically significant for holding periods closer to the initial volume shock.
Are volume shock effects priced?
These results provide further evidence that extreme volumes are informative about future returns, independent of the type of investors who react to the event.19. 21 To investigate whether the VOF is related to future stock returns, we perform a univariate portfolio sorting. At the end of each month, stocks are sorted into decile portfolios based on the ranking of βVO.
Both equal and value-weighted risk-adjusted portfolio returns are calculated over the following month.20 Panel A in Table 8 presents the results. We also run cross-sectional regressions to examine the explanatory power of βVO, in the spirit of Daniels and Titman, we include both VOSHOCK and βVO in cross-sectional regressions to explore their explanatory power. In the first model, stock returns at time t+1 are regressed on both VOSHOCK and βVO at time t.
In summary, the results in this section do not provide evidence that volume shocks are a priced risk factor.
Conclusion
More importantly, the effect is robust after controlling for other firm characteristics known to affect stock returns. Furthermore, the correlation between volume shocks and stock returns is stronger for stocks that previously did not capture investors' attention. Australian Stock Market Anomalies: A Review and Re-Examination of the January and Small Business Effects.
The table lists the number of shares and the average value of VOSHOCK, market capitalization, book-to-market, share price, past returns (t–1 to t–12), the Amihud illiquidity ratio, share turnover, the maximum daily return within month t (MAX), beta, short-term reversals (REV), and idiosyncratic volatility (IV). Beta is estimated based on the market model over the past 252 trading days, IVOL is estimated based on equation (4) over the past 252 trading days, and REV is the stock return in month t. At the end of each month, stocks are sorted into decile portfolios based on VOSHOCK's ranking.
High-Low is the return difference between the highest VOSHOCK portfolio and the lowest VOSHOCK portfolio. The dependent variables are the individual returns of buying and holding stocks over the next 1 (Panel A), 2–6 (Panel B), and 7–12 (Panel C) months. TURN is stock turnover; SIZE is market capitalization; BM is the book-to-market ratio; MOM is the cumulative return of the last 12 months lagged by one month; IVOL is the specific volatility estimated over the last 252 trading days; MAX is the maximum daily return within month t; REV is the stock return in month t; and Beta is the beta of a stock estimated using the market model over the last 252 trading days.
This table reports the turnover ratios for the high and low VOSHOCK quintile portfolios in the first month, second to sixth month, and seventh to 12th month holding periods relative to their previous 12 months (i.e., t–1 to t–12 ) turnover rates. Column shows the difference between the relative turnover ratios of the high-VOSHOCK and low-VOSHOCK portfolios within the more (less) visible stocks, and column (4) − (2) indicates the difference between the high-VOSHOCK portfolio of the less visible group and the high-VOSHOCK portfolio of the more visible groups. At the end of each month, we estimate the sensitivity of individual stocks to volume shocks (βVO) by regressing stock excess returns on the constructed VOF over the past 60 months.
Alpha is the regression intercept from Carhart's four-factor model supplemented with a liquidity factor. TURN is stock turnover; SIZE is market capitalization; BM is the ratio between book value and market value; MOM is the cumulative return of the last 12 months with a one-month lag; IVOL is the idiosyncratic volatility estimated over the last 252 trading days; MAX is the maximum daily return in month t; REV is the stock return in month t; Beta, on the other hand, is the beta of the stock estimated using the market model over the last 252 trading days. Volume shocks on a weekly basis are measured as , where the trading volume of share i in week t is divided by the number of shares in circulation; and are the average and standard deviation of trading volume, respectively, divided by the number of shares outstanding for the stock over the past 26 weeks.
High–Low is the return difference between the portfolio with the highest WVOSHOCK and the portfolio with the lowest WVOSHOCK.